

Abstract
Overnight fasting is a routine procedure before surgery in clinical settings. Intermittent fasting is the most common diet/fitness trend implemented for weight loss and the treatment of lifestyle‐related diseases. In either setting, the effects not directly related to parameters of interest, either beneficial or harmful, are often ignored. We previously demonstrated differential activation of cellular adaptive responses in 13 atrophied/nonatrophied organs of fasted mice by quantitative PCR analysis of gene expression. Here, we investigated 2‐day fasting‐induced protein remodeling in six major mouse organs (liver, kidney, thymus, spleen, brain, and testis) using two‐dimensional difference gel electrophoresis (2D DIGE) proteomics as an alternative means to examine systemic adaptive responses. Quantitative analysis of protein expression followed by protein identification using matrix‐assisted laser desorption ionization–time‐of‐flight mass spectrometry (MALDI‐TOFMS) revealed that the expression levels of 72, 26, and 14 proteins were significantly up‐ or downregulated in the highly atrophied liver, thymus, and spleen, respectively, and the expression levels of 32 proteins were up‐ or downregulated in the mildly atrophied kidney. Conversely, there were no significant protein expression changes in the nonatrophied organs, brain and testis. Upstream regulator analysis highlighted transcriptional regulation by peroxisome proliferator‐activated receptor alpha (PPARα) in the liver and kidney and by tumor protein/suppressor p53 (TP53) in the thymus, spleen, and liver. These results imply of the existence of both common and distinct adaptive responses between major mouse organs, which involve transcriptional regulation of specific protein expression upon short‐term fasting. Our data may be valuable in understanding systemic transcriptional regulation upon fasting in experimental animals.
Keywords: 2D DIGE , fasting, PPARα, proteomics, TP53, transcriptional regulation
Abbreviations
- 2D DIGE
two‐dimensional difference gel electrophoresis
- DTT
dithiothreitol
- GIP
gastric inhibitory polypeptide
- IEF
isoelectric focusing
- IPG
immobilized pH gradient
- MALDI‐TOFMS
matrix‐assisted laser desorption ionization–time‐of‐flight mass spectrometry
- PPARα
peroxisome proliferator‐activated receptor alpha
- PPREs
peroxisome proliferator response elements
- TP53
tumor protein/suppressor p53
Fasting has been practiced for millennia in religious ceremonies among Christians, Muslims (e.g., Ramadan), Buddhism, Jews, Hindus, and others, to reduce physical activities, resulting in a state of ‘quiescence’ like death. It has also been practiced in clinical situations to prevent obesity, hypertension, asthma, rheumatoid arthritis, and seizures 1, 2. Moreover, in current clinical settings and basic research using animals, overnight fasting is a routine procedure before surgical operations although its influences not directly related to organs of interest or investigated parameters are often ignored 3.
Maintaining adequate blood levels of glucose is prerequisite for energy metabolism in glucose‐requiring organs/cells including the brain, kidney, testis, and red blood cells. Upon food deprivation, declining blood glucose levels induce rapid secretion of glucagon and decreased release of insulin, thereby activating hepatic glycogenolysis although hepatic glycogen becomes quickly (~ 24 h) depleted. If fasting continues, peripheral organs switch as the primary energy source from glucose to fatty acids that are released from triacylglycerol droplets in adipose tissues. However, some organs/cells are unable to utilize fatty acids as an energy source, and thus, the liver produces ketone bodies from fatty acids so that such organs/cells can use them as a secondary energy source and save glucose. Meanwhile, gluconeogenesis from glucogenic amino acids of protein origin and ketogenesis from ketogenic amino acids takes place to maintain blood glucose and energy sources, respectively. Several lines of evidence suggest that all such biochemical adaptation to fasting is ‘transcriptionally regulated’ in the liver. The transcriptional factor/nuclear receptor proliferator peroxisome proliferator‐activated receptor alpha (PPARα) has been shown to primarily mediate adaptive responses to fasting in the liver 4, 5, 6, 7. In addition, tumor protein/suppressor p53 (TP53) has been shown recently to increase via posttranscriptional regulation in the liver upon fasting, thereby mediating amino acid catabolism and gluconeogenesis 8. However, such transcriptional regulation upon fasting has not been described in nonhepatic organs. Moreover, proteomic studies on the nonhepatic organs during fasting have been unexpectedly limited 9, 10 although the impacts of fasting are often apparent in the nonhepatic organs as we reported fasting‐induced cardioprotection in mice 11.
In this study, we investigated the possible sources of organ‐specific transcriptional regulation upon fasting using two‐dimensional difference gel electrophoresis (2D DIGE) proteomic approach. Although LC‐MS/MS became the mainstream for such proteomic analysis in recent decades, conventional 2D DIGE continues to be an important technology that enables rapid and direct visualization of thousands of proteins and their quantitative analyses 12, 13, 14, 15, 16, 17, 18. Here, we report novel transcriptional regulation in nonhepatic organs including kidney, thymus, and spleen upon fasting for 2 days.
Materials and methods
Animals
C57BL/6J mice were purchased from Japan SLC (Shizuoka, Japan). Eight‐week‐old male mice were group‐housed (4 mice per 470‐cm2 cage) in an air‐conditioned room (24 °C) kept on a 12‐h dark/light (8 pm–8 am) cycle, and allowed free access to water and a CE‐2 standard dry rodent diet (Clea Japan, Tokyo, Japan). In fasting experiments, mice were deprived of the diet for 1 or 2 days between 2 pm and 2 pm (hereinafter referred to as F1 and F2 mice, respectively). Ad libitum‐fed (AL) mice were analyzed as controls. After anesthetization by isoflurane inhalation, blood was collected through the heart and the liver, kidney, thymus, spleen, brain, and testis were quickly dissected out, snap‐frozen by liquid nitrogen, and stored at −80 °C. All animal procedures conformed to the Guide for the Care and Use of Laboratory Animals, 8th Edition published by the US National Research Council, and were approved by the Animal Care Committees of Keio University (No. 09187‐[4–6]) or Showa Pharmaceutical University (No. P‐2016‐10).
Serum biochemistry
Serum levels of glucose and ketone bodies were measured using a Drichem 7000i biochemistry analyzer (Fujifilm, Tokyo, Japan) and an AutoWako Total Ketone Bodies clinical assay kit (Wako, Osaka, Japan), respectively. Serum levels of adiponectin, insulin, C‐peptide 2, leptin, resistin, and gastric inhibitory polypeptide (GIP; also known as glucose‐dependent insulinotropic polypeptide 19) were measured using Multiplex Biomarker Immunoassays for Luminex xMAP technology (Millipore, Billerica, MA, USA); Catalog Nos. MADPNMAG‐70K‐01 for adiponectin; and MMHMAG‐44k for other hormones. Quantitative analyses were performed using Luminex xPONENT and MILLIPLEX Analyst 4.2 software.
2D DIGE
Each organ aliquot (50–100 mg) was homogenized (4100 r.p.m., 30 s × 3, 4 °C) in ice‐cold urea buffer (7 m urea, 2 m thiourea, 4% CHAPS, 65 mm dithiothreitol [DTT], 1 mm phenylmethylsulfonyl fluoride, and 1 mm sodium orthovanadate) using a Micro Smash MS‐100R Beads Cell Disrupter (Tomy, Tokyo, Japan) and 5‐mm‐diameter zirconia beads (Tomy). Homogenates were centrifuged at 16 000 g for 5 min at 4 °C, and then, the supernatants were centrifuged at 20 000 g for 25 min at 4 °C. Protein concentrations of the resultant supernatants were determined using a Bio‐Rad Protein Assay and bovine serum albumin as a standard. All reagents used in this study were of analytical grades from Wako (Tokyo, Japan) or Sigma‐Aldrich unless otherwise noted. 2D DIGE was performed as described previously 12, 13, 14. Twenty‐five μg of protein (adjusted to pH 8.5 by adding 40 mm Tris/HCl [pH 8.5]) was labeled with 200 pmol of CyDye (Cy2, Cy3, or Cy5 minimal dye fluor [GE Healthcare]) for 30 min at 4 °C in the dark. A pool, to be used for calibration between the gels, was generated from equal protein amounts of all eight samples (n = 4 each for AL and F2 mice). The reaction was stopped by adding 0.5 μL of 10 mm lysine. Labeled samples were mixed, and DTT and immobilized pH gradient (IPG) buffer (final 1% each) were added for 10 min at 4 °C in the dark. The samples were subjected to isoelectric focusing (IEF) in an Immobiline DryStrip (18 cm, pH 3–10 NL [nonlinear], GE Healthcare) that was rehydrated for 20 h in rehydration buffer (7 m urea, 2 m thiourea, 2% Triton X‐100, 13 mm DTT, 2.5 mm acetic acid, 1% IPG buffer, and 5 p.p.m. bromophenol blue) at 20 °C, using a CoolPhoreStar IPG‐IEF Type‐PX system (Anatech, Tokyo, Japan). Once IEF was completed, the strips were equilibrated for 30 min in equilibration buffer (50 mm Tris/HCl [pH 6.8], 6 m urea, 2% SDS, 30% [v/v] glycerol, 65 mm DTT, and 5 p.p.m. bromophenol blue), followed by in alkylating buffer (equilibration buffer with 4.5% iodoacetamide instead of DTT) for an additional 15 min. The strips were sealed on the top of 12.5% PAGE gels (140 × 140 × 1 mm; Perfect NT Gel S from DRC, Tokyo, Japan) using 0.5% low‐melting‐point agarose in Tris/glycine electrophoresis buffer. The second dimension of protein separation was performed at a constant 200 V using an ERICA‐S high‐speed electrophoresis system (DRC). A total of four gels (for the comparisons between AL (n = 4) and F2 (n = 4)) were scanned at once for Cy2/Cy3/Cy5 fluorescence using a Typhoon Trio image scanner (GE Healthcare), and obtained images were integratively analyzed using DeCyder 2D ver. 6.5 differential analysis software (GE Healthcare).
Silver staining
For protein identification using MALDI‐TOFMS, each tissue homogenate sample (100–150 μg) was subjected to 2D PAGE (mentioned above) without CyDye labeling. To get better resolutions, some samples were separated on larger 2D systems using longer strips (24 cm, pH 3–10 NL [nonlinear]) and larger PAGE gels (257 × 200 × 1 mm; Perfect NT Gel W from DRC). After electrophoresis, the gel was stained using a Silver Stain MS Kit (Wako).
MALDI‐TOFMS analysis of trypsin digests
Gel pieces were excised from silver‐stained gels, destained with a mixture of destaining solutions A and B (Wako), washed twice with deionized water and four times with 50 mm ammonium bicarbonate (NH4HCO3):acetonitrile (1 : 1), dehydrated once with acetonitrile, twice alternately rehydrated with 100 mm NH4HCO3 and dehydrated with acetonitrile, and dried by vacuum centrifugation. Protein samples in the gels were digested in 10 μL of trypsin solution (0.1 μg of Trypsin Gold, Mass Spectrometry Grade [Promega] and 0.01% ProteaseMAX Surfactant, Trypsin Enhancer [Promega] in 25 mm NH4HCO3) by incubating at 50 °C for 1 h. Trypsin digests were mixed with 3 μL of 2% trifluoroacetic acid, and 1 μL of samples was spotted onto a μFocus MALDI plate (900 μm, 384 circles, Hudson Surface Technology [Old Tappan, NJ, USA]) with an equal volume of matrix solution, containing 10 mm α‐cyano‐4‐hydroxycinnamic acid in 1% trifluoroacetic acid/50% acetonitrile. Positive ion mass spectra were obtained using an AXIMA‐CFR plus (Shimadzu, Kyoto, Japan) in a reflectron mode. MS spectra were acquired over a mass range of 700–4000 m/z and calibrated using Peptide calibration standards (~ 1000–3200 Da; Bruker Daltonics, Yokohama, Japan).
Database search for protein identification/clarification and upstream regulator analysis
Proteins were identified by matching the peptide mass fingerprint with the Swiss‐Prot protein database using the MASCOT search engine (Matrix Science, http://www.matrixscience.com). Database searches were carried out using the following parameters: taxonomy, Mus musculus; enzyme, trypsin; and allowing 1 missed cleavage. Carbamidomethylation was selected as a fixed modification, and the oxidation of methionine was allowed as a variable. The peptide mass tolerance was set at 0.5 Da, and the significance threshold was set at P < 0.05 probability based values on Mowse Scores (≥ 55). Protein classification by its biological process involved and its molecular function was carried out using the PANTHER (Protein ANalysis THrough Evolutionary Relationships) clarification system (http://www.pantherdb.org/), which is supported by a research grant from the National Institute of General Medical Sciences [Grant GM081084] and maintained by the group led by Paul D. Thomas at the University of Southern California. Upstream regulator analysis was performed using Ingenuity Pathway Analysis (IPA) software (Qiagen).
Statistical analysis
Data are expressed as mean ± SD (n: sample numbers). Statistical analysis was performed using one‐way ANOVA with Tukey's multiple comparison test with Prism ver. 5.0c software (GraphPad, La Jolla, CA, USA); P < 0.05 denoted a significant difference.
Results
Protein expression changes in the liver
We first estimated the duration required to obtain organ proteomic responses by fasting using serum biochemistry. One‐day (water‐only) fasting was sufficient to maintain minimal levels of glucose, insulin, C‐peptide 2, leptin, and resistin; the levels generally matched those in F2 mice, but, in contrast, the accumulation of ketone bodies and GIP was much more apparent in F2 mice (Fig. 1). Our exploratory 2D DIGE analyses did not find apparent alterations in hepatic protein expression in F1 mice (data not shown), and additional (e.g., 3‐day) fasting (that may cause acute > 25% body weight loss) was not allowed for ethical reasons in our university. Therefore, we investigated global protein expression in various mouse organs after 2‐day fasting.
Figure 1.
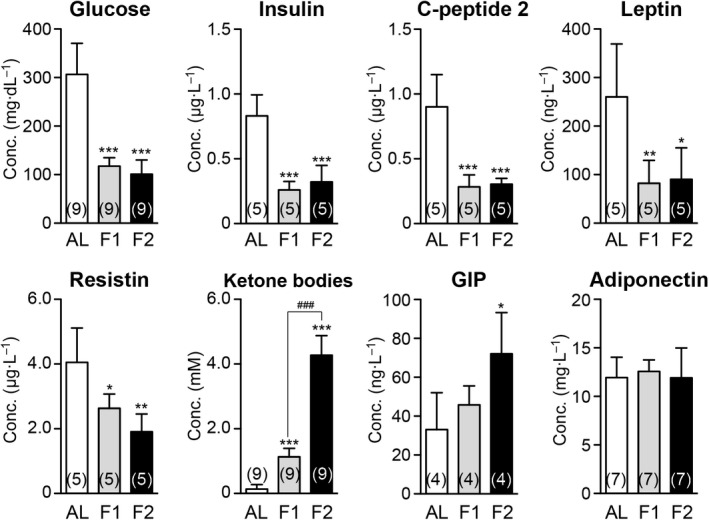
Impact of 1‐ or 2‐day fasting on serum biochemical parameters. Serum levels of glucose, insulin, C‐peptide 2, leptin, resistin, ketone bodies, gastric inhibitory polypeptide (GIP), and adiponectin were measured. AL, ad libitum‐fed (AL); F1, 1‐day fasted; F2, 2‐day fasted. Data are mean ± SD (n: sample numbers); significant changes in *P < 0.05, **P < 0.01, and ***P < 0.001 vs AL; ### P < 0.001 vs F1 by one‐way ANOVA with Tukey's multiple comparison test.
We reported previously that 2‐day fasting of adult C57BL/6J male mice causes 23.4% body and 32.2% liver weight losses 20. Despite such drastic alterations, the marked activation of protein degradation systems such as ubiquitin‐proteasome and autophagy‐lysosome systems was not detectable by RT‐PCR analysis of the liver, which highly contrasted with thymus, another highly atrophied (54.7% weight loss) organ 20. However, our 2D DIGE proteomic analyses revealed substantial numbers of proteins were up‐ or downregulated in the liver of F2 mice; for example, among a total of 1824 protein spots identified in the representative 2D gel (Fig. 2A), 214 (11.7%, red circles) and 178 (9.8%, green circles) spots were > 1.1‐fold up‐ and downregulated, respectively (Fig. 2B). By comparative analysis between the four independent gels using DeCyder software, we identified 34 significantly upregulated proteins (P < 0.05, Table 1 and Table S1 [Sheet A] for weblinks); these include key enzymes in gluconeogenesis (phosphoenolpyruvate carboxykinase, cytosolic [Pck1 (spot 1), the rate‐limiting enzyme of gluconeogenesis] and pyruvate carboxylase, mitochondrial [Pc (spot 18)]), peroxisomal fatty acid β‐oxidation (peroxisomal acyl‐CoA oxidase 1 [Acox1 (spot 10)]), ketogenesis (hydroxymethylglutaryl‐CoA synthase, mitochondrial [Hmgcs2 (spot 12, 12′), the rate‐limiting enzyme of ketogenesis] 21, 22), phenylalanine metabolism (phenylalanine‐4‐hydroxylase [Pah (spot 9)] and homogentisate 1,2‐dioxygenase [Hgd (spot 7)]), and S‐adenosylmethionine (the major methyl donor for hundreds of methyltransferases) synthesis (S‐adenosylmethionine synthase isoform type‐1 [Mat1a (spots 2, 2′, 2′′, 2′′′)]). We also identified 38 significantly downregulated proteins involved in fatty acid synthesis (fatty acid synthase [Fasn (spot 37)]), glycogenolysis (glycogen phosphorylase, liver form [Pygl (spot 40)], and glutathione conjugation (glutathione S‐transferases, π1 [Gstp1 (spot 54)]), and μ1 [Gstm1 (spot 70)] (Table 1 and Table S1 [Sheet A]).
Figure 2.
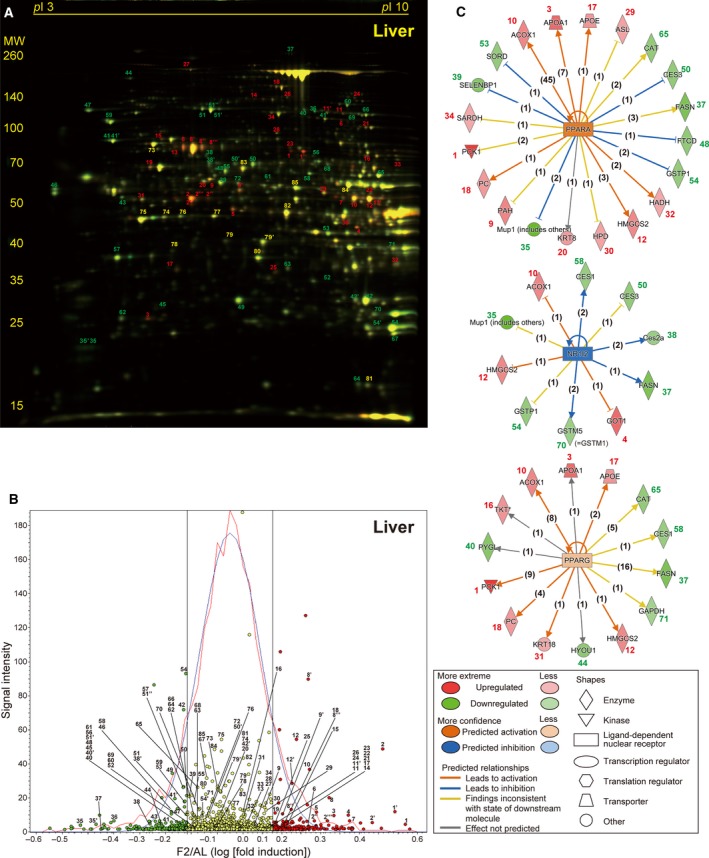
Fasting‐induced protein remodeling in the liver. Fluorescent 2D DIGE was performed on liver homogenates from ad libitum‐fed (AL) and 2‐day fasted (F2) mice. (A) Representative fluorescent gel image in which proteins upregulated by fasting are labeled in red and those downregulated are in green. Approximate isoelectric points (pI ) and molecular weights (MW; kDa) are indicated. (B) Quantitative profiling of the above image using DeCyder software. Upregulated and downregulated (> 1.1‐fold) protein spots are labeled in red and green, respectively, with others in yellow. The x‐axis represents log [(Fasted/AL) fold induction], and the y‐axis represents spot signal intensity; the red line represents spot number distribution, while the blue line its Gaussian approximation; and two black straight lines represent 1.1 and –1.1 fold change. (C) The three highest scoring upstream regulators (PPARα, NR1I2, and PPARγ) listed by Ingenuity Pathway Analysis (IPA) of the samples from AL and F2 mice (n = 4 each). Upregulated proteins with IDs identical to those in A and B are shown in red and downregulated proteins are in green, and predicted relationships are indicated by various types of lines described in the panel. The numbers in parentheses are the numbers of current publications reporting those relationships.
Table 1.
Protein expression changes upon 48‐h fasting in mouse liver
| Liver Spot ID | Fold change | P‐value | Protein name | Uniprot ID | Gene name | Unigene ID | Mascot score | Sequence coverage | Peptide matches | MW | pI |
|---|---|---|---|---|---|---|---|---|---|---|---|
| Upregulated proteins | |||||||||||
| 1 | 2.89 | 0.003 | Phosphoenolpyruvate carboxykinase, cytosolic (GTP) | Q9Z2V4 | Pck1 | Mm.266867 | 132 | 50% | 30/90 | 70 051 | 6.18 |
| 1′ | 2.83 | 0.003 | Phosphoenolpyruvate carboxykinase, cytosolic (GTP) | Q9Z2V4 | Pck1 | Mm.266867 | 181 | 50% | 27/55 | 70 051 | 6.18 |
| 2 | 2.66 | 0.003 | S‐adenosylmethionine synthase isoform type‐1 | Q91X83 | Mat1a | Mm.14064 | 76 | 24% | 9/32 | 44 051 | 5.51 |
| 2′ | 2.51 | 0.003 | S‐adenosylmethionine synthase isoform type‐1 | Q91X83 | Mat1a | Mm.14064 | 64 | 35% | 13/83 | 44 051 | 5.51 |
| 3 | 2.03 | 0.003 | Apolipoprotein A‐I | Q00623 | Apoa1 | Mm.26743 | 172 | 48% | 16/23 | 30 597 | 5.51 |
| 4 | 2.01 | 0.011 | Aspartate aminotransferase, cytoplasmic | P05201 | Got1 | Mm.19039 | 211 | 60% | 24/46 | 46 504 | 6.68 |
| 5 | 1.97 | 0.010 | Ornithine aminotransferase, mitochondrial | P29758 | Oat | Mm.13694 | 147 | 53% | 24/95 | 48 723 | 6.19 |
| 2′′ | 1.94 | 0.009 | S‐adenosylmethionine synthase isoform type‐1 | Q91X83 | Mat1a | Mm.14064 | 106 | 28% | 10/17 | 44 051 | 5.51 |
| 6 | 1.93 | 0.003 | Dimethylglycine dehydrogenase, mitochondrial | Q9DBT9 | Dmgdh | Mm.21789 | 109 | 27% | 15/32 | 97 422 | 7.69 |
| 7 | 1.92 | 0.005 | Homogentisate 1,2‐dioxygenase | Q05BJ1 | Hgd | Mm.157442 | 61 | 17% | 8/31 | 50 726 | 6.86 |
| 8 | 1.89 | 0.011 | Serum albumin | P07724 | Alb | Mm.16773 | 168 | 29% | 15/17 | 70 700 | 5.75 |
| 8′ | 1.87 | 0.025 | Serum albumin | P07724 | Alb | Mm.16773 | 157 | 52% | 33/113 | 70 700 | 5.75 |
| 2′′′ | 1.85 | 0.004 | S‐adenosylmethionine synthase isoform type‐1 | Q91X83 | Mat1a | Mm.14064 | 65 | 22% | 7/15 | 44 051 | 5.51 |
| 8′′ | 1.80 | 0.023 | Serum albumin | P07724 | Alb | Mm.16773 | 61 | 18% | 9/25 | 70 700 | 5.75 |
| 9 | 1.63 | 0.010 | Phenylalanine‐4‐hydroxylase | P16331 | Pah | Mm.342177 | 78 | 28% | 12/36 | 52 381 | 5.91 |
| 10 | 1.62 | 0.003 | Peroxisomal acyl‐coenzyme A oxidase 1 | Q9R0H0 | Acox1 | Mm.356689 | 73 | 27% | 13/39 | 75 000 | 8.64 |
| 11 | 1.59 | 0.022 | Elongation factor 2 | P58252 | Eef2 | Mm.326799 | 153 | 47% | 33/74 | 96 222 | 6.41 |
| 12 | 1.58 | 0.003 | Hydroxymethylglutaryl‐CoA synthase, mitochondrial | P54869 | Hmgcs2 | Mm.289131 | 103 | 25% | 13/29 | 57 300 | 8.65 |
| 13 | 1.55 | 0.013 | Annexin A6 | P14824 | Anxa6 | Mm.265347 | 85 | 26% | 15/32 | 76 294 | 5.34 |
| 14 | 1.54 | 0.004 | Alpha‐aminoadipic semialdehyde synthase, mitochondrial | Q99K67 | Aass | Mm.18651 | 71 | 36% | 23/86 | 103 650 | 6.42 |
| 15 | 1.51 | 0.003 | Stress‐70 protein, mitochondrial | P38647 | Hspa9 | Mm.209419 | 104 | 35% | 17/43 | 73 701 | 5.81 |
| 8′′′ | 1.50 | 0.034 | Serum albumin | P07724 | Alb | Mm.16773 | 171 | 54% | 24/78 | 70 700 | 5.75 |
| 12′ | 1.44 | 0.004 | Hydroxymethylglutaryl‐CoA synthase, mitochondrial | P54869 | Hmgcs2 | Mm.289131 | 101 | 39% | 16/46 | 57 300 | 8.65 |
| 16 | 1.44 | 0.004 | Transketolase | Q62371 | Tkt | Mm.290692 | 72 | 20% | 9/28 | 68 272 | 7.23 |
| 17 | 1.40 | 0.008 | Apolipoprotein E | P08226 | Apoe | Mm.305152 | 98 | 38% | 15/32 | 35 901 | 5.56 |
| 9′ | 1.35 | 0.003 | Phenylalanine‐4‐hydroxylase | P16331 | Pah | Mm.342177 | 88 | 28% | 11/35 | 52 381 | 5.91 |
| 18 | 1.35 | 0.004 | Pyruvate carboxylase, mitochondrial | P06802 | Pc | Mm.342177 | 120 | 16% | 15/20 | 130 344 | 6.25 |
| 19 | 1.35 | 0.008 | 60 kDa heat shock protein, mitochondrial | P63038 | Hspd1 | Mm.1777 | 72 | 33% | 15/48 | 61 088 | 5.91 |
| 20 | 1.35 | 0.016 | Keratin, type II cytoskeletal | P11679 | Krt8 | Mm.358618 | 146 | 35% | 18/26 | 54 531 | 5.70 |
| 21 | 1.31 | 0.016 | Aconitate hydratase, mitochondrial | Q99KI0 | Aco2 | Mm.154581 | 93 | 13% | 9/15 | 86 151 | 8.08 |
| 22 | 1.28 | 0.022 | 4‐aminobutyrate aminotransferase, mitochondrial | P61922 | Abat | Mm.259315 | 58 | 25% | 11/40 | 57 100 | 8.35 |
| 23 | 1.27 | 0.004 | Succinate dehydrogenase (ubiquinone) flavoprotein subunit, mitochondrial | Q8K2B3 | Sdha | Mm.158231 | 216 | 61% | 28/59 | 73 623 | 7.06 |
| 24 | 1.27 | 0.013 | Dihydropyrimidine dehydrogenase [NADP(+)] | Q80XT4 | Dpyd | Mm.27907 | 90 | 20% | 16/33 | 113 177 | 7.13 |
| 25 | 1.27 | 0.018 | 3‐mercaptopyruvate sulfurtransferase | Q99J99 | Mpst | Mm.294215 | 64 | 32% | 9/27 | 33 231 | 6.11 |
| 26 | 1.25 | 0.003 | 2‐oxoglutarate dehydrogenase, mitochondrial | Q60597 | Ogdh | Mm.276348 | 80 | 17% | 18/44 | 117 572 | 6.36 |
| 27 | 1.25 | 0.003 | Clathrin heavy chain 1 | Q68FD5 | Cltc | Mm.254588 | 58 | 6% | 12/18 | 193 202 | 5.48 |
| 28 | 1.24 | 0.013 | Keratin, type I cytoskeletal 12 | Q64291 | Krt12 | Mm.436651 | 63 | 21% | 7/106 | 52 774 | 4.76 |
| 29 | 1.23 | 0.016 | Argininosuccinate lyase | Q91YI0 | Asl | Mm.23869 | 192 | 56% | 29/71 | 51 878 | 6.48 |
| 30 | 1.23 | 0.039 | 4‐hydroxyphenylpyruvate dioxygenase | P49429 | Hpd | Mm.439709 | 239 | 72% | 32/95 | 45 254 | 6.58 |
| 11′ | 1.21 | 0.022 | Elongation factor 2 | P58252 | Eef2 | Mm.326799 | 152 | 43% | 28/55 | 96 222 | 6.41 |
| 31 | 1.19 | 0.036 | Keratin, type I cytoskeletal | P05784 | Krt18 | Mm.22479 | 133 | 35% | 16/24 | 47 509 | 5.22 |
| 32 | 1.16 | 0.003 | Hydroxyacyl‐coenzyme A dehydrogenase, mitochondrial | O08756 | Hadh | Mm.260164 | 61 | 24% | 7/29 | 34 613 | 8.76 |
| 33 | 1.16 | 0.005 | Apoptosis‐inducing factor 1, mitochondrial | Q9Z0X1 | Aifm1 | Mm.240434 | 63 | 16% | 8/19 | 66 952 | 9.23 |
| 34 | 1.14 | 0.020 | Sarcosine dehydrogenase, mitochondrial | Q99LB7 | Sardh | Mm.278467 | 58 | 20% | 18/57 | 102 644 | 6.28 |
| Downregulated proteins | |||||||||||
| 35 | −2.58 | 0.044 | Major urinary protein 2 | P11589 | Mup2 | Mm.457980 | 152 | 77% | 17/36 | 20 935 | 5.04 |
| 36 | −2.38 | 0.003 | DENN domain‐containing protein 2A | B7ZP28 | Dennd2a | Mm.440021 | 57 | 8% | 9/19 | 113 936 | 9.07 |
| 35′ | −2.01 | 0.027 | Major urinary protein 2 | P11589 | Mup2 | Mm.457980 | 79 | 43% | 8/23 | 20 935 | 5.04 |
| 37 | −1.88 | 0.008 | Fatty acid synthase | P19096 | Fasn | Mm.236443 | 227 | 36% | 85/131 | 274 994 | 6.13 |
| 38 | −1.66 | 0.030 | Pyrethroid hydrolase Ces2a | Q8QZR3 | Ces2a | Mm.212983 | 188 | 58% | 27/59 | 62 356 | 5.74 |
| 39 | −1.64 | 0.014 | Selenium‐binding protein 2 | Q63836 | Selenbp2 | Mm.225405 | 68 | 18% | 10/31 | 53 147 | 5.78 |
| 40 | −1.63 | 0.003 | Glycogen phosphorylase, liver form | Q9ET01 | Pygl | Mm.256926 | 66 | 14% | 11/21 | 97 857 | 6.63 |
| 41 | −1.60 | 0.040 | 78 kDa glucose‐regulated protein | P20029 | Hspa5 | Mm.330160 | 202 | 41% | 24/36 | 72 492 | 5.07 |
| 42 | −1.60 | 0.010 | Carbonic anhydrase 3 | P16015 | Car3 | Mm.300 | 86 | 41% | 8/19 | 29 633 | 6.89 |
| 43 | −1.60 | 0.007 | 26S protease regulatory subunit 6B | P54775 | Psmc4 | Mm.29582 | 130 | 68% | 21/95 | 47 493 | 5.09 |
| 44 | −1.53 | 0.005 | Hypoxia upregulated protein 1 | Q9JKR6 | Hyou1 | Mm.116721 | 145 | 17% | 19/22 | 111 340 | 5.12 |
| 45 | −1.50 | 0.017 | NADH dehydrogenase (ubiquinone) flavoprotein 2, mitochondrial | Q9D6J6 | Ndufv2 | Mm.2206 | 58 | 36% | 6/23 | 27 610 | 7.00 |
| 46 | −1.47 | 0.016 | Calreticulin | P14211 | Calr | Mm.1971 | 87 | 22% | 9/17 | 48 136 | 4.33 |
| 41′ | −1.46 | 0.019 | 78 kDa glucose‐regulated protein | P20029 | Hspa5 | Mm.330160 | 64 | 16% | 10/23 | 72 492 | 5.07 |
| 47 | −1.46 | 0.003 | Endoplasmin | P08113 | Hsp90b1 | Mm.87773 | 57 | 13% | 12/21 | 92 703 | 4.74 |
| 48 | −1.44 | 0.017 | Formimidoyltransferase‐cyclodeaminase | Q91XD4 | Ftcd | Mm.36278 | 78 | 41% | 17/73 | 59 529 | 5.79 |
| 49 | −1.44 | 0.006 | Indolethylamine N‐methyltransferase | P40936 | Inmt | Mm.299 | 108 | 48% | 13/46 | 30 068 | 6.00 |
| 46′ | −1.43 | 0.024 | Calreticulin | P14211 | Calr | Mm.1971 | 80 | 29% | 12/36 | 48 136 | 4.33 |
| 50 | −1.43 | 0.022 | Carboxylesterase 3A | Q63880 | Ces3a | Mm.295534 | 94 | 23% | 14/39 | 63 677 | 5.78 |
| 40′ | −1.42 | 0.017 | Glycogen phosphorylase, liver form | Q9ET01 | Pygl | Mm.256926 | 169 | 35% | 24/36 | 97 857 | 6.63 |
| 51 | −1.42 | 0.016 | Cytosolic 10‐formyltetrahydrofolate dehydrogenase | Q8R0Y6 | Aldh1 l1 | Mm.30035 | 62 | 9% | 7/9 | 99 502 | 5.64 |
| 51′ | −1.41 | 0.003 | Cytosolic 10‐formyltetrahydrofolate dehydrogenase | Q8R0Y6 | Aldh1 l1 | Mm.30035 | 338 | 76% | 54/97 | 99 502 | 5.64 |
| 52 | −1.39 | 0.016 | Putative l‐aspartate dehydrogenase | Q9DCQ2 | Aspdh | Mm.88478 | 66 | 39% | 9/38 | 30 479 | 6.45 |
| 53 | −1.39 | 0.009 | Sorbitol dehydrogenase | Q64442 | Sord | Mm.371580 | 108 | 35% | 9/22 | 38 795 | 6.56 |
| 54 | −1.38 | 0.016 | Glutathione S‐transferase π1 | P19157 | Gstp1 | Mm.299292 | 73 | 44% | 10/42 | 23 765 | 7.68 |
| 51′′ | −1.37 | 0.004 | Cytosolic 10‐formyltetrahydrofolate dehydrogenase | Q8R0Y6 | Aldh1 l1 | Mm.30035 | 235 | 38% | 28/37 | 99 502 | 5.64 |
| 55 | −1.36 | 0.006 | Protein disulfide‐isomerase A3 | P27773 | Pdia3 | Mm.263177 | 141 | 41% | 19/43 | 57 099 | 5.88 |
| 54′ | −1.33 | 0.009 | Glutathione S‐transferase π1 | P19157 | Gstp1 | Mm.299292 | 87 | 53% | 11/47 | 23 765 | 7.68 |
| 56 | −1.32 | 0.005 | DDRGK domain‐containing protein 1 | Q80WW9 | Ddrgk1 | Mm.440063 | 55 | 21% | 5/15 | 35 956 | 5.32 |
| 57 | −1.32 | 0.037 | Regucalcin | Q64374 | Rgn | Mm.2118 | 192 | 71% | 20/55 | 33 899 | 5.15 |
| 58 | −1.32 | 0.014 | Carboxylesterase 1D | Q8VCT4 | Ces1d | Mm.292803 | 110 | 36% | 17/67 | 62 034 | 6.17 |
| 59 | −1.31 | 0.009 | Heat shock protein HSP 90‐beta | P11499 | Hsp90ab1 | Mm.2180 | 89 | 19% | 13/27 | 83 571 | 4.97 |
| 38′ | −1.30 | 0.023 | Pyrethroid hydrolase Ces2a | Q8QZR3 | Ces2a | Mm.212983 | 63 | 13% | 6/8 | 62 356 | 5.74 |
| 60 | −1.29 | 0.034 | C‐1‐tetrahydrofolate synthase, cytoplasmic | Q922D8 | Mthfd1 | Mm.29584 | 168 | 43% | 32/71 | 101 820 | 6.70 |
| 61 | −1.29 | 0.005 | T‐complex protein 1 subunit beta | P80314 | Cct2 | Mm.247788 | 58 | 20% | 9/26 | 57 783 | 5.97 |
| 62 | −1.28 | 0.010 | Lactoylglutathione lyase | Q9CPU0 | Glo1 | Mm.261984 | 99 | 66% | 13/87 | 20 967 | 5.24 |
| 63 | −1.26 | 0.005 | 3‐hydroxyanthranilate 3,4‐dioxygenase | Q78JT3 | Haao | Mm.30100 | 105 | 33% | 10/18 | 32 955 | 6.09 |
| 50′ | −1.24 | 0.026 | Carboxylesterase 3A | Q63880 | Ces3a | Mm.295534 | 61 | 16% | 8/21 | 63 677 | 5.78 |
| 42′ | −1.24 | 0.019 | Carbonic anhydrase 3 | P16015 | Car3 | Mm.300 | 85 | 63% | 15/83 | 29 633 | 6.89 |
| 64 | −1.23 | 0.003 | Nucleoside diphosphate kinase B | Q01768 | Nme2 | Mm.1260 | 62 | 59% | 7/32 | 17 466 | 6.97 |
| 65 | −1.22 | 0.023 | Catalase | P70423 | Cat | Mm.4215 | 115 | 22% | 12/21 | 60 043 | 7.72 |
| 66 | −1.21 | 0.039 | Cytoplasmic aconitate hydratase | P28271 | Aco1 | Mm.331547 | 223 | 52% | 37/77 | 98 691 | 7.23 |
| 67 | −1.20 | 0.009 | Peroxiredoxin‐1 | P35700 | Prdx1 | Mm.30929 | 90 | 47% | 9/27 | 22 390 | 8.26 |
| 68 | −1.18 | 0.038 | Acyl‐CoA synthetase family member 2, mitochondrial | Q8VCW8 | Acsf2 | Mm.386885 | 134 | 49% | 25/96 | 68 591 | 8.44 |
| 69 | −1.18 | 0.011 | Methylmalonyl‐CoA mutase, mitochondrial | P16332 | Mut | Mm.259884 | 79 | 36% | 19/64 | 83 248 | 6.45 |
| 70 | −1.18 | 0.009 | Glutathione S‐transferase μ1 | P10649 | Gstm1 | Mm.37199 | 169 | 77% | 21/49 | 26 067 | 7.71 |
| 71 | −1.14 | 0.027 | Glyceraldehyde‐3‐phosphate dehydrogenase | P16858 | Gapdh | Mm.304088 | 75 | 50% | 16/68 | 36 072 | 8.44 |
| 72 | −1.11 | 0.034 | Selenium‐binding protein 1 | P17563 | Selenbp1 | Mm.196558 | 104 | 25% | 12/21 | 53 051 | 5.87 |
Proteomic data analysis using IPA software revealed PPARα (= PPARA) as the highest scoring upstream regulator, followed by nuclear receptor subfamily 1 group I member 2 (NR1I2; also known as PXR [pregnane X receptor]) and peroxisome proliferator‐activated receptor gamma (PPARG = PPARγ) (Table S2 [Sheet A]). Among multiple PPARα‐regulated proteins 23, 24, a total of 20 up‐ or downregulated proteins were identified (Fig. 2C). Moreover, among NR1I2‐ and PPARγ‐regulated proteins, 10 and 14 up‐ or downregulated proteins were identified, respectively (Fig. 2C), some of which might contribute to their relatively high scores (Table S2 [Sheet A]). In addition, TP53 was listed as the fourth highest scoring regulator in the liver by regulating expression of 19 proteins (Table S2 [Sheet A]).
Protein expression changes in the kidney
Two‐day fasting induced 18.6% kidney weight loss with no or mild activation of protein degradation systems in our previous RT‐PCR analysis 20. Proteomic analysis revealed a total of 1633 spots in the representative 2D gel (Fig. 3A), of which 45 (2.76%, red circles) and 44 (2.69%, green circles) spots were > 1.1‐fold up‐ and downregulated, respectively (Fig. 3B). We identified only 12 significantly upregulated proteins in the kidney of F2 mice, which included Pck1 (spot 1), Acox1 (spot 3), and apolipoprotein A‐I (Apoa1, spot 4), just like in the liver (Table 2 and Table S1 [Sheet A and B]). We also identified 20 significantly downregulated proteins in the kidney; most of them (except calreticulin [Calr (spot 15)] and endoplasmin [Hsp90b1 (heat shock protein 90 kDa beta member 1, spot 16)]) were not apparently changed in the liver (Table 2 and Table S1 [Sheet A and B]). Nevertheless, the upstream regulator analysis revealed PPARα as the second highest scoring upstream regulator after ATF6 (activating transcriptional factor 6) and followed by KLF15 (Krüppel‐like factor 15) (Fig. 3C and Table S2 [Sheet B]).
Figure 3.
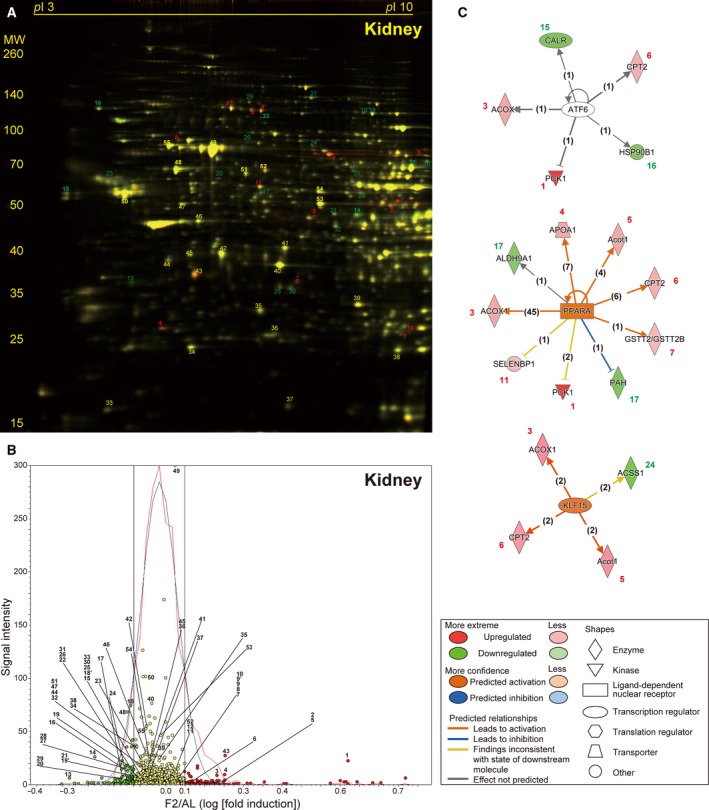
Fasting‐induced protein remodeling in the kidney. Fluorescent 2D DIGE was performed on kidney homogenates from ad libitum‐fed (AL) and 2‐day fasted (F2) mice. (A) Representative fluorescent gel image in which proteins upregulated by fasting are labeled in red and those downregulated are in green. (B) Quantitative profiling of the above image using DeCyder. (C) The three highest scoring upstream regulators (ATF6, PPARα, and KLF15) listed by IPA of the samples from AL and F2 mice (n = 4 each). Refer to Fig. 2 legend for detailed information.
Table 2.
Protein expression changes upon 48‐h fasting in mouse kidney
| Kidney spot ID | Fold change | P‐VALUE | Protein name | Uniprot ID | Gene name | Unigene ID | Mascot score | Sequence coverage | Peptide matches | MW | pI |
|---|---|---|---|---|---|---|---|---|---|---|---|
| Upregulated proteins | |||||||||||
| 1 | 3.67 | 0.004 | Phosphoenolpyruvate carboxykinase, cytosolic (GTP) | Q9Z2V4 | Pck1 | Mm.266867 | 183 | 53% | 31/77 | 70 051 | 6.18 |
| 2 | 1.59 | 0.004 | N‐acetylglucosaminyl‐phosphatidylinositol de‐N‐acetylase | Q5SX19 | Pigl | Mm.390358 | 61 | 39% | 7/28 | 28 450 | 8.59 |
| 3 | 1.50 | 0.014 | Peroxisomal acyl‐coenzyme A oxidase 1 | Q9R0H0 | Acox1 | Mm.356689 | 121 | 33% | 15/29 | 75 000 | 8.64 |
| 4 | 1.48 | 0.018 | Apolipoprotein A‐I | Q00623 | Apoa1 | Mm.26743 | 111 | 39% | 14/35 | 30 597 | 5.51 |
| 5 | 1.43 | 0.011 | Mixture: Acyl‐coenzyme A thioesterase 1 | O55137 | Acot1 | Mm.1978 | 79 | 39% | 11/38 | 46 335 | 6.12 |
| Mixture: Acyl‐coenzyme A thioesterase 2 | Q9QYR9 | Acot2 | Mm.371675 | 65 | 32% | 10/38 | 49 854 | 6.88 | |||
| 6 | 1.32 | 0.028 | Carnitine O‐palmitoyltransferase 2, mitochondrial | P52825 | Cpt2 | Mm.307620 | 59 | 27% | 12/44 | 74 504 | 8.59 |
| 7 | 1.19 | 0.018 | Glutathione S‐transferase τ2 | Q61133 | Gstt2 | Mm.24118 | 87 | 41% | 9/26 | 27 731 | 7.02 |
| 8 | 1.14 | 0.034 | Stress‐70 protein, mitochondrial | P38647 | Hspa9 | Mm.209419 | 106 | 46% | 24/73 | 73 701 | 5.81 |
| 9 | 1.14 | 0.004 | Villin‐1 | Q62468 | Vil1 | Mm.471601 | 155 | 27% | 20/28 | 93 230 | 5.72 |
| 9′ | 1.14 | 0.017 | Villin‐1 | Q62468 | Vil1 | Mm.471601 | 159 | 35% | 27/44 | 93 230 | 5.72 |
| 10 | 1.12 | 0.027 | Glutathione S‐transferase μ1 | P10649 | Gstm1 | Mm.37199 | 120 | 69% | 17/50 | 26 067 | 7.71 |
| 11 | 1.11 | 0.034 | Selenium‐binding protein 1 | P17563 | Selenbp1 | Mm.196558 | 208 | 51% | 20/29 | 53 051 | 5.87 |
| 12 | 1.11 | 0.044 | Cytosolic 10‐formyltetrahydrofolate dehydrogenase | Q8R0Y6 | Aldh1 l1 | Mm.30035 | 238 | 49% | 37/65 | 99 502 | 5.64 |
| Downregulated proteins | |||||||||||
| 13 | −1.84 | 0.004 | Inositol oxygenase | Q9QXN5 | Miox | Mm.158200 | 108 | 55% | 13/47 | 33 484 | 5.03 |
| 14 | −1.56 | 0.004 | Glycine amidinotransferase, mitochondrial | Q9D964 | Gatm | Mm.29975 | 150 | 32% | 16/30 | 48 779 | 8.00 |
| 15 | −1.32 | 0.035 | Calreticulin | P14211 | Calr | Mm.1971 | 100 | 27% | 13/30 | 48 136 | 4.33 |
| 16 | −1.31 | 0.004 | Endoplasmin | P08113 | Hsp90b1 | Mm.87773 | 74 | 14% | 14/21 | 92 703 | 4.74 |
| 17 | −1.29 | 0.023 | Phenylalanine‐4‐hydroxylase | P16331 | Pah | Mm.263539 | 69 | 31% | 13/50 | 52 381 | 5.91 |
| 18 | −1.28 | 0.027 | Acyl‐coenzyme A synthetase ACSM2, mitochondrial | Q8K0L3 | Acsm2 | Mm.268448 | 215 | 40% | 22/28 | 64 741 | 8.54 |
| 19 | −1.26 | 0.014 | Elongation factor 2 | P58252 | Eef2 | Mm.326799 | 65 | 12% | 9/13 | 96 222 | 6.41 |
| 20 | −1.22 | 0.027 | Sulfite oxidase, mitochondrial | Q8R086 | Suox | Mm.23352 | 62 | 14% | 7/15 | 61 231 | 6.07 |
| 21 | −1.20 | 0.009 | Elongation factor Tu, mitochondrial | Q8BFR5 | Tufm | Mm.197829 | 70 | 16% | 8/14 | 49 876 | 7.23 |
| 22 | −1.19 | 0.050 | Gelsolin | P13020 | Gsn | Mm.21109 | 72 | 26% | 12/38 | 86 287 | 5.83 |
| 18′ | −1.19 | 0.019 | Acyl‐coenzyme A synthetase ACSM2, mitochondria | Q8K0L3 | Acsm2 | Mm.268448 | 114 | 49% | 22/94 | 64 741 | 8.54 |
| 23 | −1.18 | 0.049 | Nucleolin | Q91VA3 | Ncl | Mm.154378 | 61 | 10% | 7/12 | 76 734 | 4.69 |
| 24 | −1.18 | 0.023 | Acetyl‐coenzyme A synthetase 2‐like, mitochondrial | Q99NB1 | Acss1 | Mm.7044 | 60 | 16% | 10/27 | 75 317 | 6.51 |
| 25 | −1.18 | 0.019 | Beta‐lactamase‐like protein 2 | Q99KR3 | Lactb2 | Mm.89572 | 81 | 34% | 7/13 | 33 019 | 5.89 |
| 19′ | −1.17 | 0.049 | Elongation factor 2 | P58252 | Eef2 | Mm.326799 | 60 | 17% | 14/37 | 96 222 | 6.41 |
| 26 | −1.17 | 0.043 | Heat shock protein 75 kDa, mitochondrial | Q9CQN1 | Trap1 | Mm.123366 | 147 | 44% | 25/49 | 80 501 | 6.25 |
| 27 | −1.17 | 0.009 | 2‐oxoglutarate dehydrogenase, mitochondrial | Q60597 | Ogdh | Mm.276348 | 155 | 24% | 23/40 | 117 572 | 6.36 |
| 28 | −1.16 | 0.049 | 4‐trimethylaminobutyraldehyde dehydrogenase | Q9JLJ2 | Aldh9a1 | Mm.330055 | 67 | 23% | 10/27 | 54 449 | 6.63 |
| 29 | −1.15 | 0.031 | Lon protease homolog, mitochondrial | Q56A16 | Lonp1 | Mm.329136 | 63 | 15% | 14/29 | 106 347 | 6.15 |
| 30 | −1.13 | 0.039 | 3‐hydroxyisobutyrate dehydrogenase, mitochondrial | Q99L13 | Hibadh | Mm.286458 | 78 | 21% | 7/12 | 35 816 | 8.37 |
| 31 | −1.13 | 0.018 | EH domain‐containing protein 1 | Q9WVK4 | Ehd1 | Mm.30169 | 60 | 21% | 10/26 | 60 622 | 6.35 |
| 32 | −1.12 | 0.034 | Isovaleryl‐CoA dehydrogenase, mitochondrial | Q9JHI5 | Ivd | Mm.6635 | 106 | 38% | 13/27 | 46 695 | 8.53 |
Protein expression changes in the thymus and spleen
Two‐day fasting induced marked weight loss in both the thymus and spleen (54.7% and 41.2%, respectively) although protein degradation systems were only found to be highly activated in the thymus but not in the spleen 20. In a representative 2D gel, among a total of 1874 spots detected in the thymus (Fig. 4A), 54 (2.88%, red circles) and 67 (3.57%, green circles) spots were found to be up‐ or downregulated, respectively (Fig. 4B). We identified 10 and 16 significantly up‐ and downregulated proteins in the thymus, respectively; the former includes several structural proteins such as keratin, collagen, annexin, actin, and moesin (Table 3 and Table S1 [Sheet C]). Upstream regulators included MYCN (v‐myc myelocytomatosis viral‐related oncogene, neuroblastoma derived [avian]), TP53, and huntingtin (HTT) in this order (Fig. 4C and Table S2 [Sheet C]). In a representative 2D gel, among a total of 1861 spots detected in the spleen (Fig. 5A), 42 (2.26%, red circles) and 34 (1.83%, green circles) spots were found to be up‐ or downregulated, respectively (Fig. 5B). We could identify only five and nine significantly up‐ and downregulated proteins in the spleen, respectively (Table 4 and Table S1 [Sheet D]), although the upstream regulators included TP53 with the highest score, followed by nuclear factor of NFKBIA (kappa light polypeptide gene enhancer in B‐cell inhibitor, alpha) and RARB (retinoic acid receptor, beta) (Fig. 5C and Table S2 [Sheet D]).
Figure 4.
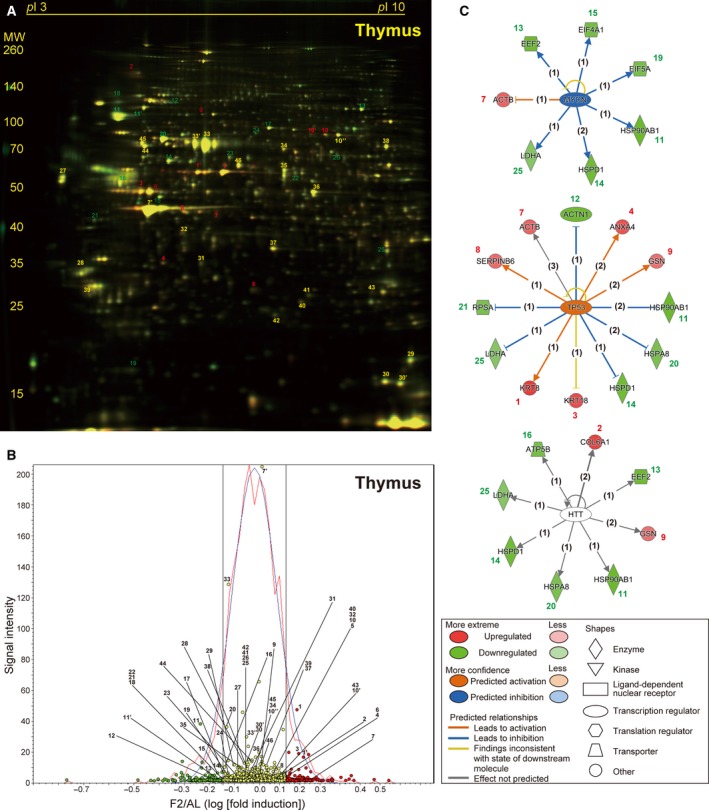
Fasting‐induced protein remodeling in the thymus. Fluorescent 2D DIGE was performed on thymus homogenates from ad libitum‐fed (AL) and 2‐day fasted (F2) mice. (A) Representative fluorescent gel image in which proteins upregulated by fasting are labeled in red and those downregulated are in green. (B) Quantitative profiling of the above image using DeCyder. (C) The three highest scoring upstream regulators (MYCN, TP53, and HTT) listed by IPA of the samples from AL and F2 mice (n = 4 each). Refer to Fig. 2 legend for detailed information.
Table 3.
Protein expression changes upon 48‐h fasting in mouse thymus
| Thymus spot ID | Fold change | P‐value | Protein name ID | Uniprot name | Gene ID | Unigene score | Mascot | Sequence coverage | Peptide matches | MW | pI |
|---|---|---|---|---|---|---|---|---|---|---|---|
| Upregulated proteins | |||||||||||
| 1 | 1.82 | 0.031 | Keratin, type II cytoskeletal 8 | P11679 | Krt8 | Mm.358618 | 146 | 52% | 30/66 | 54 531 | 5.70 |
| 2 | 1.71 | 0.031 | Collagen alpha‐1 (VI) chain | Q04857 | Col6a1 | Mm.2509 | 109 | 40% | 31/98 | 109 562 | 5.20 |
| 1′ | 1.70 | 0.042 | Keratin, type II cytoskeletal 8 | P11679 | Krt8 | Mm.358618 | 163 | 48% | 24/43 | 54 531 | 5.70 |
| 3 | 1.61 | 0.018 | Keratin, type I cytoskeletal 18 | P05784 | Krt18 | Mm.22479 | 120 | 40% | 17/41 | 47 509 | 5.22 |
| 4 | 1.54 | 0.024 | Annexin A4 | P97429 | Anxa4 | Mm.259702 | 85 | 61% | 18/76 | 36 178 | 5.43 |
| 5 | 1.51 | 0.049 | Proteasome subunit beta type‐10 | O35955 | Psmb10 | Mm.787 | 72 | 56% | 9/54 | 29 330 | 6.40 |
| 6 | 1.38 | 0.020 | Heterogeneous nuclear ribonucleoprotein F | Q9Z2X1 | Hnrnpf | Mm.422979 | 122 | 53% | 15/64 | 46 043 | 5.31 |
| 7 | 1.37 | 0.049 | Actin, cytoplasmic 1 | P60710 | Actb | Mm.391967 | 63 | 57% | 12/65 | 42 052 | 5.29 |
| 8 | 1.29 | 0.018 | Serpin B6 | Q60854 | Serpinb6 | Mm.252210 | 59 | 40% | 13/67 | 42 913 | 5.53 |
| 9 | 1.24 | 0.050 | Gelsolin | P13020 | Gsn | Mm.21109 | 85 | 34% | 19/71 | 86 287 | 5.83 |
| 10 | 1.21 | 0.050 | Moesin | P26041 | Msn | Mm.138876 | 124 | 48% | 29/71 | 67 839 | 6.22 |
| 10′ | 1.17 | 0.049 | Moesin | P26041 | Msn | Mm.138876 | 59 | 45% | 25/122 | 67 839 | 6.22 |
| Downregulated proteins | |||||||||||
| 11 | −1.68 | 0.018 | Heat shock protein HSP 90‐beta | P11499 | Hsp90ab1 | Mm.2180 | 152 | 32% | 19/24 | 83 571 | 4.97 |
| 12 | −1.62 | 0.018 | Alpha‐actinin‐1 | Q7TPR4 | Actn1 | Mm.253564 | 116 | 47% | 38/119 | 103 631 | 5.23 |
| 13 | −1.59 | 0.028 | Elongation factor 2 | P58252 | Eef2 | Mm.326799 | 78 | 17% | 14/26 | 96 222 | 6.41 |
| 14 | −1.54 | 0.035 | 60 kDa heat shock protein, mitochondrial | P63038 | Hspd1 | Mm.1777 | 70 | 18% | 9/16 | 61 088 | 5.91 |
| 11′ | −1.49 | 0.050 | Heat shock protein HSP 90‐beta | P11499 | Hsp90ab1 | Mm.2180 | 121 | 50% | 30/103 | 83 571 | 4.97 |
| 15 | −1.40 | 0.018 | Eukaryotic initiation factor 4A‐I | P60843 | Eif4a1 | Mm.371557 | 86 | 30% | 12/23 | 46 353 | 5.32 |
| 16 | −1.36 | 0.050 | ATP synthase subunit beta, mitochondrial | P56480 | Atp5b | Mm.238973 | 203 | 50% | 22/37 | 56 265 | 5.19 |
| 13′ | −1.35 | 0.024 | Elongation factor 2 | P58252 | Eef2 | Mm.326799 | 173 | 45% | 32/72 | 96 222 | 6.41 |
| 17 | −1.35 | 0.039 | Mitochondrial import receptor subunit TOM34 | Q9CYG7 | Tomm34 | Mm.23173 | 55 | 39% | 10/86 | 34 656 | 9.24 |
| 18 | −1.34 | 0.020 | Heterogeneous nuclear ribonucleoprotein U‐like protein 2 | Q00PI9 | Hnrnpul2 | Mm.476519 | 69 | 34% | 23/91 | 85 515 | 4.83 |
| 19 | −1.33 | 0.047 | Eukaryotic translation initiation factor 5A‐1 | P63242 | Eif5a | Mm.29324 | 84 | 60% | 9/67 | 17 049 | 5.08 |
| 20 | −1.30 | 0.031 | Heat shock cognate 71 kDa protein | P63017 | Hspa8 | Mm.290774 | 76 | 20% | 13/32 | 71 055 | 5.37 |
| 21 | −1.30 | 0.049 | 40S ribosomal protein SA | P14206 | Rpsa | Mm.4071 | 105 | 46% | 13/68 | 32 931 | 4.80 |
| 22 | −1.29 | 0.049 | Fibrinogen beta chain | Q8K0E8 | Fgb | Mm.30063 | 76 | 42% | 16/66 | 55 402 | 6.68 |
| 23 | −1.25 | 0.035 | T‐complex protein 1 subunit epsilon | P80316 | Cct5 | Mm.282158 | 98 | 31% | 14/26 | 60 042 | 5.72 |
| 24 | −1.22 | 0.018 | Glycine‐tRNA ligase | Q9CZD3 | Gars | Mm.250004 | 97 | 40% | 24/96 | 82 624 | 6.24 |
| 25 | −1.11 | 0.043 | l‐lactate dehydrogenase A chain | P06151 | Ldha | Mm.29324 | 98 | 30% | 10/19 | 36 817 | 7.62 |
| 26 | −1.10 | 0.042 | Bifunctional purine biosynthesis protein PURH | Q9CWJ9 | Atic | Mm.38010 | 132 | 54% | 28/91 | 64 690 | 6.30 |
Figure 5.
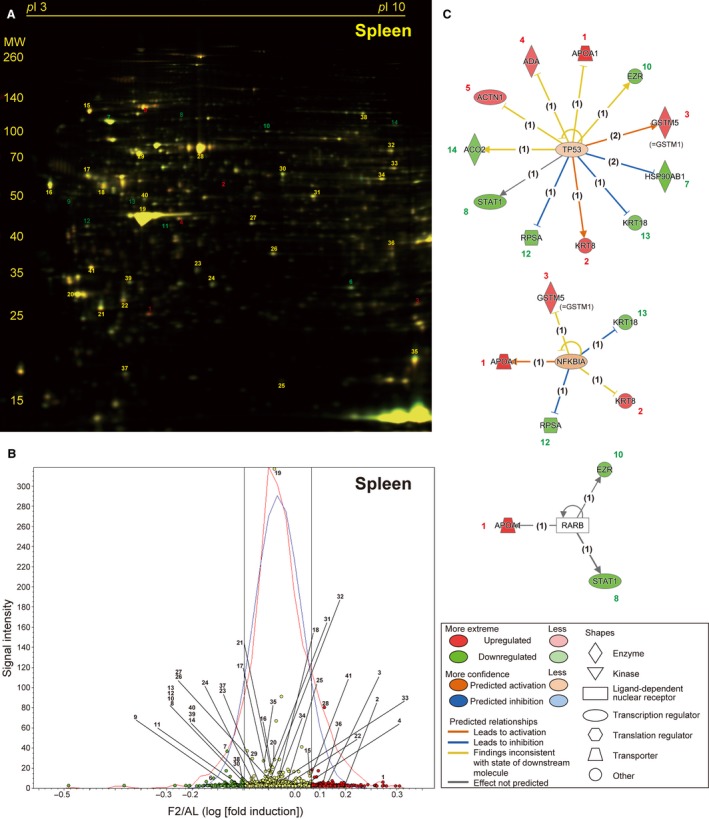
Fasting‐induced protein remodeling in the spleen. Fluorescent 2D DIGE was performed on spleen homogenates from ad libitum‐fed (AL) and 2‐day fasted (F2) mice. (A) Representative fluorescent gel image in which proteins upregulated by fasting are labeled in red and those downregulated are in green. (B) Quantitative profiling of the above image by DeCyder. (C) The three highest scoring upstream regulators (TP53, NFKBIA, and RARB) listed by IPA of the samples from AL and F2 mice (n = 4 each). Refer to Fig. 2 legend for detailed information.
Table 4.
Protein expression changes upon 48‐h fasting in mouse spleen
| Spleen spot ID | Fold change | P‐ value | Protein name | Uniprot ID | Gene name | Unigene ID | Mascot score | Sequence coverage | Peptide matches | MW | pI |
|---|---|---|---|---|---|---|---|---|---|---|---|
| Upregulated proteins | |||||||||||
| 1 | 1.68 | 0.007 | Apolipoprotein A‐I | Q00623 | Apoa1 | Mm.26743 | 120 | 51% | 18/60 | 30 597 | 5.51 |
| 2 | 1.37 | 0.018 | Keratin, type II cytoskeletal 8 | P11679 | Krt8 | Mm.358618 | 193 | 70% | 43/128 | 54 531 | 5.70 |
| 3 | 1.33 | 0.043 | Glutathione S‐transferase μ1 | P10649 | Gstm1 | Mm.37199 | 107 | 77% | 24/107 | 26 067 | 7.71 |
| 4 | 1.23 | 0.020 | Adenosine deaminase | P03958 | Ada | Mm.388 | 64 | 55% | 14/77 | 40 251 | 5.48 |
| 5 | 1.23 | 0.030 | Mixture: Alpha‐actinin‐1 | Q7TPR4 | Actn1 | Mm.253564 | 185 | 63% | 50/132 | 103 631 | 5.23 |
| Mixture: Alpha‐actinin‐4 | P57780 | Actn4 | Mm.81144 | 168 | 55% | 44/132 | 105 368 | 5.25 | |||
| Downregulated proteins | |||||||||||
| 6 | −1.62 | 0.030 | Carbonic anhydrase 2 | P00920 | Ca2 | Mm.239871 | 70 | 60% | 9/51 | 29 129 | 6.49 |
| 7 | −1.36 | 0.007 | Mixture: Heat shock protein HSP 90‐beta | P11499 | Hsp90ab | Mm.222 | 191 | 58% | 39/99 | 83 571 | 4.97 |
| Mixture: Heat shock protein HSP 90‐alpha | P07901 | Hsp90aa1 | Mm.341186 | 127 | 53% | 32/99 | 85 134 | 4.93 | |||
| 8 | −1.30 | 0.034 | Signal transducer and activator of transcription 1 | P42225 | Stat1 | Mm.277406 | 73 | 30% | 18/59 | 87 826 | 5.42 |
| 9 | −1.27 | 0.006 | Ribonuclease inhibitor | Q91VI7 | Rnh1 | Mm.10152 | 133 | 68% | 21/76 | 51 495 | 4.69 |
| 10 | −1.23 | 0.030 | Ezrin | P26040 | Ezr | Mm.277812 | 118 | 57% | 36/99 | 69 478 | 5.83 |
| 11 | −1.21 | 0.030 | Glutaredoxin‐3 | Q9CQM9 | Glrx3 | Mm.267692 | 76 | 43% | 12/75 | 38 039 | 5.42 |
| 12 | −1.20 | 0.030 | 40S ribosomal protein SA | P14206 | Rpsa | Mm.4071 | 147 | 58% | 19/85 | 32 931 | 4.80 |
| 13 | −1.16 | 0.012 | Keratin, type I cytoskeletal 18 | P05784 | Krt18 | Mm.22479 | 129 | 66% | 24/85 | 47 509 | 5.22 |
| 14 | −1.12 | 0.030 | Aconitate hydratase, mitochondrial | Q99KI0 | Aco2 | Mm.154581 | 234 | 55% | 40/106 | 86 151 | 8.08 |
When differentially expressed proteins (upon fasting) were classified by the biological processes involved and molecular functions using PANTHER software, both classification patterns were quite similar between the liver and kidney and between the thymus and spleen (Fig. 6).
Figure 6.
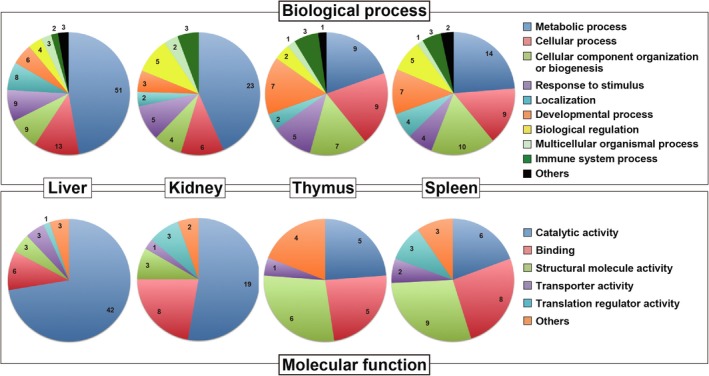
Venn diagrams for clarification of identified proteins that are involved in various biological processes and molecular functions. Fasting‐regulated proteins in the liver, kidney, thymus, and spleen are categorized by ‘biological process’ or ‘molecular function’ using PANTHER software.
Protein expression changes in the brain and testis
Two‐day fasting induced only 2.7% and 9.2% weight losses in the brain and testis, respectively 20. No apparent protein degradation systems were found to be activated in either organ in our previous RT‐PCR analysis 20. In representative 2D gels, among a total of 2189 spots detected in the brain (Fig. 7A), 360 (16.4%, red circles) and 337 (15.4%, green circles) spots were found to be up‐ or downregulated, respectively (Fig. 7B), and among a total of 2301 spots detected in the testis (Fig. 7C), 184 (8.0%, red circles) and 249 (10.8%, green circles) spots were found to be up‐ or downregulated, respectively (Fig. 7D). However, the DeCyder comparative analysis of four AL and four F2 brain (and testis) samples revealed no consistent alterations in protein expression.
Figure 7.
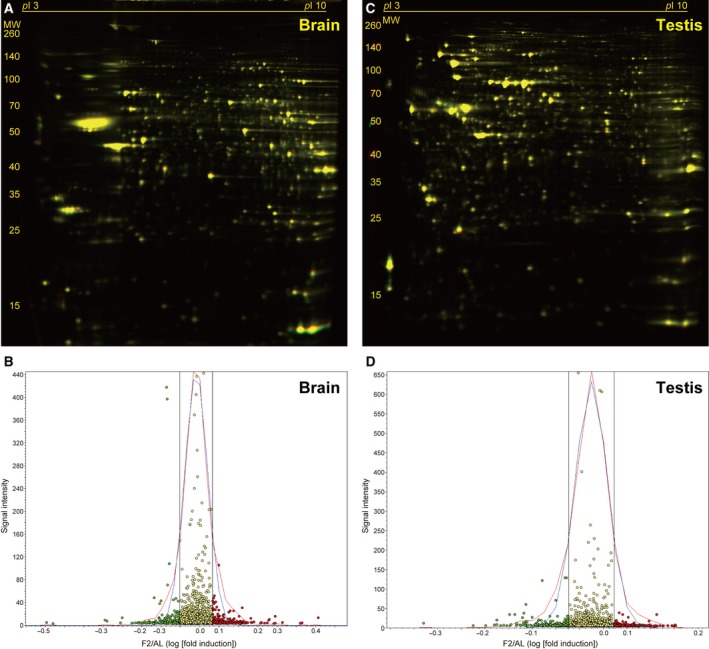
Fasting‐induced protein remodeling in the brain and testis. Fluorescent 2D DIGE was performed on brain (A and B) and testis (C and D) homogenates from ad libitum‐fed (AL) and 2‐day fasted (F2) mice. (A and C) Representative fluorescent images, in which proteins upregulated by fasting are labeled in red and those downregulated are in green. (B and D) Quantitative profiling of the above images using DeCyder software. Refer to Fig. 2 legend for detailed information.
Discussion
This study investigated global protein expression changes in six major mouse organs upon 2‐day fasting. After 1‐ or 2‐day fasting, blood levels of glucose, insulin, and C‐peptide 2 (another component of proinsulin [insulin + C‐peptide 2] that has its own physiological properties 25) were significantly reduced compared with the levels in AL mice (67.1%, 61.3%, and 66.3%, respectively [Fig. 1]). Moreover, the levels of two adipose‐derived peptide hormones, leptin (the pleiotropic hormone of satiation signals/energy expenditure 26, 27) and resistin (the hormone that may ‘resist’ insulin actions 28), were decreased to the same extent in F1 and F2 mice (Fig. 1). In contrast, ketone bodies and GIP became more accumulated in F2 mice (Fig. 1). High accumulation of ketone bodies may reflect a progressive systemic energy shift from glucose to ketone bodies. GIP is a polypeptide inhibitor of gastric acid secretion and acts as an affective promotor of insulin secretion 29; therefore, its elevation could be a delayed compensatory action against low plasma levels of insulin (Fig. 1). These data indicated somewhat altered systemic conditions between F1 and F2 mice. We identified 72, 26, 14, and 32 proteins that were significantly up‐ or downregulated in the liver, thymus, spleen, and kidney of F2 mice, respectively, but significant expression changes were not found in F1 mice (data not shown).
Previous studies demonstrated the pivotal roles of PPARα in mediating adaptive responses to fasting in the liver (Fig. 2C and Table S2 [Sheet A]), as observed in the present study; PPARα positively regulates gluconeogenesis, peroxisomal/mitochondrial β‐oxidation, fatty acid transport, and ketogenesis and also negatively regulates glycolysis, amino acid metabolism, and inflammation, by binding to specific nucleotide sequences known as peroxisome proliferator response elements (PPREs) in the promoter regions of target genes 23, 24. PPARα‐knockout mice have been shown to display several dysregulated responses such as severe hypoglycemia, hypoketonemia, elevated plasma free fatty acid levels, and fatty liver upon fasting 4, 5. Accordingly, we found hepatic upregulation of enzymes involved in gluconeogenesis (Pck1 and Pc), lipid β‐oxidation (Acox1), ketogenesis (Hmgcs2), and downregulation of the enzymes involved in fatty acid synthesis (Fasn) and glycogenolysis (Pygl) (Fig. 2C, Table 1, and Table S1 [Sheet A]). Although all genes encoding these ‘upregulated’ proteins have been shown to contain PPREs in their promoter regions 30, 31, 32, 33, 34 and thus can be activated directly by ligand‐bound PPARα, the suppression of Fasn and Pygl expression could be caused by a secondary mechanism such as low plasma levels of insulin 35, 36.
PPARα is activated by both endogenous and synthetic ligands; the former includes long‐chain polyunsaturated fatty acids and eicosanoids such as leukotriene B4 and the latter includes fibrates such as fenofibrate, bezafibrate, and clinofibrate, the drugs for the treatment of hypertriglyceridemia 24. Endogenous ligand activation of PPARα could occur in other PPARα‐expressing organs such as kidney and heart 37 because large amounts of free fatty acids enter the systemic circulation during fasting. Indeed, we found PPARα regulation of nine proteins in the kidney of F2 mice (Fig 3C and Table S2 [Sheet B]) although the regulatory genes and directions were not necessarily identical to the liver (Figs. 2C and 3C). The upstream regulator analysis listed NR1I2 and PPARγ as the second and third highest scoring transcriptional regulators, respectively, but their P‐values were much (7–8 orders) higher than PPARα (Fig. 2C and Table S2 [Sheet A]). Expression of PPARγ was rather restricted to adipose tissue and the immune systems, and its hepatic expression was shown to be extremely low compared with PPARα in adult rats 37.
The highest scoring regulator in the kidney of F2 mice was ATF6, which could regulate the expression of five proteins (Fig. 3C): Calr, Hsp90b1, Pck1 (spot 1), Acox1 (spot 3), and Cpt2 (carnitine O‐palmitoyltransferase 2, mitochondrial; spot 6; an enzyme involved in acyl transfer across the mitochondrial inner membrane for β‐oxidation in the matrix) (Fig. 3A,B, Table 2, and Table S2 [Sheet B]). Although the upregulation of Pck1/Acox1/Cpt2 was common between liver and kidney, the two major organs for both gluconeogenesis and β‐oxidation (Figs. 2C and 3C), the downregulation of Calr and Hsp90b1 was rather kidney‐specific, which may place ATF6 upstream of PPARα in IPA analysis (Table S2 [Sheet B]). ATF6 is an endoplasmic reticulum stress‐regulated transmembrane transcriptional factor that is activated by its proteolytic cleavage with site 1 and site 2 proteases; the resultant cytosolic portion translocates to the nucleus, binds to ER stress response elements, and induces ER stress‐responsive genes 38. Recent evidence indicates that the interruption of hepatocellular autophagy attenuates the ATF6‐mediated unfolded protein response 39; thus, conversely, renal autophagy during fasting might induce ATF6 activation. In addition, KLF15, a member of the Krüppel‐like family of transcriptional factors, has been shown to regulate gluconeogenesis and KLF15‐deficient mice displayed severe hypoglycemia after overnight fasting 40; accordingly, 2‐day fasting induced KLF15 in two gluconeogenic organs, the liver (71st highest score) and the kidney (third highest score) (Table S2 [Sheet A and B]).
The other major finding of this study was TP53‐mediated transcriptional regulation in the thymus, spleen, and liver; TP53 was listed as the second, first, and fourth highest scoring upstream regulator, respectively (Figs. 4C and 5C; Table S2 [Sheet A, C, and D]). TP53 has been described as ‘the guardian of the genome’ because it regulates ‘thousands 41’ of target genes to prevent genome mutation and is encoded by the most frequently mutated gene in human cancer; however, TP53 also regulates multiple cellular responses including autophagy 42, inflammation, pluripotency, and energy metabolism 43, 44. A recent study mentioned that fasting robustly increases (stabilizes) TP53 in the mouse liver via hepatocyte autonomous and AMP‐activated protein kinase‐dependent posttranscriptional mechanisms, thereby regulating gluconeogenesis and amino acid catabolism 8. In addition, TP53‐deleted mice became hypoglycemic and showed defective utilization of hepatic amino acids upon fasting 8. Of note, TP53 regulated somewhat different sets of genes in the thymus and spleen. Two‐day fasting upregulated five proteins (Krt8/18 [keratin, type II cytoskeletal 8/18], Anxa4 [annexin A4], Actb [actin, cytoplasmic 1], Serpinb6 [serpin B6], and Gsn [gelsolin]), and downregulated five proteins (Hsp90ab1 [heat shock protein HSP 90‐beta], Actn1 [alpha‐actinin‐1], Hspd1 [60 kDa heat shock protein, mitochondrial], Hspa8 [heat shock cognate 71 kDa protein], Rpsa [40S ribosomal protein SA], and Ldha [l‐lactate dehydrogenase A chain]) in the thymus (Fig. 4C, Table 3, and Table S1 [Sheet C]). In contrast, the fasting upregulated five proteins (Apoa1 [apolipoprotein A‐I], Krt8, Gstm5 [= Gstm1, glutathione S‐transferase Mu 1], Ada [adenosine deaminase], and Actn1/4 [mixtures of alpha‐actinin 1/4], and downregulated six proteins (Hsp90ab/aa1 [mixtures of heat shock protein HSP 90‐beta/alpha], Stat 1 [signal transducer and activator of transcription 1], Ezr [ezrin], Rpsa, Krt18, and Aco2 [aconitate hydratase, mitochondrial] in the spleen (Fig. 5C, Table 4, and Table S1 [Sheet D]). In the spleen, nearly half of the proteins with altered expression during fasting were TP53 target gene proteins, which may place TP53 at the top of the upstream regulator lists (Table S2 [Sheet D]). Furthermore, TP53 regulation of 12 proteins (among 19 proteins identified) was liver‐specific (Table S2 [Sheet A]). Fasting/calorie restriction has been also shown to reduce age‐related diseases including cancer 45; and therefore, fasting‐induced TP53 regulation could be involved in such systemic tumor suppression.
MYCN and HTT were listed as the first and third highest scoring upstream regulators in the thymus (Fig. 4C), where NFKBIA and RARB were as the second and third highest scoring upstream regulators in the spleen (Fig. 5C). However, they only regulated only 6, 7, 5, and 3 proteins, respectively, in the IPA analysis, and their physiological roles await further investigations. In conclusion, this proteomic study revealed protein remodeling in response to fasting in the mouse liver, kidney, thymus, and spleen that could be transcriptionally regulated by PPARα and/or TP53. These findings could open new perspectives to understating the systemic effects of single fasting in animal experiments.
Author contributions
SK, JY, and II conceived and designed the project; SK, JY, HO, YT, SY, and NA acquired the data; SK, JY, HO, YT, SY, NA, and II analyzed and interpreted the data; SK and II wrote the manuscript.
Supporting information
Table S1. (A) Liver: Differentially expressed proteins upon 2‐day fasting identified by 2D DIGE and MALDI‐TOF/MS analyses. (B) Kidney: Differentially expressed proteins upon 2‐day fasting identified by 2D DIGE and MALDI‐TOF/MS analyses. (C) Thymus: Differentially expressed proteins upon 2‐day fasting identified by 2D DIGE and MALDI‐TOF/MS analyses. (D) Spleen: Differentially expressed proteins upon 2‐day fasting identified by 2D DIGE and MALDI‐TOF/MS analyses.
Table S2. (A) Liver: Upstream regulator analysis of differentially expressed proteins upon 2‐day fasting by Ingenuity Pathway Analysis (IPA). (B) Kidney: Upstream regulator analysis of differentially expressed proteins upon 2‐day fasting by Ingenuity Pathway Analysis (IPA). (C) Thymus: Upstream regulator analysis of differentially expressed proteins upon 2‐day fasting by Ingenuity Pathway Analysis (IPA). (D) Spleen: Upstream regulator analysis of differentially expressed proteins upon 2‐day fasting by Ingenuity Pathway Analysis (IPA).
Acknowledgements
This work was partially supported by A Grant‐in‐Aid for Young Scientists of Showa Pharmaceutical University (to SK) and JSPS KAKENHIGrant Numbers 15J03367 (to SK), 17K08287 (to AN), 16H05107, 16K15194, and 2522010 (to II).
References
- 1. Longo VD and Mattson MP (2014) Fasting: molecular mechanisms and clinical applications. Cell Metab 19, 181–192. [DOI] [PMC free article] [PubMed] [Google Scholar]
- 2. van Praag H, Fleshner M, Schwartz MW and Mattson MP (2014) Exercise, energy intake, glucose homeostasis, and the brain. J Neurosci 34, 15139–15149. [DOI] [PMC free article] [PubMed] [Google Scholar]
- 3. Jensen TL, Kiersgaard MK, Sorensen DB and Mikkelsen LF (2013) Fasting of mice: a review. Lab Anim 47, 225–240. [DOI] [PubMed] [Google Scholar]
- 4. Kersten S, Seydoux J, Peters JM, Gonzalez FJ, Desvergne B and Wahli W (1999) Peroxisome proliferator‐activated receptor alpha mediates the adaptive response to fasting. J Clin Invest 103, 1489–1498. [DOI] [PMC free article] [PubMed] [Google Scholar]
- 5. Leone TC, Weinheimer CJ and Kelly DP (1999) A critical role for the peroxisome proliferator‐activated receptor alpha (PPARalpha) in the cellular fasting response: the PPARalpha‐null mouse as a model of fatty acid oxidation disorders. Proc Natl Acad Sci USA 96, 7473–7478. [DOI] [PMC free article] [PubMed] [Google Scholar]
- 6. Hashimoto T, Cook WS, Qi C, Yeldandi AV, Reddy JK and Rao MS (2000) Defect in peroxisome proliferator‐activated receptor alpha‐inducible fatty acid oxidation determines the severity of hepatic steatosis in response to fasting. J Biol Chem 275, 28918–28928. [DOI] [PubMed] [Google Scholar]
- 7. Kersten S and Stienstra R (2017) The role and regulation of the peroxisome proliferator activated receptor alpha in human liver. Biochimie 136, 75–84. [DOI] [PubMed] [Google Scholar]
- 8. Prokesch A, Graef FA, Madl T, Kahlhofer J, Heidenreich S, Schumann A, Moyschewitz E, Pristoynik P, Blaschitz A, Knauer M et al. (2017) Liver p53 is stabilized upon starvation and required for amino acid catabolism and gluconeogenesis. FASEB J 31, 732–742. [DOI] [PMC free article] [PubMed] [Google Scholar]
- 9. Bertile F, Schaeffer C, Le Maho Y, Raclot T and Van Dorsselaer A (2009) A proteomic approach to identify differentially expressed plasma proteins between the fed and prolonged fasted states. Proteomics 9, 148–158. [DOI] [PubMed] [Google Scholar]
- 10. Lenaerts K, Sokolovic M, Bouwman FG, Lamers WH, Mariman EC and Renes J (2006) Starvation induces phase‐specific changes in the proteome of mouse small intestine. J Proteome Res 5, 2113–2122. [DOI] [PubMed] [Google Scholar]
- 11. Nakano S, Ishii I, Shinmura K, Tamaki K, Hishiki T, Akahoshi N, Ida T, Nakanishi T, Kamata S, Kumagai Y et al. (2015) Hyperhomocysteinemia abrogates fasting‐induced cardioprotection against ischemia/reperfusion by limiting bioavailability of hydrogen sulfide anions. J Mol Med 93, 879–889. [DOI] [PubMed] [Google Scholar]
- 12. Kamata S, Akahoshi N and Ishii I (2015) 2D DIGE proteomic analysis highlights delayed postnatal repression of alpha‐fetoprotein expression in homocystinuria model mice. FEBS Open Bio 5, 535–541. [DOI] [PMC free article] [PubMed] [Google Scholar]
- 13. Kamata S and Ishii I (2018) Rapid 2D DIGE proteomic analysis of mouse liver. Methods Mol Biol 1664, 153–166. [DOI] [PubMed] [Google Scholar]
- 14. Hagiya Y, Kamata S, Mitsuoka S, Okada N, Yoshida S, Yamamoto J, Ohkubo R, Abiko Y, Yamada H, Akahoshi N et al. (2015) Hemizygosity of transsulfuration genes confers increased vulnerability against acetaminophen‐induced hepatotoxicity in mice. Toxicol Appl Pharmacol 282, 195–206. [DOI] [PubMed] [Google Scholar]
- 15. Arentz G, Weiland F, Oehler MK and Hoffmann P (2015) State of the art of 2D DIGE. Proteomics Clin Appl 9, 277–288. [DOI] [PubMed] [Google Scholar]
- 16. Rabilloud T, Chevallet M, Luche S and Lelong C (2010) Two‐dimensional gel electrophoresis in proteomics: past, present and future. J Proteomics 73, 2064–2077. [DOI] [PubMed] [Google Scholar]
- 17. Rabilloud T and Lelong C (2011) Two‐dimensional gel electrophoresis in proteomics: a tutorial. J Proteomics 74, 1829–1841. [DOI] [PubMed] [Google Scholar]
- 18. Kay O (ed) (2018) Difference Gel Electrophoresis: Methods and Protocols. Methods Mol Biol. pp. 1664. Springer, NY. [Google Scholar]
- 19. McIntosh CH, Widenmaier S and Kim SJ (2009) Glucose‐dependent insulinotropic polypeptide (Gastric Inhibitory Polypeptide; GIP). Vitam Horm 80, 409–471. [DOI] [PubMed] [Google Scholar]
- 20. Yamamoto J, Kamata S, Miura A, Nagata T, Kainuma R and Ishii I (2015) Differential adaptive responses to 1‐ or 2‐day fasting in various mouse tissues revealed by quantitative PCR analysis. FEBS Open Bio 5, 357–368. [DOI] [PMC free article] [PubMed] [Google Scholar]
- 21. Hegardt FG (1999) Mitochondrial 3‐hydroxy‐3‐methylglutaryl‐CoA synthase: a control enzyme in ketogenesis. Biochem J 338, 569–582. [PMC free article] [PubMed] [Google Scholar]
- 22. Fukao T, Lopaschuk GD and Mitchell GA (2004) Pathways and control of ketone body metabolism: on the fringe of lipid biochemistry. Prostaglandins Leukot Essent Fatty Acids 70, 243–251. [DOI] [PubMed] [Google Scholar]
- 23. Rakhshandehroo M, Knoch B, Muller M and Kersten S (2010) Peroxisome proliferator‐activated receptor alpha target genes. PPAR Res 2010, 612089. 10.1155/2010/612089 [DOI] [PMC free article] [PubMed] [Google Scholar]
- 24. Mandard S, Muller M and Kersten S (2004) Peroxisome proliferator‐activated receptor alpha target genes. Cell Mol Life Sci 61, 393–416. [DOI] [PMC free article] [PubMed] [Google Scholar]
- 25. Wahren J and Larsson C (2015) C‐peptide: new findings and therapeutic possibilities. Diabetes Res Clin Pract 107, 309–319. [DOI] [PubMed] [Google Scholar]
- 26. Campfield LA, Smith FJ, Guisez Y, Devos R and Burn P (1995) Recombinant mouse OB protein: evidence for a peripheral signal linking adiposity and central neural networks. Science 269, 546–549. [DOI] [PubMed] [Google Scholar]
- 27. McGregor G and Harvey J (2017) Leptin regulation of synaptic function at hippocampal TA‐CA1 and SC‐CA1 synapses: implications for health and disease. Neurochemical Res. 10.1007/s11064-017-2362-1 [DOI] [PMC free article] [PubMed] [Google Scholar]
- 28. Adeghate E (2004) An update on the biology and physiology of resistin. Cell Mol Life Sci 61, 2485–2496. [DOI] [PubMed] [Google Scholar]
- 29. Holst JJ, Windelov JA, Boer GA, Pedersen J, Svendsen B, Christensen M, Torekov S, Asmar M, Hartmann B and Nissen A (2016) Searching for the physiological role of glucose‐dependent insulinotropic polypeptide. J Diabetes Investig 7 (Suppl 1), 8–12. [DOI] [PMC free article] [PubMed] [Google Scholar]
- 30. Beale EG, Forest C and Hammer RE (2003) Regulation of cytosolic phosphoenolpyruvate carboxykinase gene expression in adipocytes. Biochimie 85, 1207–1211. [DOI] [PubMed] [Google Scholar]
- 31. White HM, Koser SL and Donkin SS (2011) Differential regulation of bovine pyruvate carboxylase promoters by fatty acids and peroxisome proliferator‐activated receptor‐alpha agonist. J Dairy Sci 94, 3428–3436. [DOI] [PubMed] [Google Scholar]
- 32. van der Meer DL, Degenhardt T, Vaisanen S, de Groot PJ, Heinaniemi M, de Vries SC, Muller M, Carlberg C and Kersten S (2010) Profiling of promoter occupancy by PPARalpha in human hepatoma cells via ChIP‐chip analysis. Nucleic Acids Res 38, 2839–2850. [DOI] [PMC free article] [PubMed] [Google Scholar]
- 33. Kostiuk MA, Keller BO and Berthiaume LG (2010) Palmitoylation of ketogenic enzyme HMGCS2 enhances its interaction with PPARalpha and transcription at the Hmgcs2 PPRE. FASEB J 24, 1914–1924. [DOI] [PMC free article] [PubMed] [Google Scholar]
- 34. Hsu MH, Savas U, Griffin KJ and Johnson EF (2001) Identification of peroxisome proliferator‐responsive human genes by elevated expression of the peroxisome proliferator‐activated receptor alpha in HepG2 cells. J Biol Chem 276, 27950–27958. [DOI] [PubMed] [Google Scholar]
- 35. Ning J, Hong T, Ward A, Pi J, Liu Z, Liu HY and Cao W (2011) Constitutive role for IRE1alpha‐XBP1 signaling pathway in the insulin‐mediated hepatic lipogenic program. Endocrinology 152, 2247–2255. [DOI] [PMC free article] [PubMed] [Google Scholar]
- 36. Reynet C, Kahn CR and Loeken MR (1996) Expression of the gene encoding glycogen phosphorylase is elevated in diabetic rat skeletal muscle and is regulated by insulin and cyclic AMP. Diabetologia 39, 183–189. [DOI] [PubMed] [Google Scholar]
- 37. Braissant O, Foufelle F, Scotto C, Dauca M and Wahli W (1996) Differential expression of peroxisome proliferator‐activated receptors (PPARs): tissue distribution of PPAR‐alpha, ‐beta, and ‐gamma in the adult rat. Endocrinology 137, 354–366. [DOI] [PubMed] [Google Scholar]
- 38. Sarvani C, Sireesh D and Ramkumar KM (2017) Unraveling the role of ER stress inhibitors in the context of metabolic diseases. Pharmacol Res 119, 412–421. [DOI] [PubMed] [Google Scholar]
- 39. Kwanten WJ, Vandewynckel YP, Martinet W, De Winter BY, Michielsen PP, Van Hoof VO, Driessen A, Timmermans JP, Bedossa P, Van Vlierberghe H et al. (2016) Hepatocellular autophagy modulates the unfolded protein response and fasting‐induced steatosis in mice. Am J Physiol Gastrointest Liver Physiol 311, G599–G609. [DOI] [PMC free article] [PubMed] [Google Scholar]
- 40. Gray S, Wang B, Orihuela Y, Hong EG, Fisch S, Haldar S, Cline GW, Kim JK, Peroni OD, Kahn BB et al. (2007) Regulation of gluconeogenesis by Kruppel‐like factor 15. Cell Metab 5, 305–312. [DOI] [PMC free article] [PubMed] [Google Scholar]
- 41. Fischer M (2017) Census and evaluation of p53 target genes. Oncogene 36, 3943–3956. [DOI] [PMC free article] [PubMed] [Google Scholar]
- 42. White E (2016) Autophagy and p53. Cold Spring Harb Perspect Med 6, a026120. [DOI] [PMC free article] [PubMed] [Google Scholar]
- 43. Kastenhuber ER and Lowe SW (2017) Putting p53 in Context. Cell 170, 1062–1078. [DOI] [PMC free article] [PubMed] [Google Scholar]
- 44. Sullivan KD, Galbraith MD, Andrysik Z and Espinosa JM (2018) Mechanisms of transcriptional regulation by p53. Cell Death Differ 25, 133–143. [DOI] [PMC free article] [PubMed] [Google Scholar]
- 45. O'Flanagan CH, Smith LA, McDonell SB and Hursting SD (2017) When less may be more: calorie restriction and response to cancer therapy. BMC Med 15, 106. [DOI] [PMC free article] [PubMed] [Google Scholar]
Associated Data
This section collects any data citations, data availability statements, or supplementary materials included in this article.
Supplementary Materials
Table S1. (A) Liver: Differentially expressed proteins upon 2‐day fasting identified by 2D DIGE and MALDI‐TOF/MS analyses. (B) Kidney: Differentially expressed proteins upon 2‐day fasting identified by 2D DIGE and MALDI‐TOF/MS analyses. (C) Thymus: Differentially expressed proteins upon 2‐day fasting identified by 2D DIGE and MALDI‐TOF/MS analyses. (D) Spleen: Differentially expressed proteins upon 2‐day fasting identified by 2D DIGE and MALDI‐TOF/MS analyses.
Table S2. (A) Liver: Upstream regulator analysis of differentially expressed proteins upon 2‐day fasting by Ingenuity Pathway Analysis (IPA). (B) Kidney: Upstream regulator analysis of differentially expressed proteins upon 2‐day fasting by Ingenuity Pathway Analysis (IPA). (C) Thymus: Upstream regulator analysis of differentially expressed proteins upon 2‐day fasting by Ingenuity Pathway Analysis (IPA). (D) Spleen: Upstream regulator analysis of differentially expressed proteins upon 2‐day fasting by Ingenuity Pathway Analysis (IPA).