

Abstract
Breast and prostate cancer research to date has largely been predicated on the use of cell lines in vitro or in vivo. These limitations have led to the development of more clinically relevant models, such as organoids or murine xenografts that utilize patient‐derived material; however, issues related to low take rate, long duration of establishment, and the associated costs constrain use of these models. This study demonstrates that ex vivo culture of freshly resected breast and prostate tumor specimens obtained from surgery, termed patient‐derived explants (PDEs), provides a high‐throughput and cost‐effective model that retains the native tissue architecture, microenvironment, cell viability, and key oncogenic drivers. The PDE model provides a unique approach for direct evaluation of drug responses on an individual patient's tumor, which is amenable to analysis using contemporary genomic technologies. The ability to rapidly evaluate drug efficacy in patient‐derived material has high potential to facilitate implementation of personalized medicine approaches.
Keywords: ex vivo culture, patient‐derived explant, preclinical tumor model
Abbreviations
- ANOVA
analysis of variance
- AR
androgen receptor
- BrdU
5‐bromo‐2‐deoxyuridine
- ChIP
chromatin immunoprecipitation
- E2
estradiol
- ERα
estrogen receptor alpha
- H&E
hematoxylin and eosin
- LHRH
luteinizing hormone‐releasing hormone
- PDE
patient‐derived explant
- PDX
patient‐derived xenograft
- PGR
progesterone receptor
- PSA
prostate‐specific antigen
- RARA
retinoic acid receptor‐α
- RNAi
RNA interference
- shRNA
short hairpin RNA
1. Introduction
Preclinical models that accurately replicate the native architecture and microenvironment of primary human tumors are urgently needed to improve our understanding of basic tumor biology and to facilitate the development of improved therapeutic approaches (Thompson et al., 2008). The use of immortalized human cell line models for investigating novel therapies in vitro or in vivo is convenient but also a major reason for the high failure of new drugs entering clinical trials. To move toward more clinically relevant model systems, researchers have adopted patient‐derived approaches such as organoids (Drost et al., 2016; Gao et al., 2014) and xenografts (PDX) (Lawrence et al., 2013; Wang et al., 2005; Whittle et al., 2015). We report an alternative approach of culturing freshly resected breast and prostate cancer tissue as patient‐derived explants (PDE). Ex vivo culture of human prostatic tissue has been used since the 1970s with varying degrees of success, and protocols ranging from total immersion of tissue pieces in medium to culture of tissue pieces or slices on grid or sponge scaffolds, reviewed by Centenera et al. (2013). Despite this long‐standing history and general acknowledgment of the potential of ex vivo cultured tissues to increase the clinical relevance of laboratory research (Centenera et al., 2013; Kim, 2005; Pretlow et al., 1995; Risbridger et al., 2018; Vescio et al., 1991), the PDE method has not been widely adopted to study solid tumors. The purpose of this study was to highlight advantages of the PDE model and demonstrate how it can be applied to interrogate hormone‐dependent cancers such as those of the breast and prostate.
2. Materials and methods
2.1. Ethical approval for research using human tissue
All research conducted in this study conformed to the standards set by the Declaration of Helsinki.
2.1.1. Australia
The use of freshly resected human tissue samples for this study was approved by the Human Research Ethics Committees of the University of Adelaide, the Royal Adelaide Hospital, and Burnside War Memorial Hospital. All material is collected with written informed consent from patients, and data are de‐identified according to National Health and Medical Research Council of Australia guidelines for human research. Prostate tissues were collected as part of the Australian Prostate Cancer BioResource.
2.1.2. United States
Prostate tissues from UT Southwestern Medical Center at Dallas and Thomas Jefferson University hospitals were obtained with written informed consent from patients undergoing radical prostatectomy for high‐volume cancer, under Institutional Review Board‐approved protocols for the respective institutions.
Clinical characteristics and histopathology of patients who donated tissue to this study are outlined in Table S1.
2.2. PDE culture of solid tumors
The PDE technique utilized in this study employs a gelatin sponge platform (Centenera et al., 2013) (Fig. 1A). This method was selected for two key reasons: firstly, the use of a substrate for explant culture prevents cellular outgrowth that is frequently observed when tissues are cultured without support and completely submerged in media (Pretlow et al., 1995; Varani et al., 1999); secondly, the gelatin sponge used in this study is a commercial medical device developed for hemostasis (Ferrosan, 2014) that is readily available, cost‐effective, and simple to use, making the method feasible for widespread adoption in translational cancer research laboratories.
Figure 1.

PDE culture sustains tissue morphology, viability, and endocrine signaling. (A) PDE tissue culture method. (i) Following surgery, a core of tumor tissue is removed by a pathologist (tumor area demarcated by broken white line), (ii) the tumor sample is dissected into 1‐mm3 fragments, (iii) cultured in 24‐well plates on a gelatin sponge sitting in media, allowing direct comparison of treatments in matched tumor tissue, and (iv) schematic diagram of PDE setup. (B) Representative hematoxylin and eosin staining of PDEs from primary prostate and breast tumors, showing maintenance of gross morphology following 6 days in culture. Arrows indicate examples of tumor cells and surrounding stroma. (C) HIF1α staining from three independent laboratories showed no significant difference in prostate cancer tissue oxygenation after 6 days of PDE culture. Staining intensity was manually assessed by a single pathologist (P. Kapur). Data are presented as mean ± SEM, n = 3. (D) Expression and signaling of steroid receptors critical for prostate and breast carcinogenesis were maintained in PDEs cultured in complete media for 6 days, as demonstrated by immunostaining for AR and the AR‐regulated protein PSA in prostate PDEs, and ERα and the ERα‐regulated protein PGR in breast cancer PDEs. Scale bars represent 50 μm.
Figure 1A illustrates the PDE method using prostate tumors as an example. Following surgical tissue removal, the surgeon or clinical pathologist resects a sample of the presumed malignant or nonmalignant region and the specimen is transported to the research laboratory in cold phosphate‐buffered saline on ice, typically within 1–2 h of surgery. Under sterile conditions, tissue was placed onto the lid of a 10‐cm plate along with the saline it was transported in. Using a surgical blade, a 1‐mm‐thick longitudinal section of the tissue sample is cut and placed into neutral‐buffered formalin for paraffin embedding. This tissue is called the Day 0 sample and is used to determine the cancer content of the tissue following staining with hematoxylin and eosin (H&E). The remaining tissue is dissected into 1‐mm3 pieces, called explants, and placed in triplicate or quadruplicate (depending on amount of tissue received) on top of a media‐soaked gelatin sponge (Ethicon; Johnson & Johnson, Somerville, NJ, USA) inside the wells of a 24‐well plate containing 500 μL RPMI 1640 medium containing 10% fetal bovine serum, 1× antimycotic/antibiotic solution, 0.01 mg·mL−1 hydrocortisone, and 0.01 mg·mL−1 insulin. The appropriate vehicle, treatment, or shRNA was added directly to the media inside the appropriate tissue culture well at the indicated concentrations, allowing direct comparison of treatments and controls. Explants were cultured at 37 °C and 5% CO2 for various time points and then formalin‐fixed and paraffin‐embedded, snap‐frozen, or preserved in RNAlater (Invitrogen, San Diego, CA, USA) depending on the desired downstream analysis. For assessment of BrdU incorporation, BrdU (10 μm) was added to the culture medium 2 h (prostate) or 24 h (breast) prior to harvest.
In our collective experience, all tissues containing epithelial cells can successfully be cultured, and the limiting factor for analysis is instead the presence of sufficient numbers of epithelial (for benign tissue studies) or malignant cells (for cancer tissue studies). For this reason, routine hematoxylin and eosin (H&E) staining of all Day 0 and cultured tissues is an essential part of our protocol to confirm the presence and approximate percentage of benign/malignant cells within the specimens before proceeding with further analyses. Between the three prostate cancer laboratories, our collective experience indicates that approximately 10% of tissues from high‐volume disease and 20–30% of tissues from low‐volume disease do not contain malignant cells, and this is largely due to sampling.
2.3. Immunohistochemistry
Immunohistochemical staining was performed on 2‐ to 4‐μm sections that were deparaffinized, rehydrated, and blocked for endogenous peroxidase before being subjected to heat‐induced epitope retrieval. Breast tissues were additionally treated to block for endogenous biotin. Sections were blocked and incubated with the appropriate primary and secondary antibodies, then developed using 3‐3′‐diaminobenzidine chromogen, and counterstained with hematoxylin. Appropriate positive and negative controls were included in all runs. Table S2 lists pertinent information for all antigens. Immunostaining in the Tilley laboratory was performed manually, and in the Raj laboratory, immunostaining was performed on the DAKO autostainer (DakoCytomation, Carpinteria, CA, USA). Tissues cultured by the Knudsen laboratory were stained by the Raj laboratory. The percent positivity and intensity of nuclear staining for each antigen were quantified manually by an independent pathologist or observer, who was blinded to the treatments/conditions.
2.4. RNA extraction
Tissues preserved in RNAlater (Qiagen, Hilden, Germany) were homogenized in ice‐cold PBS with a Precellys 24 Tissue Homogenizer (Bertin Technologies, Montigny‐le‐Bretonneux, France), and RNA was extracted using Trizol according to the manufacturer's instructions. DNAse treatment was performed using the TurboDNase kit (Ambion, Austin, TX, USA) according to manufacturer's instructions. RNA was quantified using a Nanodrop 1000 spectrophotometer (Thermo Fisher Scientific, Waltham, MA, USA). Reverse transcription was performed on 400 ng total RNA using the iScript kit (Bio‐Rad Laboratories, Hercules, CA, USA) according to manufacturer's instructions.
2.5. Quantitative real‐time PCR
qPCR was performed using 2 μL of cDNA from whole tissue extracts and SYBR green for prostate explants, and gene‐specific TaqMan assays were performed for breast explants. Primers and assay IDs are listed in Table S3. Relative gene expression was calculated using the ΔCt method. Expression of PSA in prostate explants was normalized to PPIA, L19, TUBA1B, ALAS1, and GAPDH. Progesterone receptor (PGR) expression in breast explants was normalized to IPO8 and PUM1.
2.6. Ablation of AR by shRNA
The shAR and shControl lentiviral constructs were packaged using Lenti‐X HT (Open Biosystems, Dharmacon Inc., Lafayette, CO, USA) according to the manufacturer's instructions and added to the tissue culture medium for 48 h. Lentiviral media was then removed and replaced with fresh media containing no lentivirus and cultured for an additional 48 h. Tissues were harvested and formalin‐fixed prior to immunohistochemistry staining for androgen receptor (AR) and prostate‐specific antigen (PSA) as described above.
2.7. Chromatin immunoprecipitation followed by massively parallel DNA sequencing (ChIP‐seq)
Breast cancer PDEs cultured in complete medium containing vehicle (EtOH; 0.1%), 17β‐estradiol (E2; 10 nm), or synthetic PGR agonist R5020 (10 nm) for 72 h were harvested, crosslinked, and processed for ChIP‐seq analysis as described previously (Ross‐Innes et al., 2012). The estrogen receptor alpha (ERα) HC‐20 antibody (Santa Cruz Biotechnologies, Dallas, TX, USA) was used for immunoprecipitation of ERα from PDE tissue lysates. Sequences generated by an Illumina HiSeq 2000 were processed by the Illumina analysis pipeline version 1.6.1 and aligned to the Human Reference Genome (hg19) using BWA version 0.5.5 (Li and Durbin, 2009). Reads were filtered by removing those with a BWA alignment quality score less than 15. Enriched ERα binding regions were identified by comparing ERα ChIP DNA samples to total ChIP input DNA. ER ChIP‐sequencing was then performed from each PDE tissue and treatment. Peak calling was performed using MACS2 version 1.4.0rc2 (Zhang et al., 2008).
2.8. Statistical analysis
Data are displayed as the mean ± standard error. Differences were determined using Student's t‐test or one‐way analysis of variance (ANOVA). The correlation between Ki67 and PSA expression was analyzed using the Spearman correlation test with an accompanying P value. All statistics and generation of heat map were performed using graphpad prism Software version 7.02 (GraphPad Software, La Jolla, CA, USA). A P‐value ≤ 0.05 was considered statistically significant.
3. Results
3.1. Morphology, viability, and molecular signaling are sustained in PDEs
Histopathological evaluation of tissue architecture and cellular appearance demonstrated that the morphology of PDEs cultured for up to 6 days on gelatin sponges is consistent with the original, uncultured (i.e., Day 0) tumor tissue, as illustrated by representative H&E staining of prostate cancer and breast cancer (Fig. 1B). Tumor cells are present in the surrounding stroma, demonstrating maintenance of the tumor microenvironment (Fig. 1B). Immunohistochemical staining for the hypoxia‐inducible factor (HIF)‐1α showed no evidence of hypoxia in PDEs cultured using the sponge method (Fig. 1C). Importantly, equivalent HIF‐1α staining was observed in prostate tumors cultured in three independent laboratories (Fig. 1C) and evaluation of serial sections of individual tissues indicated no discernible difference in histology or antigen staining between the air or sponge interface (data not shown).
The AR and ERα are critical drivers of prostate and breast cancer, respectively; therefore, AR and ERα were assessed as examples of major oncogenic signaling pathways in the PDE model. Epithelial cell positivity for immunoreactive AR and ERα was sustained within malignant prostate and breast PDEs, respectively, for up to 6 days in complete media (Fig. 1D). Expression of the androgen‐regulated protein, PSA, and the estrogen‐regulated protein PGR, indicative of functional signaling by AR and ERα, respectively, was also evident after 6 days of culture (Fig. 1D).
3.2. Proliferative capacity of PDE tumor tissue
Cellular uptake of the thymidine analog 5‐bromo‐2‐deoxyuridine (BrdU; Fig. 2A) and its nucleoside analog 5‐ethynyl‐2′‐deoxyuridine (Fig. S1) from the culture media was observed in a subset of prostate tumors, indicating that cultured tissues have the capacity for de novo proliferation. BrdU uptake was evident throughout the PDE samples (Fig. 2A) and was concordant with Ki67 positivity (Fig. 2B). Ki67 positivity in breast and prostate explant tissues was investigated further to assess suitability of the PDE model to evaluate proliferative responses to hormonal stimuli, growth factors, or therapeutic agents. The number of Ki67‐positive epithelial cell nuclei (i.e., the cellular proliferative index) in Day 0 tissues ranged from 0 to 16% and increased to a range of 0 to 43% (P < 0.05) in matched tissues after 48 h of culture and remained stable for at least 96 h (Fig. 2C). The time‐dependent increase in proliferation observed here and in previous organotypic culture models (Nevalainen et al., 1993; Olbina et al., 1998) is likely due to growth‐promoting factors in the media or to the release of an inhibitory serum influence that was present in vivo, but absent ex vivo.
Figure 2.

Proliferative capacity of PDEs. (A) De novo proliferation of tumor cells in PDE cultured tissues is demonstrated by BrdU uptake in a representative prostate cancer explant. (B) The distribution of BrdU uptake is similar to expression of the proliferative marker Ki67 as shown in a representative prostate cancer PDE. (C) Representative images and quantitation of Ki67 immunostaining in prostate (n = 9) and breast (n = 8) tissue at Day 0 and in PDEs cultured for up to 96 h in complete media. *ANOVA: Day 0 versus time points, P = 0.0007 for prostate; P = 0.0013 for breast. All scale bars represent 50 μm.
3.3. Modulation of AR signaling in prostate cancer PDEs
AR is the driving transcription factor in prostate cancer and the primary therapeutic target for systemic treatment. To demonstrate modulation of this critical signaling pathway, a lentiviral‐based shRNA approach was used for isogenic suppression of AR gene expression. Lentiviral transduction of cultured prostate PDEs with an AR‐directed shRNA for 48 h decreased the steady‐state protein levels of AR by approximately 50% (Fig. 3A). Importantly, AR inhibition resulted in a 40% decrease in expression of the AR‐regulated protein PSA (Fig. 3A), which demonstrates that the AR signaling pathway is functional in PDE tissues.
Figure 3.

Modulation of AR signaling in prostate cancer PDEs. (A) Steady‐state protein levels of AR and the AR‐regulated protein PSA were knocked down in prostate cancer PDEs (n = 3) cultured in media containing lentiviral‐based shRNA directed against AR (shAR) compared with scrambled control (shCON). Scale bars represent 50 μm. (B) Quantitation and representative images of Ki67 immunostaining in PDEs derived from 23 patients following 48 h culture with vehicle control or bicalutamide (10 μm). A response to bicalutamide was considered significant when treatment induced a change from vehicle of ≥ 25%. Scale bars represent 50 μm. (C) Quantitation and representative images of cleaved caspase‐3 immunostaining in PDEs derived from 23 patients following 48‐h culture with vehicle control or bicalutamide (10 μm). Data are presented as mean ± SEM. Scale bars represent 50 μm. (D) Water fall plot of percent change in PSA gene expression and Ki67 immunostaining from a subset of PDEs from (A) treated with vehicle control or bicalutamide (n = 12). (E) Scatterplot of the data from D showing a positive correlation between Ki67 and PSA with Spearman's r = 0.657 (P < 0.05). (F) Heat map visualization of qRT‐PCR analysis of classic AR‐regulated transcripts in bicalutamide‐treated PDEs compared to vehicle (n = 12).
Clinical inhibition of the AR signaling pathway is achieved through androgen deprivation therapy or AR antagonists (Attard et al., 2011). To demonstrate capacity of the PDE model for evaluating therapeutics, prostate cancer PDEs were treated with the clinically used AR antagonist bicalutamide. Proliferative response was assessed using the immunohistochemistry marker Ki67, with a response considered significant when treatment induced a change from vehicle of ≥ 25%. Proliferative responses were observed after only 48 h of culture; therefore, this time point was selected to allow short‐term, high‐throughput preclinical testing to be performed. Similar to Fig. 2C, a large range of baseline Ki67 (2‐58%) was observed across the cohort (Fig. 3B). In prostate cancer PDEs cultured in the presence of 10 μm bicalutamide for 48 h, the proliferative index was reduced in 10/23 tissues (44%), increased in 6/23 tissues (26%), and had no significant effect on proliferation in 7/23 tissues (30%) compared to vehicle‐treated PDEs (Fig. 3B). Similar heterogeneity in response was observed with the newer generation antagonist enzalutamide in a smaller, independent cohort of PDEs (Fig. S2). A change in apoptosis was not observed in PDEs cultured for 48 h with 10 μm bicalutamide (Fig. 3C). Collectively, these findings illustrate the heterogeneity of clinical samples and demonstrate the importance of using a model that reflects this natural variation when evaluating solid tumors. A critical aspect of this research will be relating the observed heterogeneity with clinical outcomes of these patients, but we were unable to assess this in the current study. To date, only one patient (Fig. 3A patient no. 18) from our cohort of predominantly low‐to‐intermediate risk patients (median follow‐up time of 48.3 months; range 23–64.4 months) has experienced biochemical recurrence (BCR). This is consistent with the reported 5‐year BCR rate of 10–20% in low‐to‐intermediate risk patients undergoing robotic‐radical prostatectomy (Diaz et al., 2015) and highlights the need for longer‐term follow‐up to correlate PDE results with individual patient outcomes. A more feasible clinical context to ascertain whether PDE culture is correlated with clinical outcome is neoadjuvant clinical trials that allow direct comparison of pre‐ and post‐treated tumors.
In a subset of 12 PDEs from Fig. 3B, where sufficient matched tissue was available to extract RNA, changes in PSA gene expression in response to bicalutamide treatment were evaluated by qPCR. Similar to Ki67, heterogeneity in PSA response to bicalutamide was observed across the 12 explants (Fig. 3D). Importantly, in 10/12 tissues Ki67 positivity and PSA expression increased or decreased concordantly, demonstrating a significant positive association (r = 0.657; P = 0.0238; Fig. 3E). Transcript analysis of additional prototypical AR‐regulated genes FKBP5, KLK2, NKX3.1, and TMPRSS2 shows a similar pattern of expression to PSA and Ki67 (Fig. 3E), indicating general inhibition of androgen signaling by bicalutamide in prostate cancer PDEs. No correlation was observed between proliferative response and tumor grade, stage, or presurgery serum PSA. However, we acknowledge that a larger range of samples may be required to determine this conclusively as the majority of our specimens were of Gleason grade 7, stage PT3A/B, and PSA < 10 (Table S1).
3.4. Analysis of ERα signaling in breast cancer explants
Estradiol (E2)‐activated ERα binds to cis‐regulatory elements of target genes such as the PGR (Ross‐Innes et al., 2012). Candidate gene analyses performed on RNA extracted from ERα‐positive PDEs (n = 14) cultured for 24 h with E2 revealed a range of responses to hormone treatment. E2 stimulation decreased PGR expression by ≥ 50% in 6/14 tissues (43%), increased PGR expression by ≥ 50% in 5/14 tissues (36%), and had no significant effect on PGR in 3/14 tissues (21%) compared to the matched vehicle controls (Fig. 4A). To further investigate ERα signaling, we used ChIP‐seq to evaluate E2‐treated breast cancer PDEs and compared whole‐genome ERα binding events with primary breast cancer tissues and traditional breast cancer models, including the most commonly used ERα‐positive breast cancer cell line, MCF7, grown in vitro or in vivo as xenografts. Figure 4B depicts an example ERα binding site shared by all models [retinoic acid receptor‐α (RARA)], a binding site identified in patient‐derived tissues only (SLCO5A1), and binding sites identified in cell line models only (50 kb to TOB1/SPAG9). These findings clearly highlight how cell line models do not accurately represent clinical breast cancer and the importance of utilizing tissue‐based models for interrogation of mechanisms of carcinogenesis.
Figure 4.
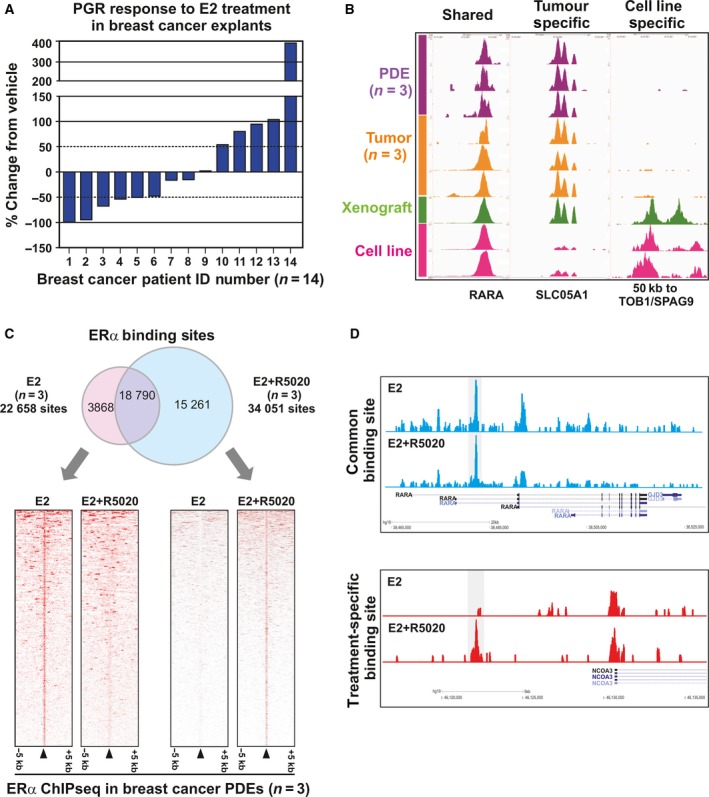
Modulation of ERα signaling in breast cancer PDEs. (A) qPCR analysis of PGR expression shows differential response to 10 nm E2 in breast cancer PDEs (n = 14). Samples with ≥ 50% change compared to vehicle were considered responsive. Data are presented as the mean ± SEM. (B) ChIP‐sequencing analysis of ERα binding sites in breast cancer PDEs (n = 3), untreated primary breast cancers (n = 3), an in vivo xenograft tumor grown from the ERα‐positive MCF7 cell line, and MCF7 cells cultured in vitro (n = 2). Shown are examples of ERα binding events that are shared by all models (RARA), present only in in vivo models (SLCO5A1) or present only in cell line models (TOB1/SPAG9). (C) Venn diagram showing the overlap of ERα binding sites identified in PDEs treated with E2 or E2+ R5020. Only ChIP‐seq peaks identified in at least two tumors were considered included. Heat map of treatment‐specific binding events from the Venn diagram. Data were centered at the top of the peak and visualized with a 5‐kb window around the peak. (D) ERα ChIP‐seq binding sites identified in E2− or E2+ R5020‐treated breast cancer PDEs. Examples of common binding sites (upper panel) and treatment‐specific binding (lower panel) sites are shown.
We have previously shown that PGR is not only an ERα‐target gene but is also an ERα‐associated protein that can reprogram ERα DNA binding and transcriptional responses in breast cancer and, importantly, used the PDE model to study the transcriptome and growth effects of this ERα reprogramming by PGR (Mohammed et al., 2015; Singhal et al., 2016). To further investigate these findings, herein we report successful ERα ChIP‐seq in ERα‐positive breast cancer PDEs cultured with E2 in the presence or absence of synthetic PGR agonist R5020. The number of ERα binding events in each E2‐treated and E2 + R5020‐treated PDE is shown in Table S4. ERα binding could be mapped in all PDEs, but total peak intensity and the number of identified binding events differed between PDEs and treatments. To systematically quantify these observations, consensus ERα chromatin binding sites were compiled for each treatment by including peaks found in at least two of the three cases. Under estrogenic conditions alone, there were a total of 22 658 consensus ERα binding sites, and under estrogenic conditions with R5020 supplementation, there were a total of 34 051 consensus sites, with 18 790 shared sites between the two conditions (Fig. 4C). Further 3868 and 15 261 ERα binding sites were identified to be specific to either estrogen alone or estrogen plus R5020 treatment, respectively (Fig. 4C). Representative images of ERα chromatin binding at the RARA‐positive control locus demonstrate robust peaks common to both treatment conditions (Fig. 4D, upper panel), as well as binding peaks specific to individual hormone treatments, such as those observed 10 kb upstream of the nuclear receptor coactivator 3 (NCOA3) locus (Fig. 4D, lower panel).
4. Discussion
Patient‐derived explant tissue culture on a gelatin scaffold retains many features of human solid tumors, including the native microenvironment and cellular interactions that are critical for carcinogenesis but are lacking in many preclinical models. This study demonstrates that PDEs are not only viable in culture but can be manipulated using hormones, siRNA, or cancer drugs and that the response to those interventions can be assessed using an array of techniques, including immunohistochemistry, real‐time qRT‐PCR, and genomewide molecular analyses of cistromes. The PDE method is robust, as shown through observations of sustained tissue morphology, viability, and maintenance of critical cancer‐related signaling pathways in independent laboratories. It is also applicable to multiple solid tumor types; to date, the methodology has successfully been applied to all cancers tested, including some not represented in the current study (ovary, endometrium, renal, sarcoma; personal communication). The de novo cellular proliferation observed in cultured tissues indicates that the system is not static and makes this a particularly useful model to assess the growth inhibitory activity of new or emerging therapeutic agents, as demonstrated by our respective teams using PDEs from prostate cancer and breast cancer (Centenera et al., 2012; Comstock et al., 2013; Dean et al., 2012; de Leeuw et al., 2015; Schiewer et al., 2012).
One of the most exciting aspects of the PDE model is the potential to uncover information about the diversity of tumor biology that is not possible using cell lines or cell line xenografts due to their clonality. Observed changes in PSA and PGR expression in prostate and breast tumors as markers of AR and ERα signaling, respectively, reflected the natural tumor heterogeneity observed clinically for each tumor type examined (Arnedos et al., 2013). Variation in PSA response to bicalutamide, the most common antagonist used in locally advanced disease (Heidenreich et al., 2014), in prostate PDEs is consistent with outcomes of the TERRAIN and STRIVE clinical trials. As an AR antagonist, bicalutamide inhibits expression of AR‐regulated genes such as PSA, as well as genes involved in cellular proliferation, differentiation, and survival (Furr, 1996; Maucher and von Angerer, 1993). In TERRAIN and STRIVE, a serum PSA decline of ≥ 50% from baseline was achieved in 31% and 21% of bicalutamide‐treated patients, respectively (Penson et al., 2016; Shore et al., 2016). In our cohort of PDEs treated with bicalutamide, a similar rate of PSA decline was observed, with 25% of PDEs showing ≥ 50% decrease in PSA gene expression compared with vehicle treatment. PSA increase from baseline was also observed in a subset of patients in both clinical trials, which was again similar to our results where PSA increased ≥ 50% compared with vehicle treatment in 16% of cases.
Ki67 expression is a measure of cells in the active phase of the cell cycle and is a widely used marker of proliferating cells (Scholzen and Gerdes, 2000). Ki67 proliferative index is an independent predictor of prostate cancer outcomes (Fisher et al., 2013; Pollack et al., 2004; Zellweger et al., 2009); however, the wide range of Ki67 expression naturally observed in clinical prostate tumors and a lack of consensus on appropriate cutoff points have prevented utilization of Ki67 as a marker in the clinic (Penault‐Llorca and Radosevic‐Robin, 2017). Similarly, we observed wide variation in baseline Ki67 expression in PDE tissues, reflecting the diverse genetic heterogeneity of prostate tumors (Barbieri et al., 2013). Further, we observed a positive correlation between Ki67 immunostaining and androgen signaling in bicalutamide‐treated PDEs, consistent with the effect of bicalutamide on prostate tumor PDE proliferation being AR‐mediated. Despite observing significant effects of bicalutamide on PDE proliferative index, apoptotic response to bicalutamide was also evaluated, using the immunohistochemistry marker cleaved caspase‐3. We have previously reported apoptosis induction in prostate cancer PDEs cultured for 48 h with other therapeutic agents (Centenera et al., 2012). It is therefore likely that higher doses of bicalutamide than the 10 μm used in this study are required to induce apoptosis in prostate cancer PDEs.
Breast cancer is highly heterogeneous, clustering into 10 different molecular subgroups based on an integrated analysis of genomic aberrations and transcriptional profiling (Curtis et al., 2012). Tumors that express ERα represent the majority (≥ 70%) of all cases (Curtis et al., 2012). Assessment of ERα and PGR status by immunohistochemistry guides treatment decisions for breast cancer, as PGR is an ERα‐regulated gene and used as a biomarker of ERα activation (Lee and Gorski, 1996). We found that ERα signaling is not only sustained in breast cancer PDEs, but that the estrogenic response of ERα‐positive PDEs significantly varies in terms of PGR regulation. Although an established ERα‐regulated gene, PGR expression at the mRNA level can be influenced by factors that modulate the transcriptional activity of ERα (e.g., E2 metabolism, expression of transcriptional cofactors, degree of receptor phosphorylation) or regulate PGR expression independent of ERα (e.g., environmental levels of progesterone, insulin‐like growth factors), reviewed in Ref. (Grimm et al., 2016). Exposure to exogenous hormones through endocrine therapy or menopausal hormone therapy is another factor that affects ERα and PGR status (Ali and Coombes, 2002). Therefore, the heterogeneity we observed is likely representative of individual tissue microenvironments, and the PDE model provides an avenue to more accurately dissect how the tumor setting influences ERα signaling. In support of this concept, we used genomewide profiling of hormone‐treated breast cancer PDEs to capture ERα binding events and demonstrated reprogramming of ERα binding by synthetic progestin R5020, a phenomenon we recently reported using cell line models and clinical samples (Mohammed et al., 2015; Singhal et al., 2016).
Collectively, our data demonstrate the major advantage of the PDE model, which is the capacity for quantitative evaluation and comparison of different pharmacological agents in matched patient material. Traditionally, within‐patient comparisons have only been possible between pre‐ and post‐treatment samples from neoadjuvant studies or through utilization of diagnostic needle biopsies (Beltran et al., 2017). Obtaining this type of material is notoriously difficult without direct access to clinical trials or due to the limited amount of quality tissue available from biopsy after diagnostics are complete. The utilization of clinical material for profiling the genome, transcriptome, and proteome has remarkably advanced our understanding of the molecular features of breast and prostate cancer. The potential now offered by the PDE model is ‐omic analysis of matched treated and untreated samples using the PDE model. Our teams have published transcriptomic and proteomic analysis of PDE tissues (Armstrong et al., 2018; Nguyen et al., 2018; Pishas et al., 2014), and here, we demonstrate the added capacity for cistromics. Expanding the repertoire to include the lipidome, metabolome, kinome, and secretome will provide further critical insight into tumor biology and better define the mechanism of action of pharmaceutical agents preclinically, which will lead to the identification of more clinically relevant therapeutic targets and improved translation of research findings.
Preclinical models that more accurately represent human disease are needed to improve translational cancer research outcomes. The appreciation for patient‐derived models in this context is increasing rapidly in parallel with organoid and PDX techniques. The major difference between explant and organoid culture is that the latter are generated from tumors that are minced and enzymatically digested to dissociate cells for seeding in Matrigel (Gao et al., 2014), whereas explant tissue is cultured in its native format without disruption to the tissue architecture or tumor microenvironment. In this way, explants are more analogous to PDX models but without the significant associated costs, timeframes, and complication of infiltrating mouse stroma (Whittle et al., 2015). Another disadvantage of PDX models is that the take rate is biased toward more aggressive tumors such that engraftment may even be indicative of poor patient outcome (DeRose et al., 2013). The poor take rate of primary tumors means that PDX lines do not necessarily represent all disease states. In contrast, tissues from benign, primary, and advanced disease stages have been successfully cultured using the PDE technique with an extremely high take rate that is dependent on the presence of epithelial cells rather than the aggressiveness of the tumor cells. The PDE method therefore enables rapid, high‐throughput, and cost‐effective analyses of diverse human tumors and disease stages. We propose that incorporation of the PDE model into preclinical drug development programs will facilitate better selection of agents for clinical trials and provide biological insight into key molecular pathways of oncogenesis. The major criterion for implementation of the PDE model is ready access to fresh tissue samples, necessitating a strong collaboration between surgeons, pathologists, and scientists. The reliance on fresh tissue also means that PDEs cannot be passaged or revived from frozen material. What remains to be proven over the longer term is whether this approach can indeed predict in vivo clinical responses and lead to new, more effective cancer treatments or biomarkers of treatment response. Toward this goal, a recent study in non‐small‐cell lung cancer reported a significant correlation between cisplatin sensitivity in ex vivo cultured tissue and patient survival (Karekla et al., 2017). Future neoadjuvant clinical studies comparing pre‐ and post‐treatment tissues to include parallel ex vivo cultures of the pretreatment tumor tissues will validate the PDE model using clinically relevant end points. This will provide an exciting opportunity to investigate novel mechanisms of treatment resistance and identify biomarkers of treatment response that are essential for the realization of personalized cancer medicine.
5. Conclusion
PDE culture of breast and prostate tumors is a high‐throughput and cost‐effective technique that retains the tissue's native architecture, microenvironment, and key oncogenic drivers. This approach allows direct within‐patient comparison to rapidly evaluate efficacy of therapeutic agents in a personalized manner and is amenable to analysis using contemporary molecular technologies.
Author contributions
MMC, SNB, LMB, and WDT developed the culture methodology. MMC, TEH, KEK, GVR, LMB, and WDT designed the study and prepared the manuscript. PDS, SNB, CEH, CGR, and LGG assisted with patient recruitment and clinical information and provided clinical samples. MMC, TEH, NKR, PR, JLK, MJS, CESC, and SM designed and performed experiments. MMC, TEH, HM, JLK, JSC, KEK, GVR, LMB, and WDT were involved in data analysis and interpretation. SJ and KP provided pathological expertise and analysis. All authors discussed results and provided comments on the manuscript.
Supporting information
Table S1. Clinical and pathological characteristics of tumors used in this study.
Table S2. Summary of antibodies and conditions for immunohistochemistry.
Table S3. Primer sequences/Taqman Probe Assay IDs.
Table S4. Number of ER binding peaks identified by Mac Peak caller.
Fig. S1. Representative images of EdU staining in prostate cancer PDEs.
Fig. S2. Quantitation of EdU staining in prostate cancer PDEs.
Acknowledgements
We are grateful to all study participants, nurses, and pathologists who contributed their time and expertise to this project. We wish to thank all the surgeons who generously provided tissues. We also acknowledge the South Australian Coordinator of the Australian Prostate Cancer BioResource, Ms Pamela Saunders, who kindly assisted in the recruitment and collection of patient material and information. This work was supported by grants from the Movember Foundation (MRTA 3 to LMB and WDT), National Health and Medical Research Council of Australia (ID 627185 to LMB and WDT; ID 1008349 to LMB and WDT), Cancer Australia (ID 627229 to LMB and WDT; ID 1085471 to MMC and LMB; ID 1138766 to MMC and LMB), the Prostate Cancer Foundation of Australia (ID 2711 to LMB and MMC), the Royal Adelaide Hospital Research Committee (to MMC, LMB, and WDT), Susan G Komen for the Cure (ID BCTR0504475), the National Breast Cancer Foundation of Australia (ID NC‐12‐21), the Dorothy and James Cleo Thompson Foundation (to GVR), National Institutes of Health (R01 CA116777‐05, R01 CA099996‐09, and R01 ES016675‐11 to KEK), the University of Cambridge Cancer Research UK (to JSC), the European Research Council (to JSC), and the European Molecular Biology Organization (to JSC). The Adelaide Prostate Cancer Centre is supported by an establishment grant from the Prostate Cancer Foundation of Australia (ID 2011/0452). MMC is a Prostate Cancer Foundation of Australia Young Investigator (ID YIG0412). LMB holds a senior research fellowship from the Australian Research Council. TEH holds a Postdoctoral Fellowship from the US Department of Defense Breast Cancer Research Program (W81XWH‐11‐1‐0592). MJS holds a Predoctoral Fellowship from the United States Department of Defense (PC094195).
Contributor Information
Margaret M. Centenera, Email: margaret.centenera@adelaide.edu.au
Wayne D. Tilley, Email: wayne.tilley@adelaide.edu.au
References
- Ali S and Coombes RC (2002) Endocrine‐responsive breast cancer and strategies for combating resistance. Nat Rev Cancer 2, 101–112. [DOI] [PubMed] [Google Scholar]
- Armstrong HK, Gillis JL, Johnson IRD, Nassar ZD, Moldovan M, Levrier C, Sadowski MC, Chin MY, Tomlinson Guns ES, Tarulli G et al (2018) Dysregulated fibronectin trafficking by Hsp90 inhibition restricts prostate cancer cell invasion. Sci Rep 8, 2090. [DOI] [PMC free article] [PubMed] [Google Scholar]
- Arnedos M, Vielh P, Soria JC, Andre F (2013) The genetic complexity of common cancers and the promise of personalized medicine: is there any hope? J Pathol 232, 274–282. [DOI] [PubMed] [Google Scholar]
- Attard G, Richards J and de Bono JS (2011) New strategies in metastatic prostate cancer: targeting the androgen receptor signaling pathway. Clin Cancer Res 17, 1649–1657. [DOI] [PMC free article] [PubMed] [Google Scholar]
- Barbieri CE, Bangma CH, Bjartell A, Catto JW, Culig Z, Gronberg H, Luo J, Visakorpi T and Rubin MA (2013) The mutational landscape of prostate cancer. Eur Urol 64, 567–576. [DOI] [PMC free article] [PubMed] [Google Scholar]
- Beltran H, Wyatt AW, Chedgy EC, Donoghue A, Annala M, Warner EW, Beja K, Sigouros M, Mo F, Fazli L et al (2017) Impact of therapy on genomics and transcriptomics in high‐risk prostate cancer treated with neoadjuvant docetaxel and androgen deprivation therapy. Clin Cancer Res 23, 6802–6811. [DOI] [PMC free article] [PubMed] [Google Scholar]
- Centenera MM, Gillis JL, Hanson A, Jindal S, Taylor RA, Risbridger G, Sutherland PD, Scher HI, Raj GV, Knudsen KE et al (2012) Evidence for efficacy of new Hsp90 inhibitors revealed by ex vivo culture of human prostate tumors. Clin Cancer Res 18, 3562–3570. [DOI] [PubMed] [Google Scholar]
- Centenera MM, Raj GV, Knudsen KE, Tilley WD, Butler LM (2013) Ex vivo culture of human prostate tissue and drug development. Nat Rev Urol 10, 483–487. [DOI] [PubMed] [Google Scholar]
- Comstock CE, Augello MA, Goodwin JF, de Leeuw R, Schiewer MJ, Ostrander WF Jr, Burkhart RA, McClendon AK, McCue PA, Trabulsi EJ et al (2013) Targeting cell cycle and hormone receptor pathways in cancer. Oncogene 32, 5481–5491. [DOI] [PMC free article] [PubMed] [Google Scholar]
- Curtis C, Shah SP, Chin SF, Turashvili G, Rueda OM, Dunning MJ, Speed D, Lynch AG, Samarajiwa S, Yuan Y et al (2012) The genomic and transcriptomic architecture of 2,000 breast tumours reveals novel subgroups. Nature 486, 346–352. [DOI] [PMC free article] [PubMed] [Google Scholar]
- Dean JL, McClendon AK, Hickey TE, Butler LM, Tilley WD, Witkiewicz AK and Knudsen ES (2012) Therapeutic response to CDK4/6 inhibition in breast cancer defined by ex vivo analyses of human tumors. Cell Cycle 11, 2756–2761. [DOI] [PMC free article] [PubMed] [Google Scholar]
- DeRose YS, Gligorich KM, Wang G, Georgelas A, Bowman P, Courdy SJ, Welm AL and Welm BE (2013) Patient‐derived models of human breast cancer: protocols for in vitro and in vivo applications in tumor biology and translational medicine. Curr Protoc Pharmacol Chapter 14, Unit14 23. [DOI] [PMC free article] [PubMed] [Google Scholar]
- Diaz M, Peabody JO, Kapoor V, Sammon J, Rogers CG, Stricker H, Lane Z, Gupta N, Bhandari M and Menon M (2015) Oncologic outcomes at 10 years following robotic radical prostatectomy. Eur Urol 67, 1168–1176. [DOI] [PubMed] [Google Scholar]
- Drost J, Karthaus WR, Gao D, Driehuis E, Sawyers CL, Chen Y and Clevers H (2016) Organoid culture systems for prostate epithelial and cancer tissue. Nat Protoc 11, 347–358. [DOI] [PMC free article] [PubMed] [Google Scholar]
- Ferrosan (2014). Surgifoam Absorbable Gelatin Sponge. u.S.P., Soeborg, Denmark. [Google Scholar]
- Fisher G, Yang ZH, Kudahetti S, Moller H, Scardino P, Cuzick J, Berney DM and Transatlantic Prostate G (2013) Prognostic value of Ki‐67 for prostate cancer death in a conservatively managed cohort. Br J Cancer 108, 271–277. [DOI] [PMC free article] [PubMed] [Google Scholar]
- Furr BJ (1996) The development of Casodex (bicalutamide): preclinical studies. Eur Urol 29(Suppl 2), 83–95. [DOI] [PubMed] [Google Scholar]
- Gao D, Vela I, Sboner A, Iaquinta PJ, Karthaus WR, Gopalan A, Dowling C, Wanjala JN, Undvall EA, Arora VK et al (2014) Organoid cultures derived from patients with advanced prostate cancer. Cell 159, 176–187. [DOI] [PMC free article] [PubMed] [Google Scholar]
- Grimm SL, Hartig SM and Edwards DP (2016) Progesterone receptor signaling mechanisms. J Mol Biol 428, 3831–3849. [DOI] [PubMed] [Google Scholar]
- Heidenreich A, Bastian PJ, Bellmunt J, Bolla M, Joniau S, van der Kwast T, Mason M, Matveev V, Wiegel T, Zattoni F et al (2014) EAU guidelines on prostate cancer. Part II: Treatment of advanced, relapsing, and castration‐resistant prostate cancer. Eur Urol 65, 467–479. [DOI] [PubMed] [Google Scholar]
- Karekla E, Liao WJ, Sharp B, Pugh J, Reid H, Quesne JL, Moore D, Pritchard C, MacFarlane M and Pringle JH (2017) Ex vivo explant cultures of non‐small cell lung carcinoma enable evaluation of primary tumor responses to anticancer therapy. Cancer Res 77, 2029–2039. [DOI] [PubMed] [Google Scholar]
- Kim JB (2005) Three‐dimensional tissue culture models in cancer biology. Semin Cancer Biol 15, 365–377. [DOI] [PubMed] [Google Scholar]
- Lawrence MG, Taylor RA, Toivanen R, Pedersen J, Norden S, Pook DW, Frydenberg M, Australian Cancer Prostate B , Papargiris MM, Niranjan B et al (2013) A preclinical xenograft model of prostate cancer using human tumors. Nat Protoc 8, 836–848. [DOI] [PubMed] [Google Scholar]
- Lee YJ and Gorski J (1996) Estrogen‐induced transcription of the progesterone receptor gene does not parallel estrogen receptor occupancy. Proc Natl Acad Sci USA 93, 15180–15184. [DOI] [PMC free article] [PubMed] [Google Scholar]
- de Leeuw R, Berman‐Booty LD, Schiewer MJ, Ciment SJ, Den RB, Dicker AP, Kelly WK, Trabulsi EJ, Lallas CD, Gomella LG et al (2015) Novel actions of next‐generation taxanes benefit advanced stages of prostate cancer. Clin Cancer Res 21, 795–807. [DOI] [PMC free article] [PubMed] [Google Scholar]
- Li H and Durbin R (2009) Fast and accurate short read alignment with Burrows‐Wheeler transform. Bioinformatics 25, 1754–1760. [DOI] [PMC free article] [PubMed] [Google Scholar]
- Maucher A and von Angerer E (1993) Antiproliferative activity of casodex (ICI 176.334) in hormone‐dependent tumours. J Cancer Res Clin Oncol 119, 669–674. [DOI] [PMC free article] [PubMed] [Google Scholar]
- Mohammed H, Russell IA, Stark R, Rueda OM, Hickey TE, Tarulli GA, Serandour AA, Birrell SN, Bruna A, Saadi A et al (2015) Progesterone receptor modulates ERalpha action in breast cancer. Nature 523, 313–317. [DOI] [PMC free article] [PubMed] [Google Scholar]
- Nevalainen MT, Harkonen PL, Valve EM, Ping W, Nurmi M and Martikainen PM (1993) Hormone regulation of human prostate in organ culture. Cancer Res 53, 5199–5207. [PubMed] [Google Scholar]
- Nguyen EV, Centenera MM, Moldovan M, Das R, Irani S, Vincent AD, Chan H, Horvath LG, Lynn DJ, Daly R et al (2018) Identification of novel response and predictive biomarkers to Hsp90 inhibitors through mass spectrometry‐based proteomic profiling of patient‐derived prostate tumor explants. Mol Cell Proteomics 10.1074/mcp.RA118.000633. [Epub ahead of print] [DOI] [PMC free article] [PubMed] [Google Scholar]
- Olbina G, Miljkovic D, Hoffman RM and Geller J (1998) New sensitive discovery histoculture model for growth‐inhibition studies in prostate cancer and BPH. Prostate 37, 126–129. [DOI] [PubMed] [Google Scholar]
- Penault‐Llorca F, Radosevic‐Robin N (2017) Ki67 assessment in breast cancer: an update. Pathology 49, 166–171. [DOI] [PubMed] [Google Scholar]
- Penson DF, Armstrong AJ, Concepcion R, Agarwal N, Olsson C, Karsh L, Dunshee C, Wang F, Wu K, Krivoshik A et al (2016) Enzalutamide versus bicalutamide in castration‐resistant prostate cancer: the STRIVE trial. J Clin Oncol 34, 2098–2106. [DOI] [PubMed] [Google Scholar]
- Pishas KI, Neuhaus SJ, Clayer MT, Schreiber AW, Lawrence DM, Perugini M, Whitfield RJ, Farshid G, Manavis J, Chryssidis S et al (2014) Nutlin‐3a efficacy in sarcoma predicted by transcriptomic and epigenetic profiling. Cancer Res 74, 921–931. [DOI] [PubMed] [Google Scholar]
- Pollack A, DeSilvio M, Khor LY, Li R, Al‐Saleem TI, Hammond ME, Venkatesan V, Lawton CA, Roach M 3rd, Shipley WU et al (2004) Ki‐67 staining is a strong predictor of distant metastasis and mortality for men with prostate cancer treated with radiotherapy plus androgen deprivation: Radiation Therapy Oncology Group Trial 92‐02. J Clin Oncol 22, 2133–2140. [DOI] [PubMed] [Google Scholar]
- Pretlow TG, Yang B and Pretlow TP (1995) Organ culture of benign, aging, and hyperplastic human prostate. Microsc Res Tech 30, 271–281. [DOI] [PubMed] [Google Scholar]
- Risbridger GP, Toivanen R, Taylor RA (2018) Preclinical models of prostate cancer: patient‐derived xenografts, organoids, and other explant models. Cold Spring Harb Perspect Med 10.1101/cshperspect.a030536. [Epub ahead of print] [DOI] [PMC free article] [PubMed] [Google Scholar]
- Ross‐Innes CS, Stark R, Teschendorff AE, Holmes KA, Ali HR, Dunning MJ, Brown GD, Gojis O, Ellis IO, Green AR et al (2012) Differential oestrogen receptor binding is associated with clinical outcome in breast cancer. Nature 481, 389–393. [DOI] [PMC free article] [PubMed] [Google Scholar]
- Schiewer MJ, Goodwin JF, Han S, Brenner JC, Augello MA, Dean JL, Liu F, Planck JL, Ravindranathan P, Chinnaiyan AM et al (2012) Dual roles of PARP‐1 promote cancer growth and progression. Cancer Discov 2, 1134–1149. [DOI] [PMC free article] [PubMed] [Google Scholar]
- Scholzen T and Gerdes J (2000) The Ki‐67 protein: from the known and the unknown. J Cell Physiol 182, 311–322. [DOI] [PubMed] [Google Scholar]
- Shore ND, Chowdhury S, Villers A, Klotz L, Siemens DR, Phung D, van Os S, Hasabou N, Wang F, Bhattacharya S et al (2016) Efficacy and safety of enzalutamide versus bicalutamide for patients with metastatic prostate cancer (TERRAIN): a randomised, double‐blind, phase 2 study. Lancet Oncol 17, 153–163. [DOI] [PubMed] [Google Scholar]
- Singhal H, Greene ME, Tarulli G, Zarnke AL, Bourgo RJ, Laine M, Chang YF, Ma S, Dembo AG, Raj GV et al (2016) Genomic agonism and phenotypic antagonism between estrogen and progesterone receptors in breast cancer. Sci Adv 2, e1501924. [DOI] [PMC free article] [PubMed] [Google Scholar]
- Thompson A, Brennan K, Cox A, Gee J, Harcourt D, Harris A, Harvie M, Holen I, Howell A, Nicholson R et al (2008) Evaluation of the current knowledge limitations in breast cancer research: a gap analysis. Breast Cancer Res 10, R26. [DOI] [PMC free article] [PubMed] [Google Scholar]
- Varani J, Dame MK, Wojno K, Schuger L and Johnson KJ (1999) Characteristics of nonmalignant and malignant human prostate in organ culture. Lab Invest 79, 723–731. [PubMed] [Google Scholar]
- Vescio RA, Connors KM, Kubota T and Hoffman RM (1991) Correlation of histology and drug response of human tumors grown in native‐state three‐dimensional histoculture and in nude mice. Proc Natl Acad Sci USA 88, 5163–5166. [DOI] [PMC free article] [PubMed] [Google Scholar]
- Wang Y, Revelo MP, Sudilovsky D, Cao M, Chen WG, Goetz L, Xue H, Sadar M, Shappell SB, Cunha GR et al (2005) Development and characterization of efficient xenograft models for benign and malignant human prostate tissue. Prostate 64, 149–159. [DOI] [PubMed] [Google Scholar]
- Whittle JR, Lewis MT, Lindeman GJ and Visvader JE (2015) Patient‐derived xenograft models of breast cancer and their predictive power. Breast Cancer Res 17, 17. [DOI] [PMC free article] [PubMed] [Google Scholar]
- Zellweger T, Gunther S, Zlobec I, Savic S, Sauter G, Moch H, Mattarelli G, Eichenberger T, Curschellas E, Rufenacht H et al (2009) Tumour growth fraction measured by immunohistochemical staining of Ki67 is an independent prognostic factor in preoperative prostate biopsies with small‐volume or low‐grade prostate cancer. Int J Cancer 124, 2116–2123. [DOI] [PubMed] [Google Scholar]
- Zhang Y, Liu T, Meyer CA, Eeckhoute J, Johnson DS, Bernstein BE, Nusbaum C, Myers RM, Brown M, Li W et al (2008) Model‐based analysis of ChIP‐Seq (MACS). Genome Biol 9, R137. [DOI] [PMC free article] [PubMed] [Google Scholar]
Associated Data
This section collects any data citations, data availability statements, or supplementary materials included in this article.
Supplementary Materials
Table S1. Clinical and pathological characteristics of tumors used in this study.
Table S2. Summary of antibodies and conditions for immunohistochemistry.
Table S3. Primer sequences/Taqman Probe Assay IDs.
Table S4. Number of ER binding peaks identified by Mac Peak caller.
Fig. S1. Representative images of EdU staining in prostate cancer PDEs.
Fig. S2. Quantitation of EdU staining in prostate cancer PDEs.