Abstract
Integrated studies of accumulated data can be performed to obtain more reliable information and more feasible measures for investigating potential diagnostic biomarkers of gastric cancer (GC) and to explore related molecular mechanisms. This study aimed to identify microRNAs involved in GC by integrating data from The Cancer Genome Atlas (TCGA) and Gene Expression Omnibus. Through our analysis, we identified hsa‐miR‐17 (miR‐17) as a suitable candidate. We performed a meta‐analysis of published studies and analyzed clinical data from TCGA to evaluate the clinical significance and diagnostic value of miR‐17 in GC. miR‐17 was found to be upregulated in GC tissues and exhibited a favorable value in diagnosing GC. In addition, we predicted that 288 target genes of miR‐17 participate in GC‐related pathways. Enrichment of Kyoto Encyclopedia of Genes and Genomes pathway, Gene Ontology analysis, and protein–protein interaction analysis of the 288 target genes of miR‐17 were also performed. Through this study, we identified possible core pathways and genes that may play an important role in GC. The possible core pathways include the cAMP, phosphoinositide‐3‐kinase–Akt, Rap1, and mitogen‐activated protein kinase signaling pathways. miR‐17 may be involved in several biological processes, including DNA template transcription, the regulation of transcription from RNA polymerase II promoters, and cell adhesion. In addition, cellular components (such as cytoplasm and plasma membrane) and molecular functions (such as protein binding and metal ion binding) also seemed to be regulated by miR‐17.
Keywords: biomarker, gastric cancer, gene expression omnibus, meta‐analysis, microRNA‐17, TCGA
Abbreviations
- AUC
area under the curve
- DAVID
database for annotation, visualization, and integrated discovery
- DEM
differentially expressed miRNA
- GC
gastric cancer
- GEO
gene expression omnibus
- GO
Gene Ontology
- KEGG
Kyoto Encyclopedia of Genes and Genomes
- miR‐17
hsa‐miR‐17
- miRNA
microRNA
- PPI
protein–protein interaction
- ROC
receiver operating characteristic
- RPM
reads per million
- SMD
standard mean difference
- SNR
signal‐to‐noise ratio
- SROC
summary receiver operating characteristic
- TCGA
The Cancer Genome Atlas
Gastric cancer (GC) ranks as the second most frequent cancer and is the second leading cause of cancer‐related death, following lung and bronchus cancer, in China 1. The definite clinical diagnosis depends on upper‐abdominal endoscopy with biopsy and cytological examination, with a diagnostic accuracy of approximately 95–99% for both types of GC 2. Nevertheless, limited methods exist for screening, early diagnosis, and recurrence monitoring with reduced discomfort and increased detection rate. Even the most prevalent blood biomarkers for gastrointestinal tumors, such as CEA, CA19‐9, and CA72‐4, often disappoint clinicians and GC patients because their positive detection rate is no more than 41% 3. It is well known that GC tumorigenesis, progression, and metastasis are highly related to dysregulated gene expression. Thus, identifying genes that are differentially expressed at the DNA and RNA levels between tumor and normal tissues may benefit the diagnosis, prognosis, and prediction of GC and help elucidate the molecular mechanisms underlying oncogenesis and therapeutic strategies 4, 5.
MicroRNAs (miRNAs) are small, noncoding RNAs that are 21–24 nucleotides in length and participate in post‐transcriptional regulation by binding to the 3′ untranslated regions of target genes, along with 5′ untranslated regions and coding sequences, leading to translational inhibition and cytoplasmic degradation 6, 7, 8. The aberrant expression of miRNAs is involved in multiple diseases, including various types of cancers. With advancements in research, miRNA‐mediated regulatory networks such as miRNAs–lncRNA–mRNA, miRNAs–circRNA–mRNA, and miRNA–mRNA–miRNA have been gradually used to elucidate the complicated molecular mechanisms underlying tumorigenesis, disease progression, invasion, and metastasis 9, 10, 11, 12, 13. In the past few years, studies in many fields have focused on the utilization of miRNAs in GC, ranging from diagnosis to therapies 14, 15. Accumulated knowledge has provided abundant resources for integrated studies to obtain more reliable information and more feasible measures in the field of medicine. In recent years, microarrays and sequencing technology have been extensively used as efficient tools for the identification of differentially expressed miRNAs (DEMs). Some widely available open access databases include The Cancer Genome Atlas (TCGA) and the Gene Expression Omnibus (GEO). Through searching the TCGA and GEO databases, we identified hsa‐miR‐17 (miR‐17) as a promising candidate for the diagnosis of GC and explored the associated molecular mechanism. Hence, this study aimed to comprehensively investigate the clinical significance and diagnostic value of miR‐17 in GC via meta‐analysis based on the two databases, the literature, and bioinformatics analysis.
Materials and methods
miRNA‐seq data from TCGA database
Publicly available miRNA‐seq data on miRNA levels in GC samples were directly downloaded from TCGA data portal (http://cancergenome.nih.gov/) with file filters [Transcriptome Profiling (Data Category), miRNA Expression Quantification (Data Type), miRNA‐Seq (Experimental Strategy)], and case filters [TCGA‐STAD (Project)] on 12 December 2017. The corresponding clinical data were downloaded using Xena (http://xena.ucsc.edu/) from TCGA database. There were 491 files with a total of 436 stomach adenocarcinoma (STAD) samples. Furthermore, 41 cases had miRNA‐seq data from matched adjacent normal gastric mucosal tissues, whereas another 24 cases lacked pathological staging information. Finally, the miRNA‐seq data for 412 GC samples and 41 normal stomach mucosal samples were obtained for further analysis. Reads per million (RPM) values were extracted for 1882 mapped miRNAs in each sample. In addition, we cleaned the data using Python. DEMs between GC samples with pathological stages I–IV and normal stomach control samples were identified by calculating the fold change (FC) (|log2(FC)| > 1 and P < 0.05) with the r package deseq. One‐way analysis of variance or Student's t‐test was used to analyze the relationship between the relative miRNA expression levels and clinical characteristics with spss statistics version 20.0 (IBM Corp., Armonk, NY, USA). P < 0.05 was considered statistically significant.
Microarray profiles from the GEO database
Microarray profiles (up to 11 January 2018) related to GC were obtained from the GEO database (http://www.ncbi.nlm.nih.gov/geo/) with the following search strategy: (miR OR miRNA OR microRNA) AND (malignant OR tumor OR tumour OR cancer OR carcinoma OR neoplasm OR neoplasms) AND (gastric OR stomach). The microarrays that met the following criteria were collected: (a) studies including at least 20 samples and (b) examination of miRNA expression in tissues, serum, or blood samples of GC patients. Microarrays that did not provide useful data for analysis were excluded. Finally, 12 GEO datasets, namely GSE93415, GSE78775, GSE63121, GSE54397, GSE26595, GSE33743, GSE30070, GSE28770, GSE85589, GSE59856, GSE61741, and GSE31568, were included in the present study. The DEMs between GC and healthy control samples in each GEO dataset were ranked according to the signal‐to‐noise ratio (SNR) using morpheus (http://software.broadinstitute.org/morpheus/), an online web tool. The top 250 DEMs in each direction were chosen for further analysis. An independent Student's t‐test or a paired t‐test was performed to calculate the difference in the levels of a particular miRNA between GC and healthy control samples. P < 0.05 was considered statistically significant.
Real‐time PCR data of miR‐17‐5p from published studies
A literature search (up to 11 January 2018) was conducted using the following databases: PubMed, Web of Science, EMBASE, and Cochrane. The following search strategy was used: (miR‐17 OR miRNA‐17 OR microRNA‐17 OR miR17 OR miRNA17 OR microRNA17 OR miR 17 OR mirna 17 OR microrna 17) AND (malignant OR cancer OR tumor OR tumour OR neoplasm OR carcinoma OR neoplasms) AND (gastric OR stomach). Eligible studies met the following criteria: (a) the studies were original articles; (b) the studies were on human GC patients; (c) miR‐17‐5p (or miR‐17) expression in GC tissues, serum, or plasma was measured by qRT‐PCR; (d) the required data could be determined or extracted from the original articles; (e) studies with the largest patient sample size were included if the data were published in multiple papers; and (f) the studies were published in English. Studies were excluded if they were published as an abstract, summary, case report, comment letter, review, or editorial. The assessment and selection of eligible studies were performed independently by two authors (G‐FH and Q‐WL). Controversial studies were reassessed by a third author (J‐XY) for consensus, and agreements were reached by discussion. After being carefully reviewed, the required data were extracted from the included studies using getdata graph digitizer version 2.26 (Germany).
Meta‐analysis
The following data were extracted from each included study for meta‐analysis: sample number and the mean ± SD of the GC group and healthy control group, true positivity, false positivity, false negativity, and true negativity. stata 12.0 (StataCorp, College Station, TX, USA) was used to conduct the meta‐analysis. The ‘metan’ module of stata 12.0 was used to determine the standardized mean differences (SMDs) and 95% confidence intervals (CIs) for pooled values. Heterogeneity was evaluated using Cochran's Q (chi‐square test) and the I 2 test. P < 0.1 for the Q test and/or I 2 > 50% were considered to indicate significant heterogeneity. If no obvious heterogeneity was detected, a fixed‐effects model was used. Otherwise, a random‐effects model was used. Additionally, subgroup analyses were performed based on the features of different studies to identify the source of heterogeneity. Publication bias was detected using Deeks's funnel plot asymmetry test. P ≥ 0.05 was considered to indicate the lack of publication bias. The summary receiver operating characteristic (SROC) curve was constructed according to the sensitivity and specificity.
Prediction of miRNA target genes
The prediction of possible miRNA target genes was performed using the following databases: miRTarbase 16, Tarbase v.8 17, Targetscan7.1 18, microT‐CDS 19, RNA22 2.0 20, PicTar‐vet 21, miRDB 22, PolymiRTs 23, miRSystem 24, Targetminer (http://www.isical.ac.in/~bioinfo_miu/targetminer20.htm), miRecord (http://c1.accurascience.com/miRecords/), and miRWalk3.0 (http://129.206.7.150/). Genes overlapping in more than five databases were selected. It should be noted that target genes gained from Tarbase, mirTarBase, miRWalk3.0, and miRecord were experimentally validated. In addition, we identified differently expressed genes related to the pathological stage of GC using LinkedOmic 25, an online web tool based on TCGA, and collected the genes with P < 0.05. Finally, the intersection of miRNA‐related genes and GC‐related ones was included for the bioinformatics analysis.
Integrative bioinformatics analysis
The achieved target genes of miRNAs were pooled for Kyoto Encyclopedia of Genes and Genomes (KEGG) pathway analysis and Gene Ontology (GO) enrichment using Database for Annotation, Visualization and Integrated Discovery (DAVID) (https://david.ncifcrf.gov/). Protein–protein interaction (PPI) networks were constructed using string version 10.5 (http://string-db.org/cgi/input.pl).
Results
miR‐17 at the intersection of the TCGA and GEO datasets for GC
Data for a total of 412 GC patients (266 males and 146 females) and 41 healthy control individuals were obtained from TCGA datasets, and RPM values of 1882 mapped miRNAs of each subject were extracted. The GC patients were divided into the following four groups, according to the pathologic stage: stage I (n = 58), stage II (n = 128), stage III (n = 183), and stage IV (n = 43). We compared the RPM data of 1882 miRNAs between the five groups. In the beginning, we attempted to identify miRNAs that were differentially expressed in all five groups. However, this strategy was not successful, as the intersection of DEMs was zero. Hence, we separately identified the DEMs between the healthy control and stage I–IV groups. The relevant volcano plots are shown in Fig. 1A. The four groups had 189 DEMs in common, including 165 upregulated miRNAs and 24 downregulated miRNAs identified from TCGA database. The corresponding Venn diagram and heat map of 189 DEMs are shown in Fig. 1B,C.
Figure 1.
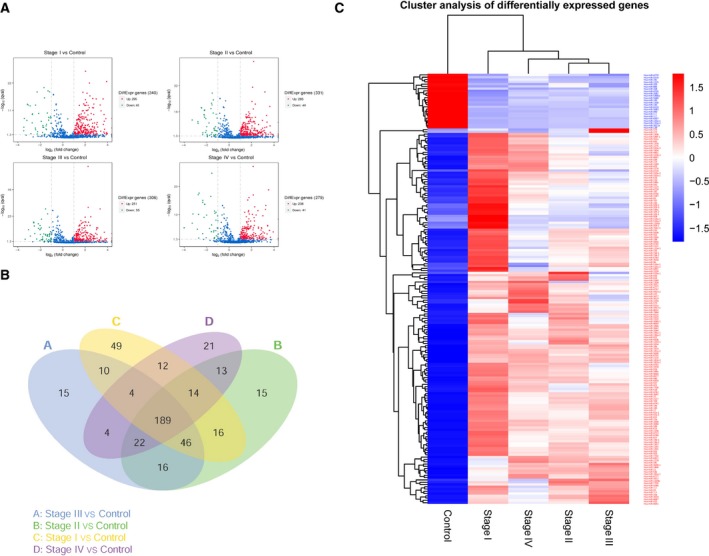
Identification of DEMs in GC based on TCGA database. (A) Volcano plots between healthy controls and the stage I–IV groups in TCGA database. (qval = P value) (B) The corresponding Venn diagram of 189 DEMs. (C) The heat map of 189 DEMs, including 165 upregulated miRNAs and 24 downregulated miRNAs.
We searched the GEO database, and a total of 12 eligible GSE microarrays were included in the present study (Table 1). Because of the differences in sample types of GSE microarrays, the common DEMs were separately examined. Notably, we ignored the differences between the 3p and 5p arms of miRNAs when identifying the DEMs in GSE datasets on account of the names of miRNAs in the TCGA database. miR‐17 was the only miRNA appearing in all of the GSE datasets and the TCGA database. The corresponding Venn diagram is shown in Fig. 2. The 5p and 3p arms of miR‐17 among the top 500 miRNAs in GSE datasets according to the calculated SNR using morpheus are shown in Table 2; miR‐17‐5p and miR‐17‐3p are also known as miR‐17 and miR‐17*, respectively 26, 27. We also searched the literature and found that miR‐17‐5p is more common and significant in GC than is miR‐17‐3p. Thus, we finally focused on miR‐17‐5p.
Table 1.
The relevant basic information and clinical data of 12 eligible GSE microarrays. The differences between the 3p and 5p arms of miRNAs were ignored when identified the DEMs in GSE datasets on account of the names of miRNAs in TCGA database
| Study | Contributors, year | Country | Platform | Gastric cancer (n) | Healthy control (n) | MicroRNAs involved in study (n) | Sample type |
|---|---|---|---|---|---|---|---|
| GSE93415 | Sierzega M et al., 2017 | Poland | GPL19071 | 20 | 20 | 884 | Tissue |
| GSE78775 | Yu B et al., 2016 | China | GPL10850 | 28 | 28 | 851 | Tissue |
| GSE63121 | Zhang X et al., 2014 | China | GPL8786 | 15 | 15 | 847 | Tissue |
| GSE54397 | Chang H et al., 2014 | South Korea | GPL15159 | 16 | 16 | 1205 | Tissue |
| GSE26595 | Lee JS et al. 2013 | South Korea | GPL8179 | 60 | 8 | 359 | Tissue |
| GSE33743 | Carvalho J et al. 2012 | Portugal | GPL14895 | 37 | 4 | 702 | Tissue |
| GSE30070 | Kim CH et al. 2011 | USA | GPL13742 | 90 | 34 | 414 | Tissue |
| GSE28770 | Ahringer J et al. 2011 | USA | GPL9269 | 22 | 22 | 470 | Tissue |
| GSE85589 | Lee J et al., 2016 | South Korea | GPL19117 | 7 | 19 | 825 | Serum |
| GSE59856 | Kojima M et al., 2015 | Japan | GPL18941 | 50 | 150 | 2555 | Serum |
| GSE61741 | Keller A, 2014 | Germany | GPL9040 | 13 | 94 | 848 | blood |
| GSE31568 | Keller A et al., 2011 | Germany | GPL9040 | 13 | 70 | 863 | blood |
Figure 2.

Identification of DEMs. miR‐17 was at the intersection of TCGA and GEO datasets for GC.
Table 2.
5p and 3p arms of hsa‐miR‐17 in the top 500 microRNAs according to SNR, as calculated in morpheus. Hsa‐miR‐17‐5p is also known as hsa‐miR‐17 and Hsa‐miR‐17‐3p is also known as hsa‐miR‐17*
The general flowchart is shown in Fig. 3. The present study is composed of four procedures performed sequentially, that is, the identification of GC‐related DEMs based on TCGA and GEO, the verification of clinical values base on comprehensive meta‐analysis, the prediction of target genes, and multiple bioinformatics analyses.
Figure 3.
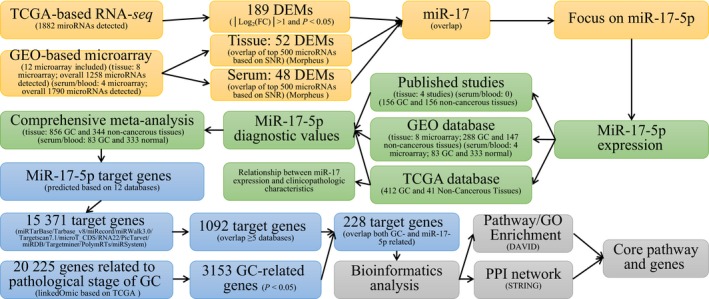
General flowchart. The present study is composed of four procedures performed sequentially: the identification of GC‐related DEMs based on TCGA and GEO datasets, the verification of clinical values based on comprehensive meta‐analysis, the prediction of target genes, and multiple bioinformatics analyses.
miR‐17 expression in GC in TCGA database
The expression level of miR‐17 was higher in the 412 GC tissues of different pathological stages than in the 41 normal gastric mucosal tissues (P < 0.001) (Fig. 4A). The expression level results of miR‐17 for the 41 matched gastric cancer tissues are the same (Fig. 4B,C). The expression of miR‐17 in TCGA data was normalized using the logarithm. Furthermore, we explored the relationship between miR‐17 expression level and clinicopathological characteristics, with the results summarized in Table 3. No significant differences were observed among American Joint Committee on Cancer T, N, M stages, age, and gender. Among GC types, miR‐17 expression level was increased in the tubular and papillary types of intestinal adenocarcinoma and reduced in the diffuse type of adenocarcinoma (P = 0.014; Fig. 4D and Table 3). The P‐value of the diagnostic power in the receiver operating characteristic (ROC) curve was <0.001 (area under the curve (AUC) = 0.857, 95% CI: 0.808–0.905, P < 0.001; Fig. 4E). Additionally, there were no significant differences based on survival analyses (hazard ratio = 1.186, 95% CI: 0.866–1.624, P = 0.289) (Fig. 4F).
Figure 4.
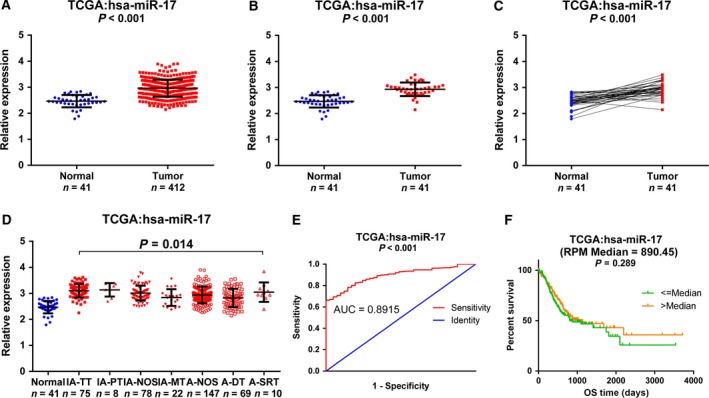
MiR‐17 expression in GC in TCGA database. The expression of miR‐17 in TCGA data was normalized using the logarithm. (A) Comparison of miR‐17 levels in 412 GC tissues and 41 normal gastric mucosal tissues in TCGA data. (B,C) Comparison of miR‐17 levels in 41 pairs of GC tissues and adjacent non‐tumor tissues. (D) Comparison of miR‐17 levels in different histological types of GC tissues. (E) The ROC curve of miR‐17 expression based on TCGA data (AUC = 0.857, 95% CI: 0.808–0.905, P < 0.001). (F) Kaplan–Meier survival curves of miR‐17. A‐DT, adenocarcinoma diffuse type; A‐NOS, adenocarcinoma not otherwise specified; A‐SRT, adenocarcinoma signet ring Type; AUC, area under the curve; IA‐MT, intestinal adenocarcinoma mucinous type; IA‐NOS, intestinal adenocarcinoma not otherwise specified; IA‐PT, intestinal adenocarcinoma papillary type; IA‐TT, intestinal adenocarcinoma tubular type; OS, overall survival.
Table 3.
Relationship between the expression of miR‐17 and clinicopathological features in GC from TCGA. One‐way analysis of variance and Student's paired or unpaired t‐test were used. A‐DT, adenocarcinoma diffuse type; AJCC, American Joint Committee on Cancer; A‐NOS, adenocarcinoma not otherwise specified; A‐SRT, adenocarcinoma signet ring Type; IA‐MT, intestinal adenocarcinoma mucinous type; IA‐NOS, intestinal adenocarcinoma not otherwise specified; IA‐PT, intestinal adenocarcinoma papillary type; IA‐TT, intestinal adenocarcinoma tubular type
| Clinicopathological feature | n | hsa‐miR‐17 expression (RPM) | ||||
|---|---|---|---|---|---|---|
| Mean | SD | t/F | P‐value | |||
| Tissue (unmatched) | Normal | 41 | 333.692 | 159.356 | −5.211 | <0.001 |
| Tumor | 412 | 1224.398 | 1092.287 | |||
| Tissue (matched) | Normal | 41 | 333.692 | 159.356 | −6.591 | <0.001 |
| Tumor | 41 | 1001.995 | 602.321 | |||
| Age (years) | <60 | 124 | 1086.228 | 999.872 | −1.715 | 0.087 |
| ≥60 | 283 | 1288.305 | 1132.681 | |||
| Gender | Male | 266 | 1254.781 | 1148.808 | 0.762 | 0.447 |
| Female | 146 | 1169.042 | 982.366 | |||
| Histological type | IA‐TT | 75 | 1489.868 | 889.374 | 2.695 | 0.014 |
| IA‐PT | 8 | 1559.301 | 723.730 | |||
| IA‐NO | 78 | 1292.949 | 1076.012 | |||
| IA‐MT | 22 | 913.999 | 814.966 | |||
| A‐NOS | 147 | 1165.330 | 1137.682 | |||
| A‐DT | 69 | 918.369 | 770.191 | |||
| A‐SRT | 10 | 1626.048 | 1917.403 | |||
| Pathological stage | I | 58 | 1357.578 | 1038.064 | 1.063 | 0.362 |
| II | 128 | 1122.297 | 835.139 | |||
| III | 183 | 1285.011 | 1259.853 | |||
| IV | 43 | 1090.728 | 1065.495 | |||
| AJCC pathological T | T1 | 21 | 1192.815 | 531.405 | 0.473 | 0.701 |
| T2 | 87 | 1193.633 | 1021.903 | |||
| T3 | 188 | 1179.104 | 865.113 | |||
| T4 | 116 | 1326.595 | 1483.968 | |||
| AJCC pathological N | N0 | 129 | 1232.097 | 932.042 | 0.409 | 0.802 |
| N1 | 109 | 1225.825 | 1224.321 | |||
| N2 | 82 | 1153.218 | 806.988 | |||
| N3 | 86 | 1243.926 | 1343.528 | |||
| Nx | 6 | 1725.801 | 1351.577 | |||
| AJCC pathological M | M0 | 364 | 1221.083 | 1037.290 | 0.259 | 0.772 |
| M1 | 29 | 1160.069 | 1267.692 | |||
| Mx | 19 | 1386.078 | 1734.700 | |||
miR‐17‐5p expression in GC based on the GEO database
A total of 12 GSE datasets, which consisted of 371 GC samples and 480 healthy control samples, were included in the present study (Table 1). Except for GSE31568, the other 11 GEO datasets all contained miR‐17‐5p (Table 2). Interestingly, the expression level of miR‐17‐5p showed different trends in tissues and serum/blood. The expression of miR‐17‐5p was upregulated in five of the eight GEO datasets in which the sample type was tissue (Fig. 5A–H) but downregulated in all three GEO datasets in which the sample type was serum/blood (Fig. 5I–K).
Figure 5.
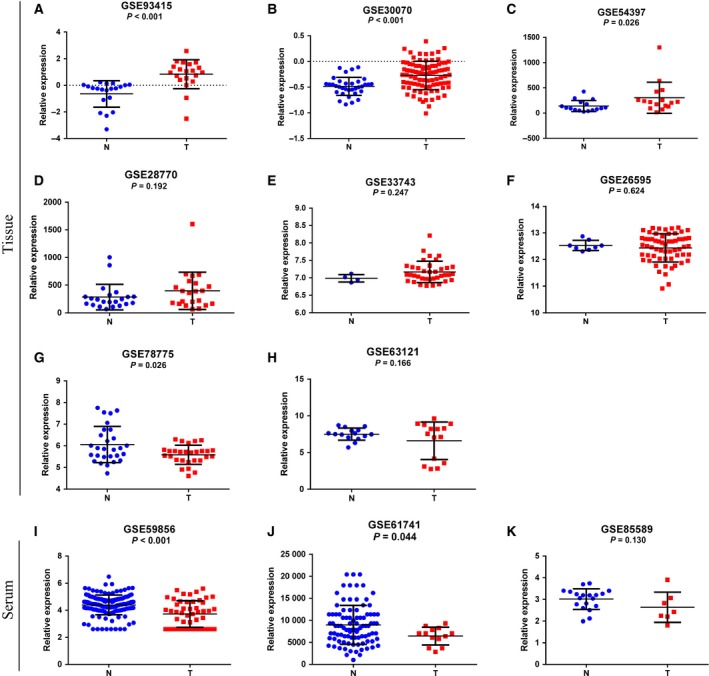
MiR‐17‐5p expression in GC based on the GEO database. (A–H) Expression levels of miR‐17‐5p in GC tissues from the GEO database. (I–K) Expression levels of miR‐17‐5p in GC serum or blood from the GEO database. N, normal gastric mucosal tissues or serum/blood from healthy volunteers; T, tumor tissues or serum/blood from GC patients.
Meta‐analysis of miR‐17‐5p expression in GC
The flowchart for the meta‐analysis is shown in Fig. 6. Regarding the difference in the expression of miR‐17‐5p between GC tissues and adjacent normal gastric mucosal tissues, in addition to the eight GEO datasets (GSE93415, GSE78775, GSE63121, GSE54397, GSE26595, GSE33743, GSE30070, and GSE28770) in which the sample type analyzed was tissue and TCGA database, four additional published studies were included in the meta‐analysis 28, 29, 30, 31. The available data extracted from the original study that were utilized for the meta‐analysis are shown in Table 4. We determined the pooled SMD of miR‐17‐5p to be 0.695 (95% CI: 0.241–1.150, P = 0.003; Fig. 7A) using a random‐effects model. The P‐value of the heterogeneity test was <0.001 (I 2 = 88.8%). No obvious publication bias was observed (Deeks's test: P = 0.257; Fig. 7B). The diagnostic accuracy was evaluated by plotting an SROC and calculating the AUC (AUC = 0.86, 95% CI: 0.82–0.88; Fig. 7C). The pooled sensitivity was 0.69 (95% CI: 0.54–0.80), and the pooled specificity was 0.90 (95% CI: 0.73–0.97). The forest plot of sensitivity and specificity is presented in Fig. 7D,E.
Figure 6.
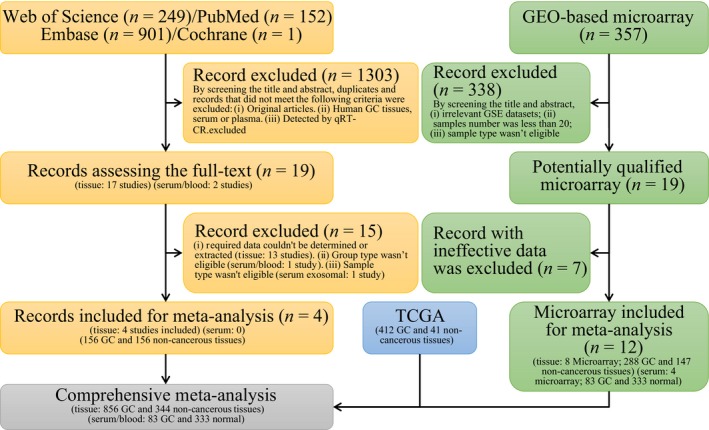
Meta‐analysis flowchart.
Table 4.
Summary of the included studies in the meta‐analysis of miR‐17‐5p expression in GC patient tissues and serum/blood
| Study | GC (n) | hsa‐miR‐17 expression | HC (n) | hsa‐miR‐17 expression | Sample type | Reference | ||
|---|---|---|---|---|---|---|---|---|
| Mean | SD | Mean | SD | |||||
| GSE93415 | 20 | 0.834 | 1.089 | 20 | −0.656 | 0.998 | Tissue | |
| GSE78775 | 28 | 5.590 | 0.441 | 28 | 6.062 | 0.835 | Tissue | |
| GSE63121 | 15 | 6.606 | 2.544 | 15 | 7.507 | 0.819 | Tissue | |
| GSE54397 | 16 | 303.974 | 308.340 | 16 | 140.914 | 110.512 | Tissue | |
| GSE26595 | 60 | 12.437 | 0.531 | 8 | 12.531 | 0.190 | Tissue | |
| GSE33743 | 37 | 7.169 | 0.306 | 4 | 6.986 | 0.108 | Tissue | |
| GSE30070 | 90 | −0.272 | 0.278 | 34 | −0.4851 | 0.178 | Tissue | |
| GSE28770 | 22 | 399.372 | 336.723 | 22 | 285.519 | 229.129 | Tissue | |
| TCGA | 412 | 1224.398 | 1092.287 | 41 | 333.692 | 159.356 | Tissue | |
| Chen et al. | 40 | 1.794 | 0.326 | 40 | 0.916 | 0.239 | Tissue | 31 |
| Zhang et al. | 56 | 2.427 | 1.664 | 56 | 1.605 | 1.601 | Tissue | 30 |
| Wu et al. | 28 | 3.595 | 2.699 | 28 | 2.273 | 2.270 | Tissue | 29 |
| Wang JL et al. | 32 | 1.349 | 0.489 | 32 | 0.649 | 0.489 | Tissue | 28 |
| GSE85589 | 7 | 2.640 | 0.696 | 19 | 3.014 | 0.477 | Serum | |
| GSE59856 | 50 | 3.722 | 0.982 | 150 | 4.393 | 0.730 | Serum | |
| GSE61741 | 13 | 6442.375 | 2017.992 | 94 | 8987.255 | 4418.810 | Blood | |
Figure 7.
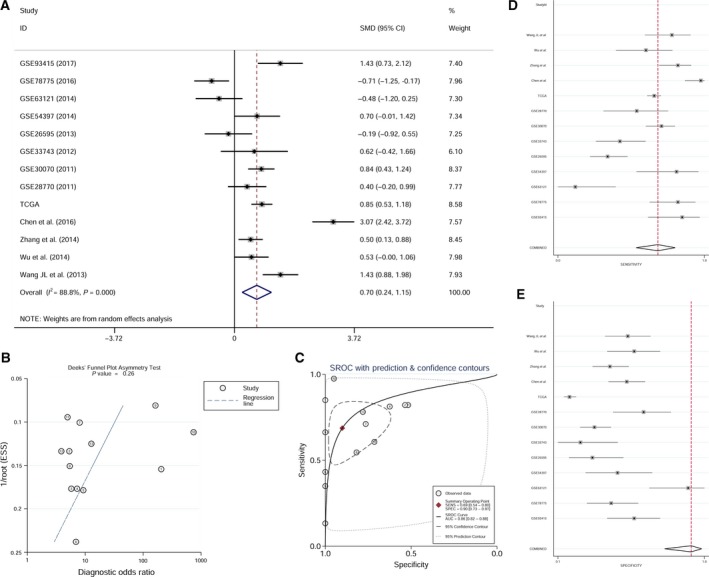
Meta‐analysis of all of the available data of miR‐17‐5p expression level in GC tissues. (A) Forest plot of the meta‐analysis of miR‐17‐5p expression in GC tissues (SMD = 0.695, 95% CI: 0.241–1.150, P = 0.003). (B) Funnel plot of the meta‐analysis of miR‐17‐5p expression in GC tissues (Deeks's test: P = 0.257). (C) SROC curves for miR‐17‐5p in the diagnosis of GC (AUC = 0.86, 95% CI: 0.82–0.88). (D,E) Forest plot of sensitivity and specificity of miR‐17‐5p (pooled sensitivity = 0.69, 95% CI: 0.54–0.80; pooled specificity = 0.90, 95%CI: 0.73–0.97).
Next, we also conducted a meta‐analysis on the expression level of miR‐17‐5p in serum/blood in GC. Because there were no eligible studies and relevant TCGA data, only three GEO datasets (GSE59856, GSE61741, and GSE85589) in which the sample type was serum/blood were included in this meta‐analysis (Table 4). The pooled SMD of miR‐17‐5p was −0.774 (95% CI: −1.048 to −0.5, P < 0.001; Fig. 8A) using a fixed‐effects model. The P‐value of the heterogeneity test was 0.777 (I 2 = 0%). Additionally, the publication bias was not statistically significant (Deeks's test: P = 0.43; Fig. 8B).
Figure 8.
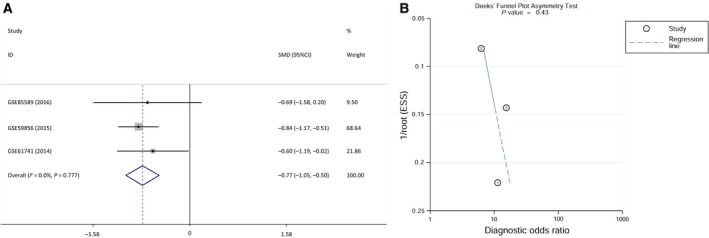
Meta‐analysis of all of the available data for miR‐17‐5p expression levels in GC serum/blood. (A) Forest plot of the meta‐analysis of miR‐17‐5p expression in GC serum/blood (SMD = −0.744, 95% CI: −1.048 to −0.5, P < 0.001). (B) Funnel plot of the meta‐analysis of miR‐17‐5p expression in GC serum/blood (Deeks's test: P = 0.43).
Identification of miR‐17‐5p target genes and bioinformatics analysis
Based on 12 target gene prediction databases and TCGA database, 288 prospective target genes of miR‐17‐5p were included (Fig. 3). According to the KEGG pathway analysis and GO enrichment in DAVID, a total of 33 KEGG pathways, 69 GO terms of biological processes, 28 GO terms of cellular components, and 25 GO terms of molecular function were identified (Fig. 9A–D). The top five KEGG pathway and GO terms are listed in Fig. 10. According to the results of our study, 288 genes were highly concentrated in the cAMP, phosphoinositide‐3‐kinase (PI3K)–Akt, Rap1, mitogen‐activated protein kinase (MAPK) signaling pathways and in pathways involved in cancer (P < 0.05, Fig. 10A and Table S1). In the GO enrichment, the genes were most likely involved in the biological processes of DNA‐templated transcription, the regulation of DNA‐templated transcription, the regulation of transcription from RNA polymerase II promoter and cell adhesion (P < 0.05, Fig. 10B and Table S2), in the cellular components of cytoplasm, plasma membrane, integral component of plasma membrane, actin cytoskeleton, and axon (P < 0.05, Fig. 10C and Table S3), in the molecular functions of protein binding, metal ion binding, transcription factor activity, sequence‐specific DNA binding, zinc binding, and calcium binding (P < 0.05, Fig. 10D and Table S4). The protein–protein interaction (PPI) networks of the 288 target genes are shown in Fig. 11. The top nine hub target genes of miR‐17‐5p with at least five connections in the PPI network were PRKACB, ITGA4, PAFAH1B1, PIK3R1, ESR1, EFNB2, ATP2B1, AKT3, and LAMC1 (Fig. 12).
Figure 9.
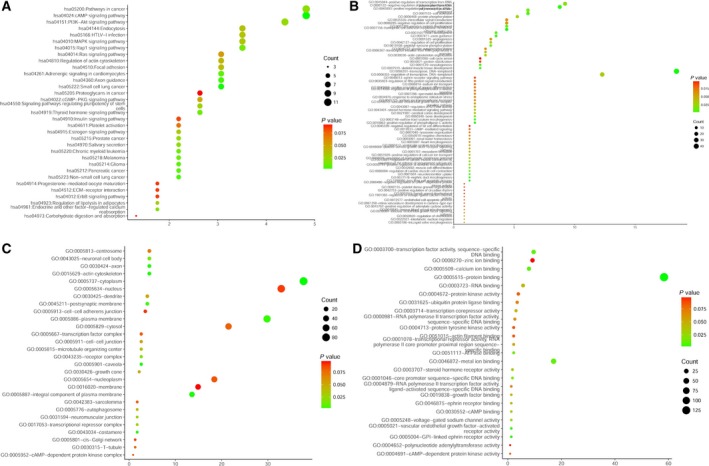
Enriched KEGG pathways and Gene Ontology items of 288 overlapping target genes of miR‐17‐5p. (A) Enriched KEGG pathways. (B) Enriched biological processes. (C) Enriched cellular components. (D) Enriched molecular functions.
Figure 10.
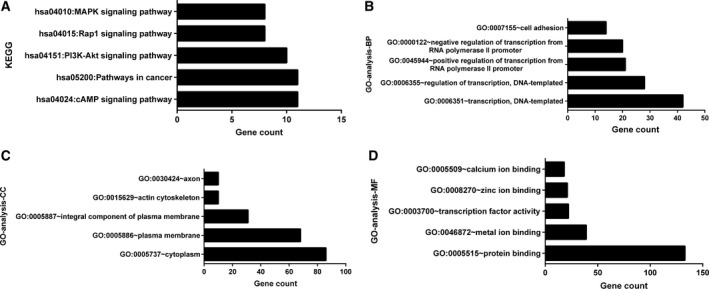
Top five KEGG pathways and GO analysis items. (A) KEGG pathways. (B) Biological processes (BP). (C) Cellular components (CC). (D) Molecular functions (MF).
Figure 11.

Protein–protein interaction networks of the 288 overlapped target genes of miR‐17‐5p.
Figure 12.
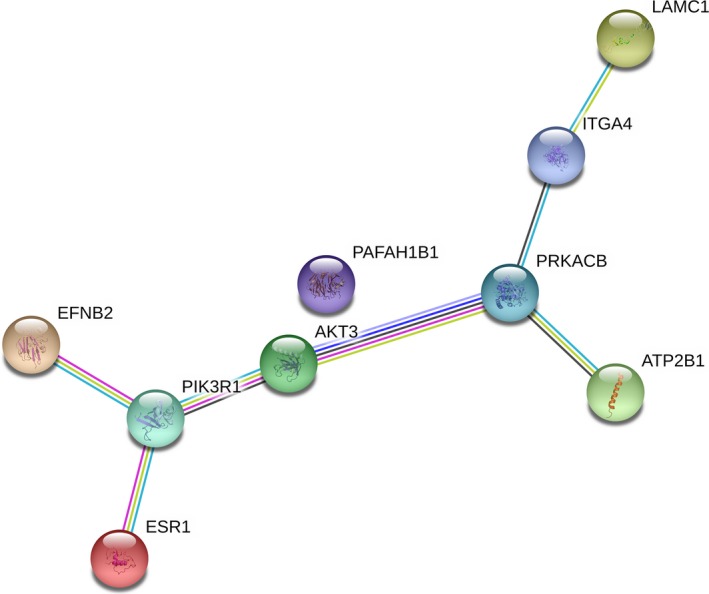
Top nine hub target genes of miR‐17‐5p identified by the PPI network.
Discussion
GC, a fatal disease, has attracted increasing attention from clinicians worldwide because of its high morbidity and mortality rates. Despite advancements in life science and medicine, the achievements in diagnosis, treatment and understanding of the pathology do not yet satisfy the needs of patients for earlier diagnosis and longer survival time. In the present study, we integrated the information from next‐generation sequencing (TCGA) analysis and noncoding RNA profiling by microarray (GEO) in GC. As a promising miRNA candidate, miR‐17‐5p appeared in almost all of the datasets, suggesting that there may be some vital connection between miR‐17‐5p and GC.
miR‐17, as one of members of the miR‐17‐92 cluster, is located in an intron of nonprotein coding gene miR17HG (the miR‐17‐92 cluster host gene) on chromosome 13 in the human genome 32. The miR‐17‐92 cluster, also termed onco‐miR‐1, is upregulated in several types of cancer, such as lung, breast, stomach, prostate, colon, and pancreatic cancers 33. The other members of the miR‐17‐92 cluster (miR‐18a, miR‐19a, miR‐20a, miR‐19b‐1, and miR‐92a) were not present in all of the GEO and TCGA databases except miR‐17 in our study. As reported, upregulated miR‐17‐5p expression levels enhanced pancreatic cancer proliferation by altering cell cycle profiles 34. Low levels of miR‐17 and miR‐20a as a result of single nucleotide polymorphisms at the promoter of the miR‐17‐92 cluster may decrease the risk of colorectal cancer 35. In patients with recurrent breast cancer, miR‐17‐5p is upregulated in tumor tissues and significantly downregulated in serum as one of the exosomal miRNAs 36. In contrast, statistically significant reductions in the levels of miR‐17 and miR‐19a in plasma have been observed between early and advanced stages of breast cancer 37.
With regard to the expression of miR‐17‐5p in GC, the majority of studies considered that this miRNA is upregulated in GC tissues 28, 29, 30, 31, 38, 39, 40. Consistent with those previous studies, the meta‐analysis in our study revealed that miR‐17‐5p was significantly upregulated in GC tumors. A meta‐analysis of the miR‐17‐92 cluster in various cancers, including GC, indicated a poor prognosis in patients with high expression of this cluster 41. Another meta‐analysis identified 23 significantly upregulated miRNAs, including miR‐17, that were correlated with poor prognosis in gastrointestinal cancers 42. However, neither of the meta‐analyses evaluated the expression of miR‐17‐5p separately in GC. In addition, the expression level of miR‐17‐5p in serum/blood in GC remained controversial. The microarray data in the GSE85589, GSE59856, and GSE61741 datasets suggested lower miR‐17‐5p levels in the serum/blood of GC patients than in healthy control individuals. In a study by Zeng et al., the serum levels of miR‐17 were significantly reduced in both GC (n = 40) and benign gastric disease (gastric ulcer and gastric polyp) (n = 32) patients compared with healthy control individuals (n = 36) 43. However, Zhou et al., by analyzing mononuclear cells collected from peripheral blood containing circulating tumor cells, concluded that miR‐17 and miR‐106a levels were significantly higher in preoperative (n = 41) and postoperative (n = 49) GC patients than in healthy volunteers (n = 27) 44. Wang et al. identified four miRNAs, including miR‐17‐5p, in serum‐circulating exosomes from a cohort of 20 healthy control individuals and 20 GC patients; however, according to this study, the upregulated expression of miR‐17‐5p had no statistical significance 45. Furthermore, Tsujiura et al. demonstrated that the plasma concentration of miR‐17‐5p without contamination by cellular nucleic acids was significantly higher in GC patients (n = 69) than in healthy controls (n = 30) 46. According to the results of our two independent meta‐analyses, miR‐17‐5p expression levels were upregulated in GC tissues but downregulated in the serum/blood of GC patients. Our hypothesis is that GC tumorigenesis may have an effect on the extracellular transport of miR‐10‐5p. However, further research is needed to explore possible mechanisms. Notably, serum/blood samples from 70 GC patients and 263 healthy controls, which came from only three independent studies, were included in the meta‐analysis of miR‐17‐7p expression. Thus, although we conducted a meta‐analysis of miR‐17‐5p expression levels in serum/blood in our study, further investigations are required to confirm the relevant results. However, in GC tissues, the increased expression level of miR‐17‐5p, which was verified in our study, still reveals a promising prospect for miR‐17‐5p as a biomarker in GC. The diagnostic accuracy was evaluated and miR‐17 had increased specificity and sensitivity (Fig. 7C–E).
To investigate the underlying molecular mechanism, we performed a comprehensive bioinformatics analysis. According to 12 miRNA target gene prediction databases and the relevant TCGA data, 288 genes were considered for further analysis. Based on KEGG pathway analysis and GO enrichment, several core pathways and GO terms displayed the potential to play a crucial role in GC. Nine hub target genes, namely PRKACB, ITGA4, PAFAH1B1, PIK3R1, ESR1, EFNB2, ATP2B1, AKT3, and LAMC1, may have a close association with the tumorigenesis, disease progression, invasion, and metastasis of GC.
Our study may be the first example of the integration of data from the GEO database, TCGA database, and published literature to investigate the possible differential expression of miRNAs and their potential molecular mechanisms in GC. The study identified some core pathways and genes in GC, which may facilitate the further exploration of mechanisms. However, there are some limitations to our study. First, the numbers of miRNAs detected in different GSE chips were different (Table 1), suggesting that some newly discovered miRNAs might be missing. And some miRNAs might be excluded because of our rigorous screening criteria. Second, the meta‐analysis of the expression of miR‐17‐5p in serum/blood of GC needed to be optimized because of insufficiently reliable studies at present. Third, the prediction of target genes was based on different algorithms. More experiments will be needed for validation or even correction and to confirm the KEGG pathway analysis and GO enrichment results.
In conclusion, we believe that miR‐17 may serve as a promising diagnostic marker for GC. miR‐17‐5p promotes the occurrence and development of GC by targeting certain downstream genes. Future studies should be focused on the functions and underlying pathways of miR‐17 in different GC sample types, such as tissue, serum, blood, circulating tumor cells, serum exosomes, and others, to further explore its utility in the diagnosis and molecular therapy of GC.
Author contributions
WX conceived and designed the project. GFH, QWL, JXY, and LJC performed the experiments. GFH, QWL, JXY, LJC, JD, and KZ analyzed the data. GFH, WX, JD, and KZ wrote the manuscript. All authors read and approved the final manuscript.
Supporting information
Table S1. Pathway enrichment in KEGG databases of the 228 targets of miR‐17‐5p.
Table S2. The GO analysis of BP of 228 target genes of miR‐17‐5p.
Table S3. The GO analysis of CC of 228 target genes of miR‐17‐5p.
Table S4. The GO analysis of MF of 228 target genes of miR‐17‐5p.
Acknowledgement
This work was supported by the National Natural Science Foundation of China (81672106).
References
- 1. Chen W, Zheng R, Baade PD, Zhang S, Zeng H, Bray F, Jemal A, Yu XQ and He J (2016) Cancer statistics in China, 2015. CA Cancer J Clin 66, 115–132. [DOI] [PubMed] [Google Scholar]
- 2. Thrumurthy SG, Chaudry MA, Hochhauser D and Mughal M (2013) The diagnosis and management of gastric cancer. BMJ 347, f6367. [DOI] [PubMed] [Google Scholar]
- 3. Ucar E, Semerci E, Ustun H, Yetim T, Huzmeli C and Gullu M (2008) Prognostic value of preoperative CEA, CA 19‐9, CA 72‐4, and AFP levels in gastric cancer. Adv Ther 25, 1075–1084. [DOI] [PubMed] [Google Scholar]
- 4. Carlomagno N, Incollingo P, Tammaro V, Peluso G, Rupealta N, Chiacchio G, Sandoval Sotelo ML, Minieri G, Pisani A, Riccio E et al (2017) Diagnostic, predictive, prognostic, and therapeutic molecular biomarkers in third millennium: a breakthrough in gastric cancer. Biomed Res Int 2017, 7869802 10.1155/2017/7869802. [DOI] [PMC free article] [PubMed] [Google Scholar]
- 5. Hayes J, Peruzzi PP and Lawler S (2014) MicroRNAs in cancer: biomarkers, functions and therapy. Trends Mol Med 20, 460–469. [DOI] [PubMed] [Google Scholar]
- 6. Liu W, Ma R and Yuan Y (2017) Post‐transcriptional regulation of genes related to biological behaviors of gastric cancer by long noncoding RNAs and microRNAs. J Cancer 8, 4141–4154. [DOI] [PMC free article] [PubMed] [Google Scholar]
- 7. Lages E, Ipas H, Guttin A, Nesr H, Berger F and Issartel JP (2012) MicroRNAs: molecular features and role in cancer. Front Biosci 17, 2508–2540. [DOI] [PMC free article] [PubMed] [Google Scholar]
- 8. Helwak A, Kudla G, Dudnakova T and Tollervey D (2013) Mapping the human miRNA interactome by CLASH reveals frequent noncanonical binding. Cell 153, 654–665. [DOI] [PMC free article] [PubMed] [Google Scholar]
- 9. Duell EJ, Lujan‐Barroso L, Sala N, Deitz McElyea S, Overvad K, Tjonneland A, Olsen A, Weiderpass E, Busund LT, Moi L et al (2017) Plasma microRNAs as biomarkers of pancreatic cancer risk in a prospective cohort study. Int J Cancer 141, 905–915. [DOI] [PMC free article] [PubMed] [Google Scholar]
- 10. Sousa JF, Nam KT, Petersen CP, Lee HJ, Yang HK, Kim WH and Goldenring JR (2016) miR‐30‐HNF4gamma and miR‐194‐NR2F2 regulatory networks contribute to the upregulation of metaplasia markers in the stomach. Gut 65, 914–924. [DOI] [PMC free article] [PubMed] [Google Scholar]
- 11. Song YX, Sun JX, Zhao JH, Yang YC, Shi JX, Wu ZH, Chen XW, Gao P, Miao ZF and Wang ZN (2017) Non‐coding RNAs participate in the regulatory network of CLDN4 via ceRNA mediated miRNA evasion. Nat Commun 8, 289. [DOI] [PMC free article] [PubMed] [Google Scholar]
- 12. Dan (Han) JL, Huamin W, Xiaoping S, Jin H, Yan G, Cheng Q, Yun L, Xiang L, Mingyan Huang NL, Weiping Z et al (2017) Circular RNA circMTO1 acts as the sponge of microRNA‐9 to suppress hepatocellular carcinoma progression. Hepatology 66, 1151–1164. [DOI] [PubMed] [Google Scholar]
- 13. Pal D, Mukhopadhyay D, Ramaiah MJ, Sarma P, Bhadra U and Bhadra MP (2016) Regulation of cell proliferation and migration by miR‐203 via GAS41/miR‐10b axis in human glioblastoma cells. PLoS ONE 11, e0159092. [DOI] [PMC free article] [PubMed] [Google Scholar]
- 14. Han TS, Hur K, Xu G, Choi B, Okugawa Y, Toiyama Y, Oshima H, Oshima M, Lee HJ, Kim VN et al (2015) MicroRNA‐29c mediates initiation of gastric carcinogenesis by directly targeting ITGB1. Gut 64, 203–214. [DOI] [PMC free article] [PubMed] [Google Scholar]
- 15. Wang SM, Tie J, Wang WL, Hu SJ, Yin JP, Yi XF, Tian ZH, Zhang XY, Li MB, Li ZS et al (2016) POU2F2‐oriented network promotes human gastric cancer metastasis. Gut 65, 1427–1438. [DOI] [PMC free article] [PubMed] [Google Scholar]
- 16. Chou CH, Shrestha S, Yang CD, Chang NW, Lin YL, Liao KW, Huang WC, Sun TH, Tu SJ, Lee WH et al (2018) miRTarBase update 2018: a resource for experimentally validated microRNA‐target interactions. Nucleic Acids Res 46, D296–D302. [DOI] [PMC free article] [PubMed] [Google Scholar]
- 17. Karagkouni D, Paraskevopoulou MD, Chatzopoulos S, Vlachos IS, Tastsoglou S, Kanellos I, Papadimitriou D, Kavakiotis I, Maniou S, Skoufos G et al (2018) Diana‐TarBase v8: a decade‐long collection of experimentally supported miRNA‐gene interactions. Nucleic Acids Res 46, D239–D245. [DOI] [PMC free article] [PubMed] [Google Scholar]
- 18. Shin C, Nam JW, Farh KK, Chiang HR, Shkumatava A and Bartel DP (2010) Expanding the microRNA targeting code: functional sites with centered pairing. Mol Cell 38, 789–802. [DOI] [PMC free article] [PubMed] [Google Scholar]
- 19. Paraskevopoulou MD, Georgakilas G, Kostoulas N, Vlachos IS, Vergoulis T, Reczko M, Filippidis C, Dalamagas T and Hatzigeorgiou AG (2013) Diana‐microT web server v5.0: service integration into miRNA functional analysis workflows. Nucleic Acids Res 41, W169–W173. [DOI] [PMC free article] [PubMed] [Google Scholar]
- 20. Miranda KC, Huynh T, Tay Y, Ang YS, Tam WL, Thomson AM, Lim B and Rigoutsos I (2006) A pattern‐based method for the identification of microRNA binding sites and their corresponding heteroduplexes. Cell 126, 1203–1217. [DOI] [PubMed] [Google Scholar]
- 21. Krek A, Grün D, Poy MN, Wolf R, Rosenberg L, Epstein EJ, MacMenamin P, da Piedade I, Gunsalus KC, Stoffel M et al (2005) Combinatorial microRNA target predictions. Nat Genet 37, 495–500. [DOI] [PubMed] [Google Scholar]
- 22. Wong N and Wang X (2015) miRDB: an online resource for microRNA target prediction and functional annotations. Nucleic Acids Res 43, D146–D152. [DOI] [PMC free article] [PubMed] [Google Scholar]
- 23. Bhattacharya A, Ziebarth JD and Cui Y (2014) PolymiRTS Database 3.0: linking polymorphisms in microRNAs and their target sites with human diseases and biological pathways. Nucleic Acids Res 42, D86–D91. [DOI] [PMC free article] [PubMed] [Google Scholar]
- 24. Lu TP, Lee CY, Tsai MH, Chiu YC, Hsiao CK, Lai LC, Chuang EY, Yu‐Chiao C and Chuhsing Kate H (2012) miRSystem: an integrated system for characterizing enriched functions and pathways of microRNA targets. PLoS ONE 7, e42390. [DOI] [PMC free article] [PubMed] [Google Scholar]
- 25. Vasaikar SV, Straub P, Wang J and Zhang B (2018) LinkedOmics: analyzing multi‐omics data within and across 32 cancer types. Nucleic Acids Res 46, D956–D963. [DOI] [PMC free article] [PubMed] [Google Scholar]
- 26. He L, Thomson JM, Hemann MT, Hernando‐Monge E, Mu D, Goodson S, Powers S, Cordon‐Cardo C, Lowe SW, Hannon GJ et al (2005) A microRNA polycistron as a potential human oncogene. Nature 435, 828–833. [DOI] [PMC free article] [PubMed] [Google Scholar]
- 27. O'Donnell KA, Wentzel EA, Zeller KI, Dang CV and Mendell JT (2005) c‐Myc‐regulated microRNAs modulate E2F1 expression. Nature 435, 839–843. [DOI] [PubMed] [Google Scholar]
- 28. Wang JL, Hu Y, Kong X, Wang ZH, Chen HY, Xu J and Fang JY (2013) Candidate microRNA biomarkers in human gastric cancer: a systematic review and Validation Study. PLoS ONE 8: e73683. [DOI] [PMC free article] [PubMed] [Google Scholar]
- 29. Wu Q, Luo G, Yang Z, Zhu F, An Y, Shi Y and Fan D (2014) miR‐17‐5p promotes proliferation by targeting SOCS6 in gastric cancer cells. FEBS Lett 588, 2055–2062. [DOI] [PubMed] [Google Scholar]
- 30. Zhang X, Kong Y, Xu X, Xing H, Zhang Y, Han F, Li W, Yang Q, Zeng J, Jia J et al (2014) F‐box protein FBXO31 is down‐regulated in gastric cancer and negatively regulated by miR‐17 and miR‐20a. Oncotarget 5, 6178–6190. [DOI] [PMC free article] [PubMed] [Google Scholar]
- 31. Chen P, Zhao H, Huang J, Yan X, Zhang Y and Gao Y (2016) MicroRNA‐17‐5p promotes gastric cancer proliferation, migration and invasion by directly targeting early growth response 2. Am J Cancer Res 6, 2010–2020. [PMC free article] [PubMed] [Google Scholar]
- 32. Nandakumar P, Tin A, Grove ML, Ma J, Boerwinkle E, Coresh J and Chakravarti A (2017) MicroRNAs in the miR‐17 and miR‐15 families are downregulated in chronic kidney disease with hypertension. PLoS ONE 12, e0176734. [DOI] [PMC free article] [PubMed] [Google Scholar]
- 33. Bobbili MR, Mader RM, Grillari J and Dellago H (2017) OncomiR‐17‐5p: alarm signal in cancer? Oncotarget 8, 71206–71222. [DOI] [PMC free article] [PubMed] [Google Scholar]
- 34. Zhu Y, Gu J, Li Y, Peng C, Shi M, Wang X, Wei G, Ge O, Wang D, Zhang B et al (2018) MiR‐17‐5p enhances pancreatic cancer proliferation by altering cell cycle profiles via disruption of RBL2/E2F4‐repressing complexes. Cancer Lett 412, 59–68. [DOI] [PubMed] [Google Scholar]
- 35. Sun R, Liang Y, Yuan F, Nie X, Sun H, Wang Y, Yu T, Gao L and Zhang L (2017) Functional polymorphisms in the promoter region of miR‐17‐92 cluster are associated with a decreased risk of colorectal cancer. Oncotarget 8, 82531–82540. [DOI] [PMC free article] [PubMed] [Google Scholar]
- 36. Sueta A, Yamamoto Y, Tomiguchi M, Takeshita T, Yamamoto‐Ibusuki M and Iwase H (2017) Differential expression of exosomal miRNAs between breast cancer patients with and without recurrence. Oncotarget 8, 69934–69944. [DOI] [PMC free article] [PubMed] [Google Scholar]
- 37. Jurkovicova D, Smolkova B, Magyerkova M, Sestakova Z, Kajabova VH, Kulcsar L, Zmetakova I, Kalinkova L, Krivulcik T, Karaba M et al (2017) Down‐regulation of traditional oncomirs in plasma of breast cancer patients. Oncotarget 8, 77369–77384. [DOI] [PMC free article] [PubMed] [Google Scholar]
- 38. Wang M, Gu H, Qian H, Zhu W, Zhao C, Zhang X, Tao Y, Zhang L and Xu W (2013) miR‐17‐5p/20a are important markers for gastric cancer and murine double minute 2 participates in their functional regulation. Eur J Cancer 49, 2010–2021. [DOI] [PubMed] [Google Scholar]
- 39. Bibi F, Pushparaj PN and Naseer MI (2017) Decrypting the microRNA signatures in gastric cancer using high‐throughput miRNA array coupled with systems biological approaches for precision medicine. Genet Mol Res 16, gmr16039845. [Google Scholar]
- 40. Zhang Y, Han T, Wei G and Wang Y (2015) Inhibition of microRNA‐17/20a suppresses cell proliferation in gastric cancer by modulating UBE2C expression. Oncol Rep 33, 2529–2536. [DOI] [PubMed] [Google Scholar]
- 41. Zhang K, Zhang L, Zhang M, Zhang Y, Fan D, Jiang J, Ye L, Fang X, Chen X, Fan S et al (2017) Prognostic value of high‐expression of miR‐17‐92 cluster in various tumors: evidence from a meta‐analysis. Sci Rep 7, 8375. [DOI] [PMC free article] [PubMed] [Google Scholar]
- 42. Zheng Q, Chen C, Guan H, Kang W and Yu C (2017) Prognostic role of microRNAs in human gastrointestinal cancer: a systematic review and meta‐analysis. Oncotarget 8, 46611–46623. [DOI] [PMC free article] [PubMed] [Google Scholar]
- 43. Zeng Q, Jin C, Chen W, Xia F, Wang Q, Fan F, Du J, Guo Y, Lin C, Yang K et al (2014) Downregulation of serum miR‐17 and miR‐106b levels in gastric cancer and benign gastric diseases. Chin J Cancer Res 26, 711–716. [DOI] [PMC free article] [PubMed] [Google Scholar]
- 44. Zhou H, Guo JM, Lou YR, Zhang XJ, Zhong FD, Jiang Z, Cheng J and Xiao BX (2010) Detection of circulating tumor cells in peripheral blood from patients with gastric cancer using microRNA as a marker. J Mol Med (Berl) 88, 709–717. [DOI] [PubMed] [Google Scholar]
- 45. Wang N, Wang L, Yang Y, Gong L, Xiao B and Liu X (2017) A serum exosomal microRNA panel as a potential biomarker test for gastric cancer. Biochem Biophys Res Commun 493, 1322–1328. [DOI] [PubMed] [Google Scholar]
- 46. Tsujiura M, Ichikawa D, Komatsu S, Shiozaki A, Takeshita H, Kosuga T, Konishi H, Morimura R, Deguchi K, Fujiwara H et al (2010) Circulating microRNAs in plasma of patients with gastric cancers. Br J Cancer 102, 1174–1179. [DOI] [PMC free article] [PubMed] [Google Scholar]
Associated Data
This section collects any data citations, data availability statements, or supplementary materials included in this article.
Supplementary Materials
Table S1. Pathway enrichment in KEGG databases of the 228 targets of miR‐17‐5p.
Table S2. The GO analysis of BP of 228 target genes of miR‐17‐5p.
Table S3. The GO analysis of CC of 228 target genes of miR‐17‐5p.
Table S4. The GO analysis of MF of 228 target genes of miR‐17‐5p.


