

Abstract
Chemoresistance is a major therapeutic challenge that plays a role in the poor statistical outcomes in pancreatic cancer. Unfolded protein response (UPR) is one of the homeostasis mechanisms in cancer cells that have been correlated with chemoresistance in a number of cancers including pancreatic cancer. In this study, we show that modulating glucose regulatory protein 78 (GRP78), the master regulator of the UPR, can have a profound effect on multiple pathways that mediate chemoresistance. Our study showed for the first time that silencing GRP78 can diminish efflux activity of ATP‐binding cassette (ABC) transporters, and it can decrease the antioxidant response resulting in an accumulation of reactive oxygen species (ROS). We also show that these effects can be mediated by the activity of specificity protein 1 (SP1), a transcription factor overexpressed in pancreatic cancer. Thus, inhibition of SP1 negatively affects the UPR, deregulates the antioxidant response of NRF2, as well as ABC transporter activity by inhibiting GRP78‐mediated ER homeostasis. Sp1 and NRF2 have been classified as nononcogene addiction genes and thus are imperative to understanding the molecular mechanism of resistance. These finding have huge clinical relevance as both Sp1 and GRP78 are overexpressed in pancreatic cancer patients and increased expression of these proteins is indicative of poor prognosis. Understanding how these proteins may regulate chemoresistance phenotype of this aggressive cancer may pave the way for development of efficacious therapy for this devastating disease.
Keywords: chemoresistance, GRP78, Sp1, unfolded protein response
Abbreviations
- 5‐FU
5‐fluorouracil
- ABC
ATP‐binding cassette
- ARE
antioxidant response elements
- ER
endoplasmic reticulum
- GEM
gemcitabine
- GRP78
glucose regulatory protein 78
- KPC
LSLKrasG12D, LSL‐Trp53R172H, Pdx‐1‐Cre
- MDR
multidrug resistant
- MTH
mithramycin
- NS
nonsilencing siRNA
- PDAC
pancreatic ductal adenocarcinoma
- RLU
relative luciferase units
- ROS
reactive oxygen species
- SP1
specificity protein 1
- UPR
unfolded protein response
1. Introduction
Pancreatic cancer is a devastating disease with relatively unchanged survival statistics for 70 years (ACS, 2017). In 2017, it is estimated that 53 670 people will be diagnosed with pancreatic cancer, and 43 090 people will die from the disease (ACS, 2017). FOLFIRINOX (oxaliplatin, irinotecan, leucovorin, and 5‐FU combination therapy) offers a slight survival benefit compared to gemcitabine alone, but only a small subset of patients can withstand the toxicity (Hessmann et al., 2017; Thierry Conroy et al., 2011). One of the main reasons for the poor survival statistics in this disease is due to drug resistance to these standards of care, such as gemcitabine, paclitaxel, and 5‐fluorouracil (5‐FU).
There are multiple mechanisms of chemoresistance employed by cancer cells. The unfolded protein response (UPR) contributes to chemoresistance, a homeostatic mechanism, which ameliorates stressful conditions to ensure cell survival. To survive the pressure created by the tumor microenvironment, including hypoxia and nutrient deprivation, tumor cells utilize the UPR pathways (Avril et al., 2017; Chevet et al., 2015; Lee, 2007; Ma and Hendershot, 2004). Multiple components of the UPR have been linked to advanced tumor stage and chemoresistance in cancer (Lee, 2014; Roller and Maddalo, 2013; Shen et al., 2017; Wang and Kaufman, 2014). For example, overexpression of PDIA5 in chronic myeloid leukemia shows increased resistance to imatinib (Chevet et al., 2015). Overexpression of XBP1s has been found in triple‐negative breast cancer, a notoriously resistant subset of breast cancer (Chevet et al., 2015; Fernandez et al., 2000). XBP1s also correlates with higher tumor grade, chemoresistance, and shorter survival in lymphoma (Wang and Kaufman, 2014). GRP78, the regulator of the UPR, has previously been correlated with poor patient prognosis in multiple cancers, including pancreatic cancer (Avril et al., 2017; Gifford et al., 2016; Ma and Hendershot, 2004; Niu et al., 2015; Wang and Kaufman, 2014). Based on correlation studies and direct overexpression leading to chemoresistance, numerous proteins in the UPR pathway have been targeted with small molecules in hopes to attenuate chemoresistance (Chevet et al., 2015; Gifford et al., 2016; Lee, 2014; Roller and Maddalo, 2013). In spite of a generous body of literature correlating chemoresistance to expression of genes involved in UPR, there have been almost no studies to elucidate the mechanism(s) by which UPR contributes to chemoresistance.
Upregulation of the oxidative stress response pathway is another mechanism of decreasing chemotherapy‐driven apoptosis. Management of oxidative stress decreases ROS accumulation in a cell, which in turn enhances detoxification and inhibits apoptotic cell death of tumor cells (Chio et al., 2016; DeNicola et al., 2011). The major transcription factor responsible for regulating oxidative stress response is nuclear factor erythroid 2‐like 2 (NRF2). NRF2 is downstream of the PKR‐like endoplasmic reticulum kinase sensor in the UPR and is one transcription factors that has been shown to regulate ABCC subfamily expression (Chartoumpekis et al., 2015). NRF2 normally acts like a tumor suppressor, but overactivation of its antioxidant response elements (ARE) activity leads to cell survival of normal and malignant cells (Chartoumpekis et al., 2015; DeNicola et al., 2011; Menegon et al., 2016). It has previously been reported that gemcitabine upregulates the NRF2 pathway, helping to mediate resistance (Avril et al., 2017; Palam et al., 2015).
Another well‐known mechanism of chemoresistance is through the ABC transporter family. ABC transporters drive the efflux of xenobiotics, including chemotherapeutics. High transporter activity keeps cellular chemotherapeutic compounds low, thereby decreasing their effective concentration within the cell. The most common transporters involved in chemoresistance are BRCP (ABCG2), MDR1 (ABCB1), and MRPs (ABCCs) (Choudhuri and Klaassen, 2006; Krishna and Mayer, 2000; Molnár and Zalatnai, 2007; Pang et al., 2014; Zhao et al., 2016).
A previously published study from our laboratory showed higher GRP78 expression in tumor ducts compared to nontumor tissue (Mujumdar et al., 2014). It was recently reported that GRP78 correlates with poor prognosis and chemoresistance in pancreatic cancer (Gifford et al., 2016; Niu et al., 2015). Further, it was shown that gemcitabine‐resistant cell lines have higher GRP78 expression compared to gemcitabine‐sensitive cell lines (Gifford et al., 2016). It has also been reported that patients with pancreatic cancer have an upregulation of ABC transporters, particularly ABCC3 and ABCC5 (Konig et al., 2005; Pang et al., 2014). However, it is unclear whether the ABC expression regulation correlates with PDAC tumor stages (Konig et al., 2005; Pang et al., 2014).
Specificity protein 1 (SP1) regulates many biological functions, including cell growth, differentiation, and survival, as well as tumor progression and metastasis (Banerjee et al., 2013; Beishline and Azizkhan‐Clifford, 2015; Deniaud et al., 2009; Hedrick et al., 2016; Kanai et al., 2006). Multiple studies have underscored the importance of SP1 in malignant tissues (Banerjee et al., 2013; Deniaud et al., 2009; Kanai et al., 2006). Interestingly, it has been reported in colon, gastric, pancreatic, and breast cancers that SP1 is overexpressed, whereas minimal‐to‐no SP1 expression is detected in normal differentiated cells (Banerjee et al., 2013; Deniaud et al., 2009; Kanai et al., 2006). We have recently published that upon downregulation of SP1, transcriptional regulation of GRP78 is adversely affected and cannot recover from chronic ER stress, which leads to cell death (Dauer et al., 2017).
In this manuscript, we show for the first time that modulation of GRP78 expression by either overexpressing or silencing has a profound effect on a number of independent pathways that are responsible for chemoresistance. We further show that the effect of GRP78 modulation is mediated by the activity of SP1, a transcription factor that plays a significant role in maintaining ER homeostasis. Thus, the inhibition of SP1 deregulates the antioxidant response of NRF2 as well as ABC transporter activity by inhibiting GRP78‐mediated ER homeostasis via the unfolded protein response.
2. Materials and methods
2.1. Cell culture and treatment
MIA PaCa‐2 (obtained from ATCC) was cultured in DMEM; high glucose, supplemented with 10% FBS and 100 units·mL−1 penicillin and 100 μg·mL−1 streptomycin. S2‐VP10 (a gift from Dr. Masato Yamamoto, University of Minnesota) and SU.86.86 (ATCC) were grown and propagated in RPMI, supplemented with 10% FBS, 100 units·mL−1 penicillin, and 100 μg·mL−1 streptomycin. All cells were maintained at 37 °C in a humidified air atmosphere with 5% CO2.
ON‐TARGETplus SMARTpool (pool of 4 siRNA) human SP1 (Dharmacon, Cat # L‐026959‐00‐0020) and GRP78 siRNA (Dharmacon, Cat # L‐008198‐00‐0020) were used for silencing experiments. Transfections were completed using DharmaFECT (Dharmacon) according to the manufacturer's instructions. Evidence of silencing GRP78 and SP1 is provided in Fig. S6.
Human HSPA5 siRNA (SMARTpool) Target Sequences: GCGCAUUGAUACUAGAAA; GAACCAUCCCGUGGCAUAA; GAAAGAAGGUUACCCAUGC; AGAUGAAGCUGUAGCGUAU
Human ON‐TARGETplus Nontargeting siRNA #2 Target Sequence: UGGUUUACAUGUUGUGUGA
Human SP1 siRNA (SMARTpool) Target Sequences: GCCAAUAGCUACUCAACUA; GAAGGGAGGCCCAGGUGUA; GGGCAGACCUUUACAACUC; CUACAGAGGCACAAACGUA
2.2. KPC tumor analyses
LSLKrasG12D; LSL‐Trp53R172H; and Pdx‐1‐Cre (KPC) mice of various ages (1–9 months) were euthanized, and pancreata were analyzed for mRNA and protein expression of GRP78, NRF2, and ABC transporters. Mice were sorted according to age and tumor status into nontumor and full‐tumor groups; that is, the 3‐month KPC mice with tumors were placed in the tumor group (ranging from 3 to 9 months).
2.3. Gene expression analyses
RT‐PCR: RNA was isolated from the cells according to the manufacturer's instructions using Trizol (Invitrogen; Carlsbad, CA, USA). Total RNA (2 μg) was used to make cDNA and perform real‐time PCR using the QuantiTect SyBr Green PCR Kit (Qiagen; Hilden, Germany) according to the manufacturer's instructions using Roche 480 real‐time PCR system. All data were normalized to the housekeeping gene 18S (Qiagen, Cat # QT00199367). Quantitative RT‐PCR primers for SP1 (Qiagen, Cat # QT01870449) and HSPA5 (GRP78) (Qiagen, Cat # QT 00096404).
2.4. ELISA
KPC or human pancreatic cancer patient serum was used to analyze the GRP78 serum levels, using the Enzo ELISA Kit, per manufacturer's instructions. GRP78 antibody is immobilized in a precoated plate. 100 μL of serum was pipetted in each well of a 96‐well plate in duplicate and allowed to bind overnight at 4 °C. The following morning, the serum was removed and fresh GRP78 standards were prepared and pipetted in duplicate. 100 μL of biotin‐conjugated GRP78 antibody was added to each well, followed by 100 μL HRP‐avidin secondary. Color formation was achieved using a TMB substrate for 30 min and was detected at 450 nm using a microplate reader.
2.5. Immunofluorescence
Paraffin‐embedded KPC mouse tissues were deparaffinized in xylene and then rehydrated in graded ethanol. After citrate antigen retrieval, tissues were blocked with Dako protein block and incubated with primary (GRP78, Abcam ab21685) at 1 : 1000 dilution. Slides were washed with PBS and incubated with Alexa Fluor 488 anti‐rabbit secondary antibody for 1 h. Slides were washed with PBS and mounted with prolong gold with DAPI (Invitrogen).
MIA PaCa‐2 and S2‐VP10 cells were plated in chamber slides and incubated for 1–24 h at 37 °C. The slides were treated with 400 nm (MIA PaCa‐2) or 100 nm (S2‐VP10) gemcitabine; fixed with 2% paraformaldehyde. The slides were incubated with 1 : 1000 dilution of rabbit polyclonal anticleaved caspase 3 antibody (Cell Signaling; Danvers, MA, USA) and a 1 : 1000 dilution of Alexa 488‐conjugated donkey anti‐rabbit IgG (Molecular Probes; Eugene, OR, USA). The slides were mounted using Prolong Gold antifade with 4′,6‐diamidino‐2‐phenylindole (Molecular Probes). Immunofluorescence images were obtained on a Leica DM6B with a 20× objective. Cleaved caspase was quantified using Image J software.
2.6. Immunohistochemistry
Paraffin‐embedded KPC mouse and human pancreatic cancer patient tissues were deparaffinized in xylene and then rehydrated in graded ethanol. Slides were steamed with pH 9 antigen retrieval (Dako). Endogenous peroxidases were blocked with a 3% hydrogen peroxide solution. Tissues were then blocked with Dako protein block and incubated with primary antibody overnight. Slides were stained with anti‐SP1 (Cell Signaling, Cat # 9389) and anti‐GRP78 (Cell Signaling, Cat # 3177) at 1 : 200 dilutions. Slides were washed with PBS, incubated with secondary anti‐rabbit antibody, and conjugated to horseradish peroxidase, for 30 min. Slides were washed again with PBS. Diaminobenzidine Peroxidase Substrate Kit (Vector Laboratories) was then added to slides. Primary antibody was omitted for negative controls. Slides were mounted with permount. Images were obtained on a Leica DM6B with a 20× objective.
2.7. Viability
MIA PaCa‐2, S2‐VP10, and SU.86.86 cells were seeded in a 96‐well plate (7000 cells/well) and allowed to adhere for 24 h. Cells were transfected with 20 nm nonsilencing siRNA (NS), siGRP78, or siSP1. Drug treatments used 400 nm (MIA PaCa‐2) or 100 nm (S2‐VP10) gemcitabine, 50 nm paclitaxel, or 5 μm 5‐FU, unless otherwise specified. Cell viability assays following siRNA or pharmacological inhibitors were performed using a WST‐8‐based cell cytotoxicity assay per the manufacturer's protocol (Dojindo; Rockville, MD, USA) and expressed after normalizing to untreated cells.
2.8. Dye Efflux Assay
MIA PaCa‐2 cells were plated in a 6‐well plate. NS, siGRP78, and siSP1 were transfected in two wells each and allowed to incubate for 15 h. Cells were then treated with 400 nm gemcitabine or 50 nm paclitaxel for 8 h. Cells were then gently scraped and were transferred equally into two flow cytometry tubes. In one set, NucBlue live dye was added and incubated on ice. In the second set of tubes, NucBlue live dye was added, along with 100 μm verapamil, and incubated at 37 °C for 30 min, and subsequently moved to ice. Flow cytometry was performed using the Pacific Blue and AmCyan. The percent of inhibition was calculated by (+ Verapamil) – (− Verapamil).
2.9. ATP Determination
MIA PaCa‐2 and S2‐VP10 cells were seeded in a 6‐well plate. NS, siGRP78, and siSP1 were transfected in two wells each and allowed to incubate for 15 h. Cells were then treated with 400 nm (MIA PaCa‐2) or 100 nm (S2‐VP10) gemcitabine for 24 h. Total cellular ATP was measured using the ENLITEN ATP assay system (Promega; Madison, WI, USA). Briefly, 1 μL trichloroacetic acid was added to 100 μL cell lysate to extract the ATP. Each sample was then neutralized with 900uL TAE (pH 8.0). A standard curve ranging from 10−7 m to 10−11 m was prepared using the provided 10−7 m ATP standard. Luminescence was recorded for each sample and standard.
2.10. ATPase Activity Assay
MIA PaCa‐2 and S2‐VP10 cells were seeded in a 6‐well plate. NS, siGRP78, and siSP1 were transfected in two wells each and allowed to incubate for 15 h. Cells were then treated with 400 nm (MIA PaCa‐2) or 100 nm (S2‐VP10) gemcitabine for 24 h. Cells were lysed in lysis buffer and analyzed for ATPase per manufacturer's instructions (Sigma; St. Louis, MO, USA). After assay incubation, plate was read at 620 nm for standards, blanks, and unknowns on a spectrophotometer.
2.11. ARE Reporter Assay
MIA PaCa‐2 and S2‐VP10 cells were seeded in a 24‐well plate. NS, siGRP78, and siSP1 were transfected in two wells each and allowed to incubate for 15 h. Cells were then transfected with the Cignal Reporter plasmids for ARE (Qiagen) and treated with 400 nm (MIA PaCa‐2) or 100 nm (S2‐VP10) gemcitabine for 24 h. Wells were washed with PBS, and 100 μL of passive lysis buffer was added per well. After 15 min of rocking in passive lysis buffer, plates were stored at −80 °C until ready to read. The dual luciferase kit (Promega) was used to measure activity using a luminometer. Each sample was treated in duplicate for each plasmid (duplicates for the negative reporter and duplicates for the ARE reporter).
2.12. Reactive Oxygen Species assay
MIA PaCa‐2 and S2‐VP10 cells were seeded in black, clear bottom 96‐well plates. NS, siGRP78, and siSP1 were transfected in two wells each and allowed to incubate for 15 h. Cells were then treated with 400 nm (MIA PaCa‐2) or 100 nm (S2‐VP10) gemcitabine, 50 nm paclitaxel, and 5 uM 5‐FU for 24 h. Media were removed and replaced with 5 uM H2DCFDA/phenol‐free media for 1 h at 37 °C. Cells were washed with PBS, and phenol‐free media was replaced. ROS was measured at 5‐min intervals for 1 h, with 492/517 ex/em filters. Results were expressed as ROS fluorescence per viability using a WST‐8 cell cytotoxicity assay (Dojindo).
2.13. In vivo study
8‐week‐old athymic nude mice were injected subcutaneously (right flank) with 106 MIA PaCa‐2 cells suspended in Matrigel (Corning). Mice were randomized when the average tumor size reached 135 mm3. Mice were randomized into the following groups: 1. saline; 2. mithramycin 0.3 mg·kg−1; 3. mithramycin 0.6 mg·kg−1; 4. gemcitabine 50 mg·kg−1; 5. mithramycin 0.3 mg·kg−1 + gemcitabine 50 mg·kg−1; and 6. mithramycin 0.6 mg·kg−1 + gemcitabine 50 mg·kg−1. Saline and all mithramycin groups had seven mice each; gemcitabine had five mice. Mithramycin was administered intraperitoneally three times per week. Gemcitabine was administered intraperitoneally two times per week. Tumors were measured weekly with a digital calipers. Mice were euthanized when tumors reached 900 mm3. All procedures were approved by the University of Minnesota Institutional Animal Care and Use Committee (IACUC).
2.14. Statistical analysis
Values are expressed as the mean ± SEM. All in vitro experiments were performed at least three times. The significance between any two samples was analyzed by t‐test, and values of P < 0.05 were considered statistically significant.
*Analyses containing human specimens: The experiments were undertaken with the understanding and written consent of each subject. The study methodologies conformed to the standards set by the Declaration of Helsinki. The study methodologies were approved by University of Minnesota IRB.
3. Results
3.1. GRP78 expression correlates with tumor progression
We found significantly increased GRP78 mRNA expression in tumor‐bearing mice (8.82e−6) compared to 1‐month (7.76e−7) and 3‐month mice (1.62e−6) (Fig. 1A). Serum protein level of GRP78 was also significantly increased (0.53 ng·mL−1) compared to the nontumor‐bearing controls (0.02 ng·mL−1) (Fig. 1B). Further, we analyzed human patient serum for levels of GRP78, and found a similar increase in GRP78 expression (12 258 ng·mL−1) compared to healthy controls (5.25 ng·mL−1) (Fig. 1C). Consistent with our mRNA data, we looked at GRP78 protein expression in the KPC pancreata by immunofluorescence staining and found an increase in the ductal expression of GRP78 in the tumor‐bearing group compared to the nontumor group (Fig. 1D). Additionally, we found GRP78 to be overexpressed in the ducts/pseudoducts of patient biopsy punches, which is consistent with recently published studies (Fig. 1E) (Gifford et al., 2016; Niu et al., 2015).
Figure 1.
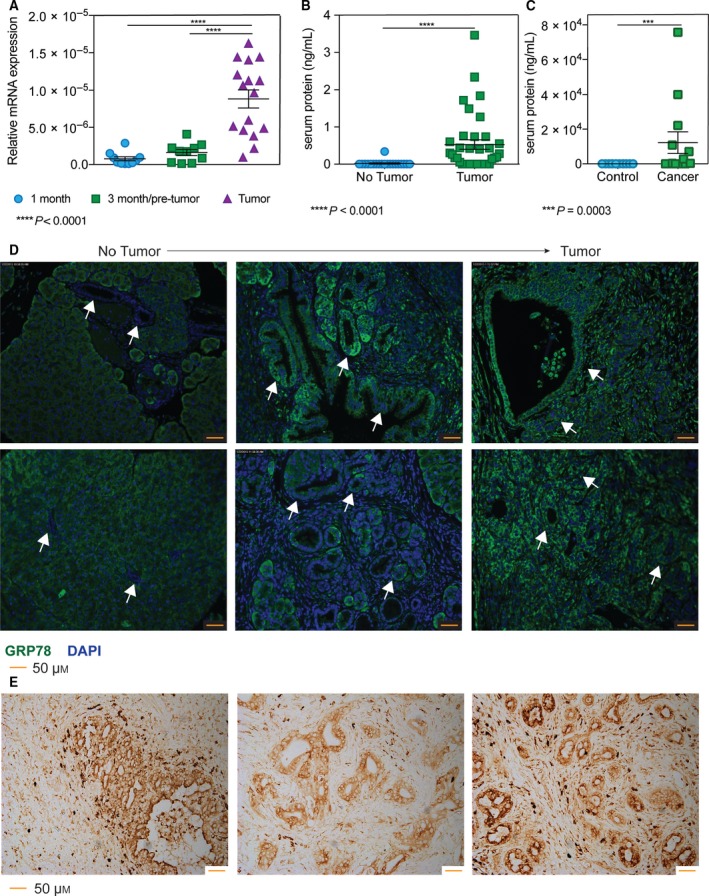
GRP78 expression correlates with tumor progression. Analysis using KPC pancreata ranging from 1 to 9 months found that (A) GRP78 mRNA expression is overexpressed in pancreata with tumor compared to 1‐ or 3‐month‐old KPC mice, and (B) GRP78 in serum from mice with tumors compared to mice without tumors was significantly greater. Serum from human patients also had elevated GRP78 compared to healthy controls (C). GRP78 protein expression (FITC) was found to be overexpressed in the ductal/pseudoductal regions in (D) the tumor‐bearing mice compared to mice without tumors (highlighted by arrows), as well as (E) human patient biopsy slides. Images were acquired at 20× magnification.
3.2. Silencing GRP78 combined with chemotherapeutics increases cell death
Three pancreatic cancer cell lines: MIA PaCa‐2, SU.86.86, and S2‐VP10 were used to demonstrate the chemoresistance to relevant PDAC drugs (gemcitabine, paclitaxel, and 5‐fluorouracil). Figure 2A is a dose response curve for each cell line with the three drugs after 48 h of treatment. To determine whether silencing GRP78 would diminish chemoresistance in the same cell lines, cells were transfected with siGRP78 and treated with gemcitabine, paclitaxel, or 5‐FU for 24–48 h. We found that combining chemotherapeutics (using greater than IC50 concentrations) with siGRP78 resulted in more cell death than silencing or drug treatment alone in 24 and 48 h (Fig. 2B, Fig. S1A,B). In addition to cell viability, apoptosis was detected using immunofluorescence by probing with a cleaved caspase 3 antibody. MIA PaCa‐2 (Fig. 2C, Fig. S2A) and S2‐VP10 (Fig. S2B) were transfected with nonsilencing (NS) siRNA, NS + gemcitabine, siGRP78, or siGRP78 + gemcitabine for 24 h. Our results show increased cleaved caspase 3 in siGRP78 + gemcitabine compared to gemcitabine or NS alone.
Figure 2.
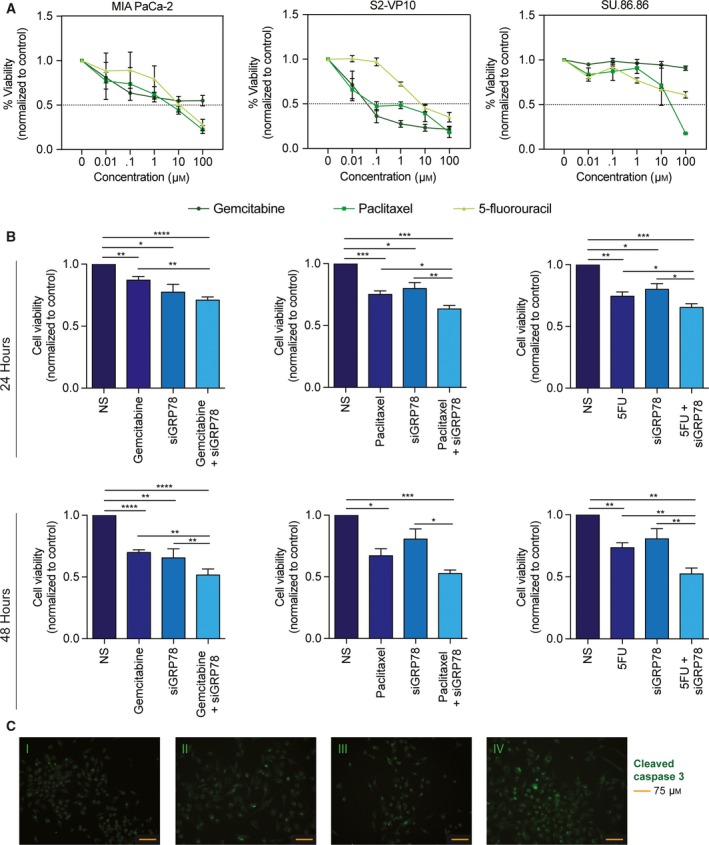
Silencing GRP78 combined with chemotherapeutics increases cell death. MIA PaCa‐2, SU.86.86, and S2‐VP10 cells were all treated with a dose response (0–100 μm) of gemcitabine, paclitaxel, and 5‐fluorouracil for 48 h (A). MIA PaCa‐2 cells transfected with siGRP78 and treated with 400 nm gemcitabine, 50 nm paclitaxel, or 5 μm 5‐fluorouracil for 24 and 48 h resulted in decreased viability compared to treatment or silencing alone (B). MIA PaCa‐2 cells transfected with nonsilencing (NS) siRNA (C‐I), 400 nm gemcitabine (C‐II), siGRP78 (C‐III), or siGRP78 + gemcitabine (C‐IV) for 24 h. Cells were fixed and probed with a cleaved caspase 3 antibody for apoptosis, and images were acquired at 20× magnification.
3.3. Silencing GRP78 combined with chemotherapeutic compounds decreases ABC transporter activity in pancreatic cancer cells
ATP‐binding cassette transporters are a known mechanism of chemoresistance. Our results showed numerous ABC transporters to be overexpressed in KPC tumors compared to 1‐month KPC without tumors (Table 1). Further, using a dye efflux assay, we found that gemcitabine and paclitaxel alone both increased the % efflux of cells (27.1% and 2.9%, respectively). Conversely, nonsilencing (0.35–0.77%) and siGRP78 (0.43–0.88%) had minimal efflux activity. When MIA PaCa‐2 cells were silenced with siGRP78 and treated with gemcitabine, the % efflux decreased back to baseline (0.68%). siGRP78 and paclitaxel had a similar trend as gemcitabine, and the combination decreased the % efflux to 0.56% (Fig. 3A).
Table 1.
mRNA expression of ABC transporter genes during pancreatic cancer progression in a KPC mouse
| 1 month | SEM | 3 months/pretumor | SEM | Tumor | SEM | |
|---|---|---|---|---|---|---|
| ABCA1 | 6.011E‐07 | 2.69E‐07 | 1.117E‐06** | 7.82E‐07 | 1.125E‐05** | 1.41E‐06 |
| ABCB1 | 4.539E‐08 | 2.05E‐08 | 3.096E‐08** | 1.63E‐08 | 2.172E‐06** | 7.95E‐07 |
| ABCC1 | 6.210E‐07 | 3.60E‐07 | 6.897E‐07** | 3.58E‐07 | 5.478E‐06** | 1.25E‐06 |
| ABCC2 | 4.731E‐06 | 3.32E‐06 | 3.076E‐05 | 2.46E‐05 | 5.852E‐05 | 4.22E‐05 |
| ABCC4 | 1.050E‐07 | 5.19E‐08 | 1.302E‐07** | 7.25E‐08 | 2.941E‐06** | 7.21E‐07 |
| ABCC5 | 8.264E‐07 | 3.34E‐07 | 1.167E‐06* | 4.71E‐07 | 4.990E‐06* | 7.94E‐07 |
| ABCG2 | 2.247E‐07 | 6.90E‐08 | 1.008E‐05 | 7.53E‐06 | 2.493E‐06 | 1.29E‐06 |
*< 0.001; **< 0.0001.
Figure 3.
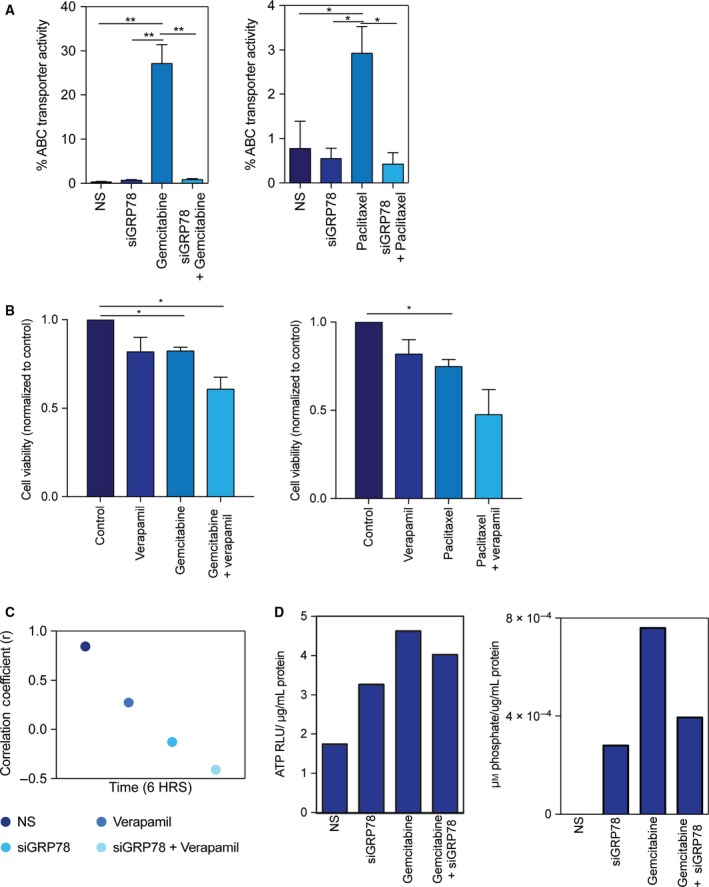
Silencing GRP78 combined with chemotherapeutic compounds decreases ABC transporter activity in pancreatic cancer cells. MIA PaCa‐2 cells transfected with siGRP78 and treated with 400 nm gemcitabine or 50 nm paclitaxel for 8 h ± verapamil, and analyzed by flow cytometry (A). MIA PaCa‐2 cells were treated with verapamil + chemotherapeutics for 24 h to determine cell viability (B). Pearson's coefficient was calculated for ER tracker and calcium co‐localization in MIA PaCa‐2 cells transfected with siGRP78 and treated with 100 μm verapamil for 6 h (C). MIA PaCa‐2 cells transfected with siGRP78 and treated with 400 nm gemcitabine for 24 h to measure total ATP (D) and ATPase (E). Figures are representative of three separate experiments.
The dye efflux assay utilizes verapamil to effectively block transport, but also as a calcium channel blocker, blocks calcium channels. We next wanted to determine the effect on viability and calcium changes when blocking transporters using verapamil with and without siGRP78 or drugs. The combination of verapamil and drugs in MIA PaCa‐2 cells (Fig. 3B, Fig. S3A) and S2‐VP10 cells (Fig. S3B) decreased cell viability in 24 h more than verapamil or drug alone. Next, we transfected MIA PaCa‐2 cells with NS, siGRP78, NS + verapamil, or siGRP78 + verapamil for 1 and 6 h, and stained cells with ER tracker and Fluo4 (calcium dye). Pearson's coefficients were calculated for each group. After 1 h, r ranged from 0.3166 to 0.7254 (data not shown). However, in 6 h, NS had an r value of 0.8848; siGRP78 r = −0.1272; verapamil r = −0.5227; and siGRP78 + verapamil r = −0.4092 (Fig. 3C), indicating a negative correlation between calcium and ER tracker.
ATP‐binding cassette transporters are fueled by ATP. To determine how GRP78 (an ER resident protein) effectively decreases the ABC transporter activity, we silenced GRP78 and measured the total ATP and ATPase per condition described in MIA PaCa‐2 cells. Results are expressed as relative luciferase units (RLU) per μg/mL protein. Gemcitabine alone increased ATP (4.62) as compared to nonsilenced (1.74) and siGRP78 (3.26). Gemcitabine with siGRP78 decreased the total ATP (4.02) compared to gemcitabine alone (Fig. 3D). The amount of ATPase corresponds with the total cellular ATP. ATPase is expressed as μm phosphate per μg/mL protein. Gemcitabine had an increase in the ATPase (7.59e−4) compared to NS (0) or siGRP78 (2.80e−4) (Fig. 3E), indicating that more ATP is being utilized. Gemcitabine with siGRP78 decreased the amount of ATPase compared to gemcitabine alone (3.94), indicating that less ATP is being utilized with the combination.
3.4. Silencing GRP78 combined with chemotherapeutic compounds decreases antioxidant response in activity in pancreatic cancer cells
NRF2 is also an important mechanism of chemoresistance, by binding to the antioxidant response elements and transcribing detoxification genes, as well as some ABC transporters. We found that NRF2 mRNA expression is overexpressed in full‐tumor KPC pancreata (4.35e−5) compared to 1‐month (3.33e−6) and 3‐month pancreata without tumors (1.69e−5) (Fig. 4A). In terms of activity, gemcitabine modestly increased the NRF2 activity in MIA PaCa‐2 cells (1.71 RLU), as measured by a luciferase reporter of the antioxidant response elements (representative results shown). siGRP78 modestly decreased NRF2 activity (0.62 RLU), and when combined with gemcitabine (1.23 RLU), it decreases the activity closer to nonsilenced cells (NS) (1.06 RLU) (Fig. 4B). S2‐VP10 cells had a similar trend, but resulted in much more NRF2 activity. Gemcitabine increased the NRF2 activity (3632 RLU), and siGRP78 was slightly higher than NS (1055 RLU), and when combined with gemcitabine (1915 RLU), it decreases the activity closer to NS (320 RLU) (Fig. 4C). Further, we observed that the total ROS detected with DCFDA dye was increased in the siGRP78 + gemcitabine compared to NS, siGRP78, or treatment alone in MIA PaCa‐2 (Fig. 4D) as well as in S2‐VP10 (Fig. 4E), indicating that the UPR‐NRF2/ARE signaling is not able to decrease the amount of ROS being produced in the combination treatment.
Figure 4.
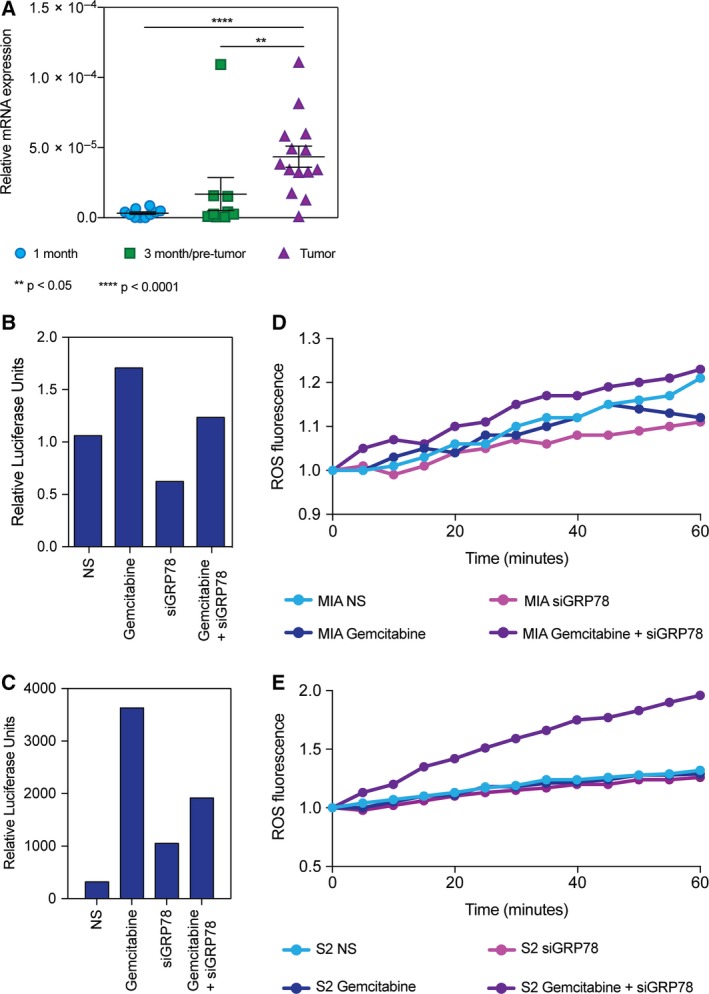
Silencing GRP78 combined with chemotherapeutic compounds decreases antioxidant response in activity in pancreatic cancer cells. Analysis using KPC pancreata ranging from 1 to 9 months found that (A) NRF2 mRNA expression is overexpressed in pancreata with tumor compared to 1‐ or 3‐month‐old KPC mice. MIA PaCa‐2 cells transfected with siGRP78 and treated with 400 nm gemcitabine for 24 h to measure ARE activity (B). S2‐VP10 cells transfected with siGRP78 and treated with 100 nm gemcitabine for 24 h to measure ARE activity (C). ROS measurement of MIA PaCa‐2 (D) and S2‐VP10 (E) cells after 24 h of treating with gemcitabine and siGRP78.
3.5. SP1 is required for ER homeostasis and affects chemoresistance in pancreatic cancer cells, similar to GRP78
We have previously shown that SP1 is required for ER homeostasis in pancreatic cancer (Dauer et al., 2017). MIA PaCa‐2 (Fig. 5A) and S2‐VP10 cells (Fig. S4A) were treated with NS siRNA, NS + gemcitabine, siSP1, or siSP1 + gemcitabine for 24–48 h. We observed similar chemosensitivity as with siGRP78 when comparing cell viability with silencing SP1. In addition to cell viability, apoptosis of cells untreated vs. treated was detected using immunofluorescence by probing with a cleaved caspase 3 antibody. Again, we observed similar results as with silencing GRP78 and found that combining siSP1 with drugs resulted in more cell death (Fig. 5B, Fig. S4B,C).
Figure 5.
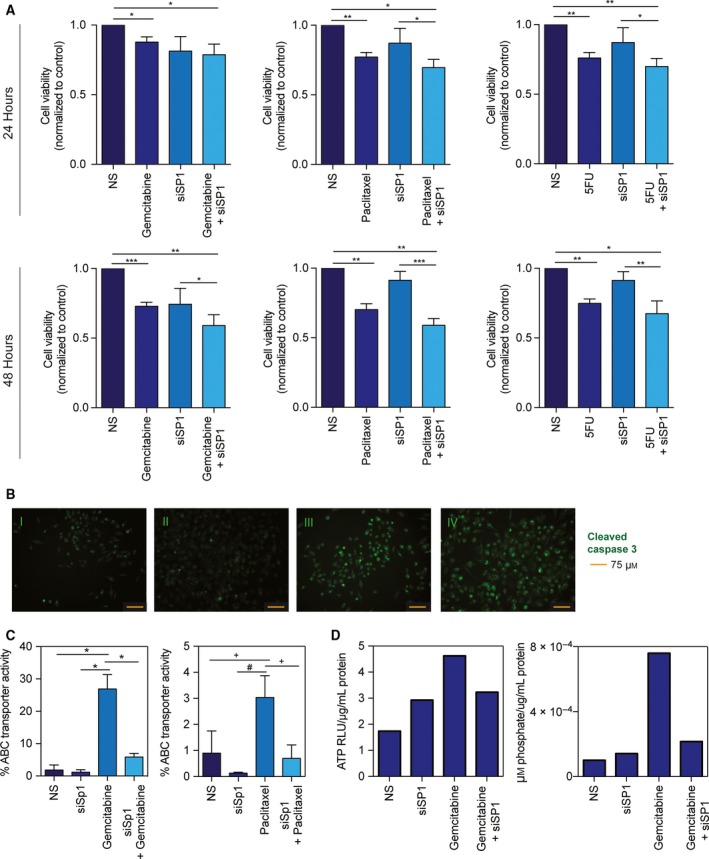
SP1 is required for ER homeostasis and affects chemoresistance in pancreatic cancer cells, similar to GRP78. MIA PaCa‐2 cells transfected with siSP1 and treated with 400 nm gemcitabine, 50 nm paclitaxel, or 5 μm 5‐fluorouracil for 24 and 48 h resulted in decreased viability compared to treatment or silencing alone (A). MIA PaCa‐2 cells transfected with nonsilencing (NS) siRNA (B‐I), 400 nm gemcitabine (B‐II), siSP1 (B‐III), or siSP1 + gemcitabine (B‐IV) for 24 h, and probed with a cleaved caspase 3 antibody for apoptosis. Images were acquired at 20× magnification. MIA PaCa‐2 cells transfected with siSP1 and treated with 400 nm gemcitabine or 50 nm paclitaxel for 8 h ± verapamil, and analyzed by flow cytometry (C). MIA PaCa‐2 cells transfected with siSP1 and treated with 400 nm gemcitabine for 24 h to measure total ATP (D) and ATPase (E).
Using a dye efflux assay, we found that gemcitabine and paclitaxel alone both increased the % efflux of MIA PaCa‐2 cells (26.9% and 3.0%, respectively). Conversely, nonsilencing (0.90–1.85%) and siSP1 (0.13–1.18%) had minimal efflux activity. The combination of siSP1 and gemcitabine decreased the % efflux toward baseline (5.83%), whereas siSP1 and paclitaxel modestly decreased efflux (0.70%) (Fig. 5C). We also determined the total ATP and ATPase per condition in MIA PaCa‐2 cells. Gemcitabine alone increased the ATP (4.62) compared to nonsilenced (1.72) and siSP1 (2.92) (Fig. 5D). Gemcitabine with siSP1 decreased the total ATP compared to gemcitabine alone (3.23). The amount of ATPase corresponds with the total cellular ATP, in that gemcitabine had an increase in the ATPase (7.59e−4), indicating that more ATP is being utilized compared to NS (0) or siSP1 (1.41e−4) (Fig. 5E). Gemcitabine with siSP1 decreased the amount of ATPase compared to gemcitabine alone (2.15e−4), indicating that less ATP is being utilized.
3.6. Inhibition of SP1 in vivo overcomes gemcitabine‐induced chemoresistance
In vivo subcutaneous injection of MIA PaCa‐2 cells into athymic nude mice were injected with either saline, 0.3 mg·kg−1 mithramycin (MTH; SP1 inhibitor), 0.6 mg·kg−1 MTH, 50 mg·kg−1 gemcitabine (GEM), 0.3 mg·kg−1 MTH and GEM, or 0.6 mg·kg−1 MTH and GEM. Both combinations of MTH and GEM resulted in less tumor volume (0.3 MTH/GEM 304.0 mm3; 0.6 MTH/GEM 307.9 mm3) than 0.3 mg·kg−1 MTH (365.1 mm3), 0.6 mg·kg−1 MTH (316.3 mm3), or GEM (407.2 mm3) (Fig. 6A). Further, cleaved caspase 3 was increased in both 0.3 MTH/GEM (7.10) and 0.6 MTH/GEM (8.54) groups compared to single treatments (0.3 MTH 6.56; 0.6 MTH 5.91; GEM 5.24) and control (4.31) (Fig. 6B). Figure S5 provides histological evidence that mithramycin sufficiently downregulates (A) SP1 and (B) GRP78.
Figure 6.
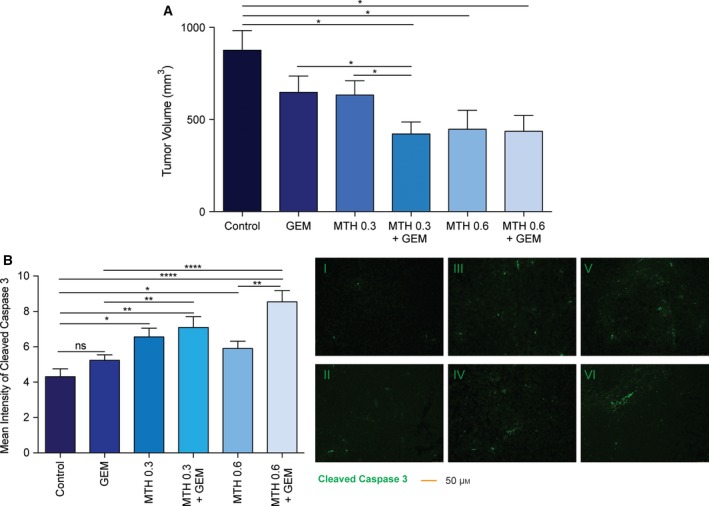
Inhibition of SP1 in vivo overcomes gemcitabine‐induced chemoresistance. MIA PaCa‐2 cells injected subcutaneously into athymic nude mice and treated with gemcitabine (50 mg·kg−1 twice weekly), mithramycin (0.3 mg·kg−1 or 0.6 mg·kg−1 thrice weekly), or a combination of 0.3 mithramycin and gemcitabine, or 0.6 mithramycin and gemcitabine. Tumor volume measured at the endpoint (A). Tumors were probed with a cleaved caspase 3 antibody and quantified with Image J. Images were acquired at 20× magnification (B).
4. Discussion
Various stressful conditions such as hypoxia, nutrient deprivation, pH changes, or poor vascularization can be growth limiting for tumor cells and thus activate the UPR (Avril et al., 2017; Lee, 2007; Ma and Hendershot, 2004). As the cancer cells undergo rapid proliferation, the need for increased protein and other bimolecular synthesis contributes to an increased ER stress response in cancer cells (Avril et al., 2017; Lee, 2007). The ER is the main site for the translation of excess nutrition into metabolic and inflammatory responses. In tumor cells, ER stress may restore homeostasis and make the adjacent environment hospitable for tumor survival and tumor expansion, and thus is considered cytoprotective (Healy et al., 2009; Ma and Hendershot, 2004; Martinon, 2012). This makes the ER stress response one of the key survival responses in cancer.
Chemoresistance in cancer has been shown to occur via a number of mechanisms. Some studies suggest that GRP78 membrane localization contributes to pro‐proliferative pathways (Lee, 2014; Roller and Maddalo, 2013). While GRP78 membrane localization is a novel and interesting concept in cancer biology, our study finds that chemoresistance in pancreatic cancer cells can be mediated by an overexpression and increased activity of ABC transporter genes. Our data show that the expression of a number of genes in this superfamily correlates with the expression of GRP78 (Table 1). The ABC transporters typically efflux the chemotherapeutic drugs from the cells, thereby minimizing their accumulation in the cells. These pumps are regulated by the ATP in the cells and are transcriptionally regulated by the transcription factor, NRF2, which binds to antioxidant response element in the promoter gene of these genes leading to their upregulation. Normal substrates for the ABC transporters include glutathione and glucuronide conjugates, which can be mediated through NRF2‐ARE activity (Choudhuri and Klaassen, 2006; Krishna and Mayer, 2000), which suggests that NRF2 and ABC transporters can alternatively work in tandem to promote chemoresistance. Further, Kras mutations have been shown to increase transcription and basal levels of NRF2 in cancer, which minimize intracellular ROS accumulation and maintain cancer cell survival (DeNicola et al., 2011).
ATP‐binding cassette transporters have been an attractive target for many years, because of their role in chemoresistance (Donmez et al., 2011). A suggested strategy for battling chemoresistance is to decrease the efflux of the ABC transporters (Krishna and Mayer, 2000). Verapamil is a first‐generation MDR modulator, whereas tariquidar and zosuquidar are third‐generation modulators, which have demonstrated fewer pharmacokinetic interactions with anti‐neoplastics (Bisi et al., 2015; Krishna and Mayer, 2000). Downregulation of GRP78 results in sensitizing the pancreatic cancer cells to multiple chemotherapeutic agents currently used in pancreatic cancer (Fig. 2). Our results indicated that this was due to a decrease in the activity of the ABC transporters in these cells. As ABC transporters depend on ATP hydrolysis, we estimated the ATPase activity in pancreatic cancer cells following GRP78 inhibition and drug treatment. GRP78 has ATP‐binding sites to help in protein folding. We demonstrate that siGRP78 modestly increases the total cellular levels of ATP and ATPase, which could indicate that this reduction is partly due to less GRP78 utilization of ATP. Additionally, we have shown that siGRP78 decreases cellular viability, which is also an ATP‐driven mechanism. Interestingly, our data also showed that gemcitabine with siGrp78 decreased the amount of ATPase compared to gemcitabine alone, which could indicate that less ATP is being utilized by the cell to drive ABC transporters (Fig. 3D). Similarly, inhibition of SP1 also showed increased sensitivity to gemcitabine by deregulation of ABC transporters (Fig. 5C) and these effects could be observed both in vitro (Fig. 5) and in vivo (Fig. 6).
There have been many efforts to target the UPR in recent years, including proteasome inhibitors, and inhibitors targeting GRP78, HSP90, PERK, and IRE1alpha (Wang and Kaufman, 2014). GRP78, one of the regulators of the UPR, is an attractive target because it is responsible for maintaining homeostasis in the ER. Recently, a small molecule GRP78 inhibitor called IT‐139 was shown to sensitize chemoresistant PDAC cells to gemcitabine (Gifford et al., 2016). Our previously published data shows that GRP78‐mediated ER homeostasis is dependent on SP1 activity and inhibition of SP1 prevents the homeostasis and pushes the UPR to a chronic ER stress phase, leading to cancer cell death (Dauer et al., 2017).
5. Conclusion
Our current study is clinically relevant, because mithramycin (SP1 inhibitor) is undergoing clinical trials for lung, esophagus, breast, and GI cancers. Interestingly, SP1 and NRF2 have been recently described as nononcogene addiction genes (Hedrick et al., 2016; Kitamura et al., 2017). Thus, understanding the interaction between multiple stress pathways (Unfolded Protein Response, Oxidative Stress) can contribute to development of better therapeutic targets to ameliorate the therapeutic resistance.
Conflict of interest
University of Minnesota has a patent for Minnelide, which has been licensed to Minneamrita Therapeutics, LLC. AKS is the co‐founder and the Chief Scientific Officer of this company. SB is a consultant with Minneamrita Therapeutics, LLC, and this relationship is managed by University of Miami. The remaining authors declare no conflict of interest.
Author contributions
PD, SB, and AS performed conceptualization; PD and SB performed investigation and formal analysis; PD involved in methodology; SB and AS involved in funding acquisition and resource collection; SB and AS involved in project administration; SB and AS supervised the study; VD, SB, and AS validated the study; PD and SB wrote the manuscript; and PD, NSS, VG, AN, SB, and AS reviewed and edited the manuscript.
Supporting information
Fig. S1. Silencing GRP78 combined with chemotherapeutics decreases viability in pancreatic cancer cell lines.
Fig. S2. Silencing GRP78 combined with gemcitabine results in more cell death.
Fig. S3. Verapamil combined with chemotherapeutic compounds decreases cell viability in pancreatic cancer cells.
Fig. S4. SP1 is required for ER homeostasis and affects chemoresistance in pancreatic cancer cells, similarly to GRP78.
Fig. S5. Mithramycin treatment decreases SP1 and GRP78 expression in vivo.
Fig. S6. Evidence of silencing.
Acknowledgements
This study was funded by NIH grants R01‐CA170946 and R01‐CA124723 (to AKS); NIH grant R01‐CA184274 (to SB); Katherine and Robert Goodale Foundation support (to AKS); and Minneamrita Therapeutics LLC (to AKS). The authors would also like to acknowledge the Flow cytometry Core at the Sylvester Cancer Center, University of Miami, for their help with the FACS‐based assays.
References
- ACS (2017) Cancer Facts & Figures 2017. American Cancer Society, 74.
- Avril T, Vauleon E and Chevet E (2017) Endoplasmic reticulum stress signaling and chemotherapy resistance in solid cancers. Oncogenesis 6, e373. [DOI] [PMC free article] [PubMed] [Google Scholar]
- Banerjee S, Sangwan V, McGinn O, Chugh R, Dudeja V, Vickers SM and Saluja AK (2013) Triptolide‐induced cell death in pancreatic cancer is mediated by O‐GlcNAc modification of transcription factor Sp1. J Biol Chem 288, 33927–33938. [DOI] [PMC free article] [PubMed] [Google Scholar]
- Beishline K and Azizkhan‐Clifford J (2015) Sp1 and the ‘hallmarks of cancer’. FEBS J 282, 224–258. [DOI] [PubMed] [Google Scholar]
- Bisi A, Gobbi S, Merolle L, Farruggia G, Belluti F, Rampa A, Molnar J, Malucelli E and Cappadone C (2015) Design, synthesis and biological profile of new inhibitors of multidrug resistance associated proteins carrying a polycyclic scaffold. Eur J Med Chem 92, 471–480. [DOI] [PubMed] [Google Scholar]
- Chartoumpekis DV, Wakabayashi N and Kensler TW (2015) Keap1/Nrf2 pathway in the frontiers of cancer and non‐cancer cell metabolism. Biochem Soc Trans 43, 639–644. [DOI] [PMC free article] [PubMed] [Google Scholar]
- Chevet E, Hetz C and Samali A (2015) Endoplasmic reticulum stress‐activated cell reprogramming in oncogenesis. Cancer Discov 5, 586–597. [DOI] [PubMed] [Google Scholar]
- Chio IIC, Jafarnejad SM, Ponz‐Sarvise M, Park Y, Rivera K, Palm W, Wilson J, Sangar V, Hao Y, Ohlund D et al (2016) NRF2 promotes tumor maintenance by modulating mRNA translation in pancreatic cancer. Cell 166, 963–976. [DOI] [PMC free article] [PubMed] [Google Scholar]
- Choudhuri S and Klaassen CD (2006) Structure, function, expression, genomic organization, and single nucleotide polymorphisms of human ABCB1 (MDR1), ABCC (MRP), and ABCG2 (BCRP) efflux transporters. Int J Toxicol 25, 231–259. [DOI] [PubMed] [Google Scholar]
- Conroy T, Desseigne F, Ychou M, Bouché O, Guimbaud R, Bécouarn Y, Adenis A, Raoul JL, Gourgou‐Bourgade S, de la Fouchardière C et al (2011) FOLFIRINOX versus gemcitabine for metastatic pancreatic cancer. N Engl J Med 364, 9. [DOI] [PubMed] [Google Scholar]
- Dauer P, Gupta VK, McGinn O, Nomura A, Sharma NS, Arora N, Giri B, Dudeja V, Saluja AK and Banerjee S (2017) Inhibition of Sp1 prevents ER homeostasis and causes cell death by lysosomal membrane permeabilization in pancreatic cancer. Sci Rep 7, 1564. [DOI] [PMC free article] [PubMed] [Google Scholar]
- Deniaud E, Baguet J, Chalard R, Blanquier B, Brinza L, Meunier J, Michallet MC, Laugraud A, Ah‐Soon C, Wierinckx A et al (2009) Overexpression of transcription factor Sp1 leads to gene expression perturbations and cell cycle inhibition. PLoS One 4, e7035. [DOI] [PMC free article] [PubMed] [Google Scholar]
- DeNicola GM, Karreth FA, Humpton TJ, Gopinathan A, Wei C, Frese K, Mangal D, Yu KH, Yeo CJ, Calhoun ES et al (2011) Oncogene‐induced Nrf2 transcription promotes ROS detoxification and tumorigenesis. Nature 475, 106–109. [DOI] [PMC free article] [PubMed] [Google Scholar]
- Donmez Y, Akhmetova L, Iseri OD, Kars MD and Gunduz U (2011) Effect of MDR modulators verapamil and promethazine on gene expression levels of MDR1 and MRP1 in doxorubicin‐resistant MCF‐7 cells. Cancer Chemother Pharmacol 67, 823–828. [DOI] [PubMed] [Google Scholar]
- Fernandez PM, Tabbara SO, Jacobs LK, Manning FCR, Tsangaris TN, Schwartz AM, Kennedy KA and Patierno SR (2000) Overexpression of the glucose‐regulated stress gene GRP78 in malignant but not benign human breast lesions. Breast Cancer Res Treat 59, 11. [DOI] [PubMed] [Google Scholar]
- Gifford JB, Huang W, Zeleniak AE, Hindoyan A, Wu H, Donahue TR and Hill R (2016) Expression of GRP78, master regulator of the unfolded protein response, increases chemoresistance in pancreatic ductal adenocarcinoma. Mol Cancer Ther 15, 1043–1052. [DOI] [PubMed] [Google Scholar]
- Healy SJ, Gorman AM, Mousavi‐Shafaei P, Gupta S and Samali A (2009) Targeting the endoplasmic reticulum‐stress response as an anticancer strategy. Eur J Pharmacol 625, 234–246. [DOI] [PubMed] [Google Scholar]
- Hedrick E, Cheng Y, Jin UH, Kim K and Safe S (2016) Specificity protein (Sp) transcription factors Sp1, Sp3 and Sp4 are non‐oncogene addiction genes in cancer cells. Oncotarget 7, 22245–22256 [DOI] [PMC free article] [PubMed] [Google Scholar]
- Hessmann E, Patzak MS, Klein L, Chen N, Kari V, Ramu I, Bapiro TE, Frese KK, Gopinathan A, Richards FM et al (2017) Fibroblast drug scavenging increases intratumoural gemcitabine accumulation in murine pancreas cancer. Gut 67, 497–507. [DOI] [PMC free article] [PubMed] [Google Scholar]
- Kanai M, Wei D, Li Q, Jia Z, Ajani J, Le X, Yao J and Xie K (2006) Loss of Kruppel‐like factor 4 expression contributes to Sp1 overexpression and human gastric cancer development and progression. Clin Cancer Res 12, 6395–6402. [DOI] [PubMed] [Google Scholar]
- Kitamura H, Onodera Y, Murakami S, Suzuki T and Motohashi H (2017) IL‐11 contribution to tumorigenesis in an NRF2 addiction cancer model. Oncogene 36, 6315–6324. [DOI] [PubMed] [Google Scholar]
- Konig J, Hartel M, Nies AT, Martignoni ME, Guo J, Buchler MW, Friess H and Keppler D (2005) Expression and localization of human multidrug resistance protein (ABCC) family members in pancreatic carcinoma. Int J Cancer 115, 359–367. [DOI] [PubMed] [Google Scholar]
- Krishna RM and Mayer LD (2000) Multidrug resistance (MDR) in cancer: mechanisms, reversal using modulators of MDR and the role of MDR modulators in influencing the pharmacokinetics of anticancer drugs. Eur J Pharm Sci 11, 18. [DOI] [PubMed] [Google Scholar]
- Lee AS (2007) GRP78 induction in cancer: therapeutic and prognostic implications. Cancer Res 67, 3496–3499. [DOI] [PubMed] [Google Scholar]
- Lee AS (2014) Glucose‐regulated proteins in cancer: molecular mechanisms and therapeutic potential. Nat Rev Cancer 14, 263–276. [DOI] [PMC free article] [PubMed] [Google Scholar]
- Ma Y and Hendershot LM (2004) The role of the unfolded protein response in tumour development: friend or foe? Nat Rev Cancer 4, 966–977. [DOI] [PubMed] [Google Scholar]
- Martinon F (2012) Targeting endoplasmic reticulum signaling pathways in cancer. Acta Oncol 51, 822–830. [DOI] [PubMed] [Google Scholar]
- Menegon S, Columbano A and Giordano S (2016) The dual roles of NRF2 in cancer. Trends Mol Med 22, 578–593. [DOI] [PubMed] [Google Scholar]
- Molnár J and Zalatnai A (2007) Molecular background of chemoresistance in pancreatic cancer. In Vivo 21, 339–347. [PubMed] [Google Scholar]
- Mujumdar N, Banerjee S, Chen Z, Sangwan V, Chugh R, Dudeja V, Yamamoto M, Vickers SM and Saluja AK (2014) Triptolide activates unfolded protein response leading to chronic ER stress in pancreatic cancer cells. Am J Physiol Gastrointest Liver Physiol 306, G1011–G1020. [DOI] [PMC free article] [PubMed] [Google Scholar]
- Niu Z, Wang M, Zhou L, Yao L, Liao Q and Zhao Y (2015) Elevated GRP78 expression is associated with poor prognosis in patients with pancreatic cancer. Sci Rep 5, 16067. [DOI] [PMC free article] [PubMed] [Google Scholar]
- Palam LR, Gore J, Craven KE, Wilson JL and Korc M (2015) Integrated stress response is critical for gemcitabine resistance in pancreatic ductal adenocarcinoma. Cell Death Dis 6, e1913. [DOI] [PMC free article] [PubMed] [Google Scholar]
- Pang L, Word B, Xu J, Wang H, Hammons G, Huang SM and Lyn‐Cook B (2014) ATP‐binding cassette genes genotype and expression: a potential association with pancreatic cancer development and chemoresistance? Gastroenterol Res Pract 2014, 414931. [DOI] [PMC free article] [PubMed] [Google Scholar]
- Roller C and Maddalo D (2013) The molecular chaperone GRP78/BiP in the development of chemoresistance: mechanism and possible treatment. Front Pharmacol 4, 10. [DOI] [PMC free article] [PubMed] [Google Scholar]
- Shen J, Ha DP, Zhu G, Rangel DF, Kobielak A, Gill PS, Groshen S, Dubeau L and Lee AS (2017) GRP78 haploinsufficiency suppresses acinar‐to‐ductal metaplasia, signaling, and mutant Kras‐driven pancreatic tumorigenesis in mice. Proc Natl Acad Sci USA 114, E4020–E4029. [DOI] [PMC free article] [PubMed] [Google Scholar]
- Wang M and Kaufman RJ (2014) The impact of the endoplasmic reticulum protein‐folding environment on cancer development. Nat Rev Cancer 14, 581–597. [DOI] [PubMed] [Google Scholar]
- Zhao L, Zhao Y, Schwarz B, Mysliwietz J, Hartig R, Camaj P, Bao Q, Jauch KW, Guba M, Ellwart JW et al (2016) Verapamil inhibits tumor progression of chemotherapy‐resistant pancreatic cancer side population cells. Int J Oncol 49, 99–110. [DOI] [PMC free article] [PubMed] [Google Scholar]
Associated Data
This section collects any data citations, data availability statements, or supplementary materials included in this article.
Supplementary Materials
Fig. S1. Silencing GRP78 combined with chemotherapeutics decreases viability in pancreatic cancer cell lines.
Fig. S2. Silencing GRP78 combined with gemcitabine results in more cell death.
Fig. S3. Verapamil combined with chemotherapeutic compounds decreases cell viability in pancreatic cancer cells.
Fig. S4. SP1 is required for ER homeostasis and affects chemoresistance in pancreatic cancer cells, similarly to GRP78.
Fig. S5. Mithramycin treatment decreases SP1 and GRP78 expression in vivo.
Fig. S6. Evidence of silencing.