

Abstract
Objective
Procedural sedation with propofol is widely used in the pediatric population. A well‐known side effect of propofol is a decrease in peripheral vascular resistance resulting in hypotension, but little is known about the effects on microcirculation in humans. We aimed to evaluate the effects of propofol on the sublingual microcirculatory perfusion by continuous video imaging in pediatric patients undergoing procedural sedation.
Methods
Patients admitted to the Pediatric Intensive Care Unit for procedural sedation were recruited. Oral microcirculation was measured employing a continuous monitoring strategy with incident dark‐field illumination imaging. Measurements were obtained before and 3 minutes after propofol induction. Total and perfused vessel densities, proportion of perfused vessels, microvascular flow index, blood vessel diameter (Øbv), and systemic hemodynamics were analyzed.
Results
Continuous measurements were achieved in seven patients. Three minutes after propofol induction mean arterial pressure decreased (P = 0.028) and total and perfused vessel densities increased by 12% (P = 0.018) and 16% (P = 0.018), respectively. MFI was unaltered and mean Øbv increased but not significantly.
Conclusions
Propofol induction induces a reduction in mean arterial pressure and a rise in sublingual microvascular perfusion. The observed effects of propofol on the sublingual microcirculation may be due to a decrease in microvascular resistance.
Keywords: microcirculation, pediatric, procedural sedation, propofol
Abbreviations
- AVA
automated vascular analysis
- CC
CytoCam
- CMOS
complementary metal‐oxide semiconductor
- DBP
diastolic blood pressure
- fps
frames per second
- Hb
hemoglobin
- HR
heart rate
- IDFI
incident dark‐field imaging
- LEDs
light‐emitting diodes
- MAP
mean arterial pressure
- MFI
microvascular flow index
- Øbv
blood vessel diameter
- OPSI
orthogonal polarization spectral imaging
- PICU
pediatric intensive care unit
- PPV
proportion of perfused vessels
- PVD
perfused vessel density
- RBC(s)
red blood cell(s)
- ROI(s)
region of interest(s)
- SBP
systolic blood pressure
- SDFI
sidestream dark‐field imaging
- SD
standard deviation
- SpO2
peripheral capillary oxygen saturation
- TVD
total vessel density
- μm
micrometer(s)
1. INTRODUCTION
Procedural sedation is widely used in pediatric patients to perform mild to moderate invasive procedures. Because of fast induction and recovery, propofol is often used for procedural sedation. Although some macrocirculatory side effects such as hypotension and apnea are well known, it still has the advantage of rapid recovery. However, limited information exists on alterations of the microcirculatory perfusion induced by propofol in humans.
The information microcirculation can yield regarding the health status of a pediatric patient may be underestimated. Depending on physiological demands, microcirculation is able to compensate for alterations in vascular resistance, cardiac output, and blood pressure.1 It is well known that in critically ill patients microcirculation is impaired and that propofol is often used for sedation in these patients.2, 3 Therefore, it is of particular interest to examine what effects propofol elicits on the microcirculation of relatively healthy patients with intact microcirculation. Only one study regarding propofol and its effects on healthy human sublingual microcirculation was reported and showed that after induction with propofol, capillary blood flow was reduced.4 Measurements were obtained intermittently in adults using orthogonal polarization spectral imaging (OPSI); however, intermittent measurements may not be the best way to examine and ascertain sublingual microcirculation since it is not possible to obtain the same oral microvascular network image to compare effects after medication is administered. For this reason, it is not possible to compare small changes in the same vascular network to determine microcirculatory changes over time in response to propofol. Moreover, intermittent measurements may result in investigator bias based on the choice of a different region of interest (ROI) for comparison.
Several pediatric studies using different imaging techniques such as OPSI and sidestream dark‐field imaging (SDFI) have been performed, observing the effects of surgery and critical care therapy on the oral microcirculation of critically ill patients,5, 6, 7 although, to date, no experimental design has implemented a continuous monitoring‐based approach in the awake and relatively healthy pediatric patient.
The aim of this study was to determine the effects of propofol on sublingual microcirculation in relatively healthy pediatric patients during propofol induction and to test the hypothesis that propofol elicits quantifiable changes reflecting improved oral microcirculatory perfusion. To determine the effects of propofol, we used a novel approach with continuous video imaging measurements of the microcirculation. Continuous measurement is defined as the observation of the same microvascular network (ROI) in time. To investigate the feasibility of continuous video measuring in fully awake pediatric patients, we conducted a pilot study for sample size calculation for further research.
2. MATERIALS AND METHODS
This single‐center pilot study was performed between February 2015 and August 2017. The study was conducted at the Sedation Unit of the PICU of the Emma Children's Hospital of the Academic Medical Center. The procedures and guidelines for this study were reviewed and approved by the Institutional Medical Ethics Board of the Academic Medical Center (No. NL51821.018.14). Eligible patients and their parents received detailed information about the study procedure before signed informed consent was obtained from both parents and the child, if >12 years old. The study was conducted in accordance with the principles established in the Declaration of Helsinki (Fortaleza, October 2013) and the Medical Research Involving Human Subjects Act (WMO) in the Netherlands.
2.1. Study participants
All patients of 8‐18 years, with ASA I and II classification, scheduled for elective procedural sedation with propofol were eligible. The investigating pediatric intensivist (MAR) informed the parents or legal guardians and the patient about the study 1 week prior to the time of admission. Patient exclusion criteria were: prior history of oral diseases and/or dental/oral surgery <6 months, absence of written informed consent, and ASA classification >II.
Demographic characteristics were recorded and included gender, weight, underlying disease, and medication use. Basic hemodynamics and oxygenation parameters were recorded and included heart rate (HR), systolic blood pressure (SBP), diastolic blood pressure (DBP), mean arterial blood pressure (MAP), and peripheral capillary oxygen saturation (SpO2). Hemodynamic parameters were obtained prior to propofol administration at baseline (T0) and continued until 3 minutes after propofol administration (T1).
2.2. Procedural sedation
A standardized procedural sedation protocol was used for all patients. Patients were connected to a monitor (IntelliVue Neonatal, Philips, Eindhoven, The Netherlands) for recording HR and blood pressure. SpO2 was recorded with a SpO2 sensor (Nellcor, Covidien, Medtronic, Dublin, Ireland), blood pressure was measured non‐invasively with cuff on the upper arm every 3 minutes (Philips, Eindhoven, The Netherlands), and capnography with a CO2 nasal/oral sampling cannula with O2 connector (Smart CapnoLine Plus, Microstream, Oridion, Covidien, Dublin, Ireland). A time‐out procedure was performed by the medical team for patient safety, to confirm the correct procedure and patient. Thereafter, the patient was asked to lay on his/her left side after which the camera was placed in the proper position under the tongue.
To perform continuous video measuring, a clear vascular landmark was needed, such as a typical vein bifurcation or vascular crossing in the background. Continuous measurement was defined as the observation of the same ROI in time and is used as such throughout the manuscript. After a good landmark was found, a baseline video‐clip was recorded (T0), directly followed by induction with 2‐3 mg/kg propofol (Propofol 10 mg/mL MCT/LCT, Fresenius Kabi GmbH, Graz, Austria). Video‐clips were recorded continuously until 3 minutes after induction (T1) on the exact same microvascular network. All inductions were carried out by the same sedation practitioner under the same circumstances. No vasopressor agents were used to maintain blood pressure as standard of care.
2.3. Microcirculation imaging instrument
Harnessing the ability of hemoglobin (Hb) to spectroscopically absorb green light (530 nm), incident dark‐field illumination imaging (IDFI) (CytoCam (CC), Braedius Medical BV, Huizen, The Netherlands) was used for continuous monitoring of the sublingual microcirculation.8, 9 With enhanced image resolution and a larger field of view in comparison to the OPSI and SDFI instrument, the sensor‐based computer‐controlled high‐resolution (14 megapixel, 25 fps) CC empowers the investigator with a detailed appraisal of anatomy and micro‐hemodynamics of the microcirculation.8, 9, 10 It operates by epi‐illuminating the surface of a ROI with concentrically arranged light‐emitting diodes (LEDs) placed around the exterior tip of the probe light guide. LEDs emit pulsed (2 ms) green light directly onto the surface of the tissue of interest, which is then scattered and absorbed by Hb in RBCs. The absorbed light produces clear images of dark intraluminal circulating globules contrasted by a light background. Microcirculation imaging is recorded using a 4 × objective lens system (237 × onscreen magnification), which is then captured by a CMOS digital sensor with a 4416 × 3312‐pixel resolution, producing a 1.80 (1.55 × 1.16) mm2 imaged tissue segment. Each measurement was recorded for 4 seconds and stored on a fanless medical grade panel PC (Braedius Medical BV) equipped with the CCTools software (CytoCamTools Camera Manager v1.7.12, Braedius Medical BV) for camera operation and video data processing.
2.4. Microcirculation measurement procedures
All procedural sedations and data acquisitions were obtained in the same patient room at the PICU kept at a constant temperature of 21 ± 1°C. Before the procedure started, the camera and computer were showed to the patient. The patient was encouraged to hold the camera themselves and to try viewing their own microcirculation; the aim was to show that the measurement was not invasive and to stimulate participation.
Before starting the measurement, the patient was asked to turn on their left side so the investigator could see and gain easy access to the left sublingual ROI. Each participant was asked to relax their tongue and to breathe through their mouth. During the measurements, the probe was only manually kept in place using a modified pen grip, a precision grip used by dentists for instrument micromanipulation.11 An experienced investigator (DMJM) performed all measurements.
The CC probe was covered with a disposable plastic cap (CytoCam Protection Caps, Braedius Medical BV) and draped with a large (power‐free) latex examination glove (Klinion® Protection, Medico BV, Oud‐Beijerland, The Netherlands) with the probe protruding through the cut off tip of the middle finger to protect the probe from direct contact with saliva and moisture intraorally. The lens was placed gently at a right‐angle directly into contact over the left sublingual region (floor of the mouth) adjacent to the frenulum linguae, immediately posterior to the sublingual caruncle and the sublingual fold. Brightness was set at 450 for all measurements. After a microvascular landmark was chosen, proper focus was adjusted and image stability free of motion and pressure‐induced artifacts was achieved by asking the patient to lay still and not to swallow. A 4‐seconds video‐clip was obtained at T0, followed by continuous recording as described above.
2.5. Microcirculation analysis
A comparison within the same microvascular network was analyzed from video‐clips at T0 and T1. Angioarchitecture was determined as a score of either 1 (array of capillary loops), 2 (hybrid of capillary loops and networks), or 3 (microvascular networks only).12 The Automated Vascular Analysis software package (AVA v3.02, Microscan BV, Amsterdam, The Netherlands), using a CC calibration setting (horizontal pitch = 1.306944, vertical pitch = 1.289930), was used for image stabilization and semi‐automatic analyses. Microcirculation data for all vessels were analyzed for total and perfused vessel density (TVD and PVD; mm vessel/mm2), proportion of perfused vessels (PPV; (PPV/TVD) × 100),13 and microvascular flow index (MFI; scoring based on the predominant flow type in four quadrants defined as absent [0], intermittent [1], sluggish [2], or continuous [3]).14, 15, 16 Analysis of blood vessel diameter (Øbv) has been described elsewhere.7 In brief, Øbv was obtained by randomly selecting five vessels in each quadrant (20 total) at T0 recording and comparing to T1. Vascular landmarks were selected to obtain reproducible measurements of the exact same vessels.
Before initiating sublingual microcirculation analysis, a training and validation was conducted to assess analytical technique aptitude; the reliability and reproducibility between 4 examiners (DMJM, MAR, CIE, YF) were confirmed using an intraclass correlation coefficient (ICC). Measurements from five patients at T0 and T1 were analyzed at random for PVD by each investigator. After achieving excellent agreement among the examiners (ICC = 0.840; P < 0.05), the remaining data analysis was completed blinded and at random by two investigators (CIE, YF).
2.6. Statistical analysis
Previously published studies on sublingual microcirculation research, based on continuous measurements, report sample sizes similar to the patient inclusions of this investigation that were sufficiently sensitive to achieve statistical relevance.7, 17, 18, 19 To examine normal distribution of all parameters and microcirculation data, a Shapiro‐Wilk test was performed. To adjust for inherent biological variations between each subject's TVD, PVD and Øbv parameters were normalized with respect to baseline and converted into percentages for ease in data presentation and statistical examination.
Comparative analyses of hemodynamic and microcirculation parameters were analyzed using a Wilcoxon signed‐rank test (continuous and non‐continuous data). Differences with a P‐value <0.05 were regarded as statistically significant. All data analyses were performed using IBM SPSS statistics software package (IBM® SPSS® Statistics v24, IBM Corp., Armonk, NY, USA) and are presented accordingly as either median (range) or mean ± SD.
3. RESULTS
In total, 20 patients were enrolled (12 female, 8 male) and in 7 patients (6 females, 1 male) (35%) continuous measurements were successful. The reason for failure was only patient related and resulted in loss of the initial ROI due to yawning (primarily) or unintended movements of the patient during induction. The results presented here concern only the 7 successful continuous measurements. Descriptive demographics of the participants are presented in Table 1. The patients were diagnosed with: acute lymphatic leukemia (n = 2), nodular sclerosis Hodgkin lymphoma (n = 1), acute myeloid leukemia (n = 2), T‐cell non‐Hodgkin lymphoma (n = 1), and Crohn's disease (n = 1).
Table 1.
Patient demographics (n = 7)
| Variable | ||
|---|---|---|
| Age [y] | 15 | [10‐18] |
| Weight [kg] | 52 | [40‐63] |
| Gender [F:M] | 6 | 1 |
| Propofol induction [mg/kg] | 2.5 | [2‐3] |
Gender female:male ratio was 6:1. Data presented as median [range].
Table 2 presents a summary of the obtained hemodynamic parameters; data were compared before and 3 minutes after propofol induction. After induction a significant decrease in SBP (P = 0.028), DBP (P = 0.028), and MAP (P = 0.027) was found compared to T0. There was no difference in HR and SpO2 between T0 and T1.
Table 2.
Hemodynamic parameters before induction with propofol (T0) and 3 min after induction (T1)
| T0 | T1 | P‐value | |
|---|---|---|---|
| HR [bpm] | 78 [67 ‐ 101] | 77 [61 ‐ 99] | 0.731 |
| SBP [mm Hg] | 105 [95 ‐ 157] | 91 [77 ‐ 113] | 0.028 |
| MAP [mm Hg] | 68 [57 ‐ 110] | 58 [43 ‐ 72] | 0.028 |
| DBP [mm Hg] | 53 [38 ‐ 84] | 45 [26 ‐ 63] | 0.027 |
| SpO2 [%] | 100 [99 ‐ 100] | 100 [100] | 0.109 |
DBP, diastolic blood pressure; HR, hear rate; MAP, mean arterial pressure; SBP, systolic blood pressure; SpO2 peripheral capillary oxygen saturation.
Data presented as median [range].
P‐values: T0 vs T1; based on Wilcoxon signed‐rank test.
Bold P‐values indicate statistical significance.
The CC images were of excellent quality, the mucosa of the floor of the mouth provided sufficient contrast with the microcirculation and high‐resolution video‐clips were recorded, and 2 clip samples per patient were analyzed (14 in total). The median focal depth of the measurements was 160 μm (range 90‐200 μm). Sublingual angioarchitecture was uniformly scored as class 3 in all patients. Typical frames of the sublingual area acquired by CC are presented in Figure 1. Sublingual microcirculatory data are presented in Table 3. A statistically significant increase was found in TVD and PVD at T1 compared to baseline (P = 0.018 and P = 0.018, respectively); normalized mean TVD and PVD increased by 12% and 16%, respectively, and Øbv and MFI did not change significantly.
Figure 1.
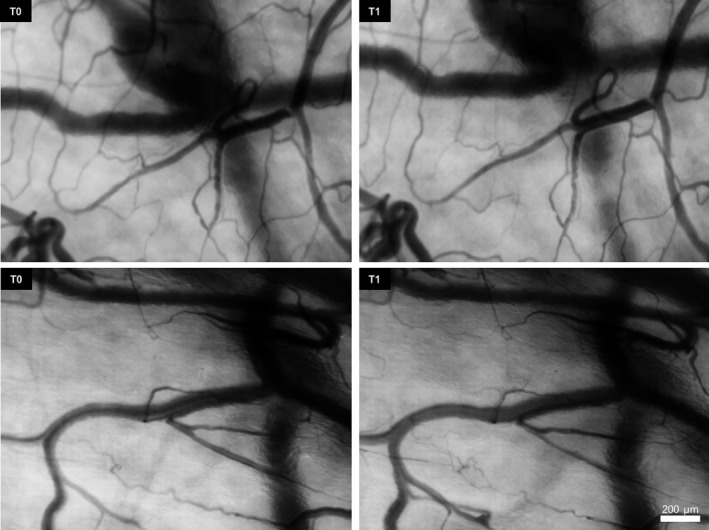
Sample Sequences of Continuous Sublingual Microcirculation Measurements Obtained With the CytoCam in Two Different Pediatric Patients. Each sequence of images reveals the same target site at baseline (T0) and 3 min later after propofol administration (T1)
Table 3.
Sublingual microcirculatory statistics (all vessels) before (T0) and 3 min after induction with propofol (T1)
| T0 | T1 | P‐value | |||
|---|---|---|---|---|---|
| TVD [mm/mm2] | 17 ± 2 | [13 ‐ 20] | 20 ± 3 | [13 ‐ 24] | 0.018 |
| TVD [%] | 100 ± 0 | 112 ± 7 | 0.018 | ||
| PVD [mm/mm2] | 17 ± 3 | [13 ‐ 20] | 19 ± 3 | [13 ‐ 24] | 0.018 |
| PVD [%] | 100 ± 0 | 116 ± 9 | 0.018 | ||
| PPV [%] | 94 ± 9 | [74 ‐ 100] | 99 ± 3 | [92 ‐ 100] | 0.068 |
| Øbv [μm] | 8 ± 1 | [8 ‐ 10] | 10 ± 2 | [8 ‐ 12] | 0.237 |
| Øbv [%] | 100 ± 0 | 113 ± 23 | 0.229 | ||
| ∆Øbv [μm] | 0 ± 0 | −1 ± 2 | [‐4 ‐ 1] | 0.237 | |
| MFI [0,1,2,3] | 3 ± 0 | 3 ± 0 | 0.083 | ||
MFI, microvascular flow index; Øbv, blood vessel diameter; PPV, proportion of perfused vessels; PVD, perfused vessel density; TVD, total vessel density.
The negative in front of blood vessel diameter change (∆Øbv) indicates vasodilation. Data presented as mean ± SD and [range].
P‐values: T0 vs T1; based on Wilcoxon signed‐rank test.
Bold P‐values indicate statistical significance.
4. DISCUSSION
The aims of this study were to investigate alterations in the sublingual microcirculation under the influence of propofol‐mediated sedation and to determine feasibility of continuous video measuring in fully awake pediatric patients. The results show that propofol elicits improvement of sublingual microvascular perfusion despite minute changes in blood vessel diameter toward vasodilation. Additionally, propofol induction resulted in a significant decrease in measured blood pressures. We applied a novel and unique approach to measure transition from a conscious state to an unconscious sedation state in real‐time in pediatric patients. To perform continuous video recording of the oral region in fully awake children is extremely challenging.
Our observations on propofol‐mediated procedural sedation also indicate a significant decrease in MAP. In animals, propofol induces a decrease of 20% in MAP and an increase Øbv of 21% in small venules and collecting venules in striated muscle imaged by intravital fluorescence microscopy.20 Although it is difficult to compare animal data with humans, we can certainly say that as far as systemic parameters and small venules (sublingual region is largely venous) are concerned, the trends from their parameters share a likeness to the data presented in this report.
In a study using OPSI,4 a 17% reduction in sublingual small vessel (<20 μm) density after propofol induction was reported in female adults undergoing a transvaginal oocyte retrieval procedure. No significant differences were found in arterial pressure and HR between baseline nor during propofol induction. In contrast, the results from our study show a significant improvement in sublingual perfusion with a rise of 16% in small vessel density, a 5% improvement in PPV, and a reduction in MAP of 15%. Unfortunately, a direct comparison between the two studies is difficult as both measurement and sublingual sites differ considerably. Another difference between these studies is the cardiopulmonary interactions related to positive pressure ventilation compared to spontaneous breathing.21 To this end, we strived to examine in a physiological model the influence of propofol on blood flow of a single drug. Nevertheless, we achieved continuous video microscopy of the same microvascular network prospectively and in relatively healthy pediatric patients free from potential age‐related co‐morbidities, which is a strength of our study.
First‐generation microcirculation devices used OPSI technique,22 which produced a limited field of view whilst the devices required several peripherals for operation.23 The next‐generation SDFI device used a technique that eliminated the need for an orthogonally placed filter and enhanced practicality of the handheld device for applications requiring mobility and low electrical power with fewer peripherals. The newest generation of optical spectroscopic‐based video microscopes is the CC, which utilizes a sensor with optics and an IDFI technique similar to OPSI and SDFI with sharper and greater image definition than its predecessors.8, 9 The CC is compact and lighter, enabling greater ease for the operator to achieve fine control, prolonged usage, and reducing image pressure and drift artifacts. High‐quality images provide more accurate judgment of RBC flow and discerning differences between vessel types.
Successful continuous measurements were only possible when the CC probe was kept stable on the target site in the ROI. The more stable the probe is maintained, the more accurate the analysis will be between two recorded clips. Data analysis software, like AVA, corrects the frames of the imaged clips for these very minor picture movements; this leads to similar frames for both clips with the same microvascular network in the frames. For this reason, while analyzing, the exact same target microvascular network was maintained inside each frame and was compared between both clips. Indeed, the possibility of a minor bias could exist, but not to the degree of recording a completely different microvascular network in a ROI during intermittent measurements.
The measurements in this study were extremely challenging because they were attempted in an awake and conscious pediatric patient and were continued continuously throughout the sedation procedure. Hence, maintaining a good setup and communication with the patient was important, not only for the stability of the investigator holding the CC, but also for the comfort of the patient. Failure of continuous measurement was only patient related with yawning being the most common reason, despite best efforts of holding the CC stable. Involuntary propofol‐induced yawning is a common side effect and occurs in 54% of the cases.24 Yawning resulted in immediate measurement failure because of considerable camera displacement and loss of the target network for the follow‐up measurement at T1. Other involuntary movements can also complicate obtaining the measurements by rendering the baseline measurement invalid for comparison with a subsequent measurement. Other confounding variables might be patient age, underlying disease, and the administration rate of propofol. Perhaps target‐controlled infusion or faster infusion of the propofol could have helped bypass the yawning effect even though each patient reacts differently to propofol.
A few points of consideration should be addressed regarding proper setup and communication between patient, staff, and investigators. The floor of the mouth and tongue are largely muscular in structure and both the microcirculation of the muscles and overlaying mucosa are sensitive to temperature changes. A microcirculation study in cooled (8°C) striated muscles in hamsters showed a decrease in blood flow velocity, PVD, and Øbv in arterioles, venules, and capillaries.25 Although the oral cavity will not reach very cool temperatures when mouth breathing, oral cooling should be a factor to consider when standardizing research design as it may complicate data interpretation. IDFI exhibits a two‐dimensional imaging of a three‐dimensional vascular network and the data do not represent an ideal histological situation in which the underlying vasculature in the mucosal cross‐section also affects the outcomes. This can explain in part why the Øbv data were not significant despite a marginal vasodilation effect with respect to increased tissue perfusion represented by a rise in measured vessel density. It is interesting that no significant difference was found in Øbv despite measurements presenting a rise in vasodilation. The inductions were carried out by only one sedation practitioner and were all done under the same circumstances and with the same dosage of propofol. However, we did not measure serum propofol concentrations at T1. Using a propofol target‐controlled infusion delivery for induction would have resulted in stable serum concentrations but these algorithms are only validated in adult patients but not in pediatric patients and is therefore not reliable. To strengthen the difference in TVD, PVD, and Øbv at T1, it would have been advantageous to have measured the propofol concentration in each patient. However, although propofol was injected at approximately the same rate by the same person, we believe that a target‐controlled infusion delivery would not have been more accurate. It is also possible that a follow‐up of 3 minutes may not have been enough to demonstrate significant differences in microcirculatory perfusion as represented by Øbv. In this pilot study, we chose 3 minutes to ascertain if continuous measurements were indeed achievable and to cap time to maintain patient safety. The first minutes after induction, the patient is at risk of apnea, which is usually followed by desaturation, requiring intervention (oxygen therapy or ventilation) and would have resulted in displacement of the imaging camera and loss of the measurement in the ROI; to reduce the risk of apnea and intervention, follow‐up was not continued to 5 minutes.
In conclusion, this is the first study determining the effects of propofol using a continuous video microscopy approach in a procedural sedation setting. Within the scope of this clinical study, propofol elicits (although small) measurable microvascular vasodilation changes and raises the overall perfusion of the sublingual microcirculation 3 minutes after administration in relatively healthy children. Harmonizing communication and cooperation between patient, staff, and the investigators is essential for achieving the best chance of obtaining a successful continuous measurement in awake pediatric patients undergoing sedation with propofol. Next to vasodilatory effects on the macrocirculation, propofol also elicits a vasodilatory effect on microcirculation. However, it is feasible to conduct continuous video imaging of the oral microcirculation during induction with propofol in fully awake pediatric patients but a high number of participants are needed to obtain enough successful measurements. Future research should focus systematically on different propofol infusion rates and its influence on the sublingual microcirculation in already sedated patients.
PERSPECTIVE
We reported for the first time continuous measurements of the sublingual vascular network in awake pediatric patients during propofol induction. Propofol enhanced the microcirculatory perfusion shortly after induction and may be due to a decrease in microvascular resistance. Future studies should focus on continuous imaging of the microcirculation in sedated pediatric patients.
CONFLICT OF INTEREST
The authors declare no conflicts of interest.
AUTHOR CONTRIBUTION
Study design (MAR, DMJM); conduct of study (MAR, DMJM); collection of data (MAR, DMJM); analysis and management of data (MAR, CIE, YF, DMJM); interpretation of data and preparation of manuscript (MAR, DMJM); intellectual content review and approval of final manuscript draft (MAR, DMJM).
ACKNOWLEDGMENTS
We would like to thank Frans Luteijn, sedation practitioner, for all the inductions and the dentistry students, Cem Ergin and Yaphet Fictoor, for their assistance on the blood vessel analysis. We also would like to thank all the patients and their parents for their interest and participation in this investigation. The cooperation, patience, and continued support of the medical staff involved with the procedural sedations are greatly appreciated.
Riedijk MA, Milstein DMJ. Imaging sublingual microcirculatory perfusion in pediatric patients receiving procedural sedation with propofol: A pilot study. Microcirculation. 2018;25:e12484 10.1111/micc.12484
Funding information
Funding provided from department and institutional sources only.
REFERENCES
- 1. Hamlin SK, Parmley CL, Hanneman SK. Microcirculatory alterations in shock states. Crit Care Nurs Clin North Am. 2014;26:399‐412. [DOI] [PubMed] [Google Scholar]
- 2. Penna GL, Fialho FM, Kurtz P, et al. Changing sedative infusion from propofol to midazolam improves sublingual microcirculatory perfusion in patients with septic shock. J Crit Care. 2013;28:825‐831. [DOI] [PubMed] [Google Scholar]
- 3. Liu X, Zhang K, Wang W, et al. Dexmedetomidine versus propofol sedation improves sublingual microcirculation after cardiac surgery: a randomized controlled trial. J Cardiothorac Vasc Anesth. 2016;30:1509‐1515. [DOI] [PubMed] [Google Scholar]
- 4. Koch M, De Backer D, Vincent JL, Barvais L, Hennart D, Schmartz D. Effects of propofol on human microcirculation. Br J Anaesth. 2008;101:473‐478. [DOI] [PubMed] [Google Scholar]
- 5. Top AP, Ince C, Van Dijk M, Tibboel D. Changes in buccal microcirculation following extracorporeal membrane oxygenation in term neonates with severe respiratory failure. Crit Care Med. 2009;37:1121‐1124. [DOI] [PubMed] [Google Scholar]
- 6. Weidlich K, Kroth J, Nussbaum C, et al. Changes in microcirculation as early markers for infection in preterm infants‐an observational prospective study. Pediatr Res. 2009;66:461‐465. [DOI] [PubMed] [Google Scholar]
- 7. Tytgat SH, Van der Zee DC, Ince C, Milstein DM. Carbon dioxide gas pneumoperitoneum induces minimal microcirculatory changes in neonates during laparoscopic pyloromyotomy. Surg Endosc. 2013;27:3465‐3473. [DOI] [PubMed] [Google Scholar]
- 8. Aykut G, Veenstra G, Scorcella C, Ince C, Boerma C. CytoCam‐IDF (incident dark field illumination) imaging for bedside monitoring of the microcirculation. Intensive Care Med Exp. 2015;3:1‐10. [DOI] [PMC free article] [PubMed] [Google Scholar]
- 9. Hutchings S, Watts S, Kirkman E. The CytoCam video microscope. A new method for visualising the microcirculation using Incident Dark Field technology. Clin Hemorheol Microcirc. 2016;62:261‐271. [DOI] [PubMed] [Google Scholar]
- 10. Milstein DM, Romay E, Ince C. A novel computer‐controlled high resolution video microscopy system enables measuring mucosal subsurface focal depth for rapid acquisition of oral microcirculation video images. Intensive Care Med. 2012;38:S271. [Google Scholar]
- 11. Rucker LM. Performance simulation: the method. J Res Educ. 1987;4:276‐350. [Google Scholar]
- 12. Weber MA, Milstein DM, Ince C, Oude Rengerink K, Roovers JP. Vaginal microcirculation: non‐invasive anatomical examination of the micro‐vessel architecture, tortuosity and capillary density. Neurourol Urodyn. 2015;34:723‐729. [DOI] [PubMed] [Google Scholar]
- 13. De Backer D, Hollenberg S, Boerma C, et al. How to evaluate the microcirculation: report of a round table conference. Crit Care. 2007;11:R101. [DOI] [PMC free article] [PubMed] [Google Scholar]
- 14. Spronk PE, Ince C, Gardien MJ, Mathura KR, Oudemans‐van Straaten HM, Zandstra DF. Nitroglycerin in septic shock after intravascular volume resuscitation. Lancet. 2002;360:1395‐1396. [DOI] [PubMed] [Google Scholar]
- 15. Boerma EC, Mathura KR, van der Voort PH, Spronk PE, Ince C. Quantifying bedside‐derived imaging of microcirculatory abnormalities in septic patients: a prospective validation study. Crit Care. 2005;9:R601‐R606. [DOI] [PMC free article] [PubMed] [Google Scholar]
- 16. Trzeciak S, Dellinger RP, Parrillo JE, et al. Early microcirculatory perfusion derangements in patients with severe sepsis and septic shock: relationship to hemodynamics, oxygen transport, and survival. Ann Emerg Med. 2007;49:88‐98. [DOI] [PubMed] [Google Scholar]
- 17. Milstein DM, Helmers R, Hackmann S, Belterman CN, van Hulst RA, de Lange J. Sublingual microvascular perfusion is altered during normobaric and hyperbaric hyperoxia. Microvasc Res. 2016;105:93‐102. [DOI] [PubMed] [Google Scholar]
- 18. Dirkes MC, Milstein DM, Heger M, van Gulik TM. Absence of hydrogen sulfide‐induced hypometabolism in pigs: a mechanistic explanation in relation to small nonhibernating mammals. Eur Surg Res. 2015;54:178‐191. [DOI] [PubMed] [Google Scholar]
- 19. Kildal AB, Stenberg TA, Sanden E, Myrmel T, How OJ. J Appl Physiol. 2015;118:965‐970. [DOI] [PubMed] [Google Scholar]
- 20. Holzmann A, Schmidt H, Gebhardt MM, Martin E. Propofol‐induced alterations in the microcirculation of hamster striated muscle. Br J Anaesth. 1995;75:452‐456. [DOI] [PubMed] [Google Scholar]
- 21. Bronicki RA, Penny DJ, Anas NG, Fuhrman B. Cardiopulmonary interactions. Pediatr Crit Care Med. 2016;17:S182‐S193. [DOI] [PubMed] [Google Scholar]
- 22. Groner W, Winkelman JW, Harris AG, et al. Orthogonal polarization spectral imaging: a new method for study of the microcirculation. Nat Med. 1999;5:1209‐1212. [DOI] [PubMed] [Google Scholar]
- 23. Goedhart PT, Khalilzada M, Bezemer R, Merza J, Ince C. Sidestream Dark Field (SDF) imaging: a novel stroboscopic LED ring‐based imaging modality for clinical assessment of the microcirculation. Opt Express. 2007;15:15101‐15114. [DOI] [PubMed] [Google Scholar]
- 24. Tsou CH, Kao T, Fan KT, Wang JH, Luk HN, Koenig HM. Clinical assessment of propofol‐induced yawning with heart rate variability: a pilot study. J Clin Anesth. 2008;20:25‐29. [DOI] [PubMed] [Google Scholar]
- 25. Thorlacius H, Vollmar B, Westermann S, Törkvist L, Menger MD. Effects of local cooling on microvascular hemodynamics and leukocyte adhesion in the striated muscle of hamsters. J Trauma. 1998;45:715‐719. [DOI] [PubMed] [Google Scholar]