

Abstract
The anaplastic lymphoma kinase (ALK) rearrangement defines a distinct molecular subtype of non‐small cell lung cancer (NSCLC). Despite the excellent initial efficacy of ALK inhibitors in patients with ALK+ lung cancer, resistance occurs almost inevitably. To date, there is no reliable biomarker allowing the identification of patients at higher risk of relapse. Here, we analysed a subset of 53 ALK+ tumours with and without TP53 mutation and ALK+ NSCLC cell lines by NanoString nCounter technology. We found that the co‐occurrence of early TP53 mutations in ALK+ NSCLC can lead to chromosomal instability: 24% of TP53‐mutated patients showed amplifications of known cancer genes such as MYC (14%), CCND1 (10%), TERT (5%), BIRC2 (5%), ORAOV1 (5%), and YAP1 (5%). MYC‐overexpressing ALK+ TP53‐mutated cells had a proliferative advantage compared to wild‐type cells. ChIP‐Seq data revealed MYC‐binding sites within the promoter region of EML4, and MYC overexpression in ALK+ TP53‐mutated cells resulted in an upregulation of EML4–ALK, indicating a potential MYC‐dependent resistance mechanism in patients with increased MYC copy number. Our study reveals that ALK+ NSCLC represents a more heterogeneous subgroup of tumours than initially thought, and that TP53 mutations in that particular cancer type define a subset of tumours that harbour chromosomal instability, leading to the co‐occurrence of pathogenic aberrations. © 2018 The Authors. The Journal of Pathology published by John Wiley & Sons Ltd on behalf of Pathological Society of Great Britain and Ireland.
Keywords: TP53, chromosomal instability, ALK+ adenocarcinoma, lung cancer
Introduction
Lung cancer is the leading cause of cancer‐related deaths worldwide, with about 1.8 million people diagnosed per year 1. Eighty to 85 per cent of cases belong to the non‐small cell lung cancer (NSCLC) group 2. This term, however, comprises an extremely heterogeneous set of diseases at the molecular level that needs to be translated into therapeutic decision‐making 3. In this context, the anaplastic lymphoma kinase (ALK) rearrangement defines a molecular subtype of NSCLC, which is found in the adenocarcinoma histological subtype, predominantly in younger patients and light‐ or never‐smokers 4. ALK, encoding a receptor tyrosine kinase, commonly fuses with EML4 (echinoderm microtubule‐associated protein‐like 4) 5, typically resulting in the constitutive activation of the kinase domain, leading to increased pathogenicity via the aberrant activation of downstream signalling pathways.
A recent phase III trial showed that the second‐generation ALK inhibitor alectinib outperformed the first approved ALK inhibitor crizotinib, and was associated with longer progression‐free survival, lower toxicity, and, in contrast to crizotinib, activity against CNS disease in ALK+ NSCLC patients 6. However, resistance, typically arising within 1–2 years after the first treatment, remains a major concern.
Most NSCLC patients are diagnosed at a late stage of disease, when surgical resection is not performed and diagnoses are made on small biopsy specimens, making comprehensive genomic analyses difficult. To date, the largest series of repeat biopsies from patients with ALK inhibitor‐resistant ALK+ NSCLC, using a combination of genetic sequencing, histological analyses, and functional drug screens, was published in 2013 4. Despite current knowledge on mechanisms of resistance in NSCLC, there is at present no reliable biomarker allowing the identification of patients at higher risk of relapse.
TP53 is the most frequently mutated gene in human cancers, with about 50% of all tumours harbouring pathogenic mutations within it 7. One of the main functions of the corresponding protein p53 is to secure genomic stability 8. In particular, tumours harbouring early pathogenic TP53 mutations often show high levels of chromosomal instability. High‐grade serous ovarian cancer (HGSOC) and serous endometrial carcinomas (ECs), for example, are characterised by extremely high frequencies of TP53 mutations (96% and 53–90%, respectively) 9 and consequently show high levels of chromosomal instability. In both HGSOC and serous EC, TP53 mutations are early genetic events, underlining the great importance of mutated TP53 as a contributor to the tumourigenesis of these chromosomally unstable cancers 10. Recent clinical data clearly showed that concurrent TP53 mutations were associated with poorer survival among ALK+ NSCLC patients 11.
Here, we hypothesized that early TP53 mutations in ALK+ NSCLC may lead to genetic instability, in particular at the chromosomal level, and that the co‐occurrence of TP53 mutations in ALK+ tumours may define a specific subtype of ALK+ NSCLCs.
Materials and methods
Patient information and histopathological classification
A total of 423 patients with ALK‐translocated adenocarcinomas of the lung with sufficient material for molecular diagnostics were included in the study and screened for further clinically targetable genetic alterations as part of the routine molecular diagnostics programme 12 of the Network Genomic Medicine (Cologne, Germany) between January 2011 and December 2017. Comprehensive genomic work‐up was available for 147 of 423 patients only. All primary diagnoses were made in accordance with the current WHO (World Health Organisation) classification 13. Prior to the study, patients had signed written informed consent. The study was conducted in concordance with local ethical guidelines and was reviewed and approved by the institutional ethics committee.
DNA extraction
All tumour samples were formalin‐fixed and paraffin‐embedded (FFPE) according to local practice. Three to nine 10‐μm sections were cut from FFPE tissue blocks. Tumour areas were macrodissected from unstained slides using a marked haematoxylin and eosin (H&E)‐stained slide as reference. After deparaffinisation and proteinase K digestion, the DNA was isolated with the Maxwell® 16 FFPE Plus Tissue LEV DNA Purification Kit (Promega, Mannheim, Germany) on the Maxwell® 16 (Promega) following the manufacturer's instructions.
Targeted massively parallel sequencing
For next‐generation sequencing (NGS), the DNA content was measured using a quantitative real‐time PCR (qPCR) kit (GoTaq qPCR Master Mix; Promega). Multiplex PCR‐based parallel sequencing was performed on all FFPE samples. Isolated DNA was amplified with a customised GeneRead DNAseq Targeted Panel V2 (Qiagen, Hilden, Germany) and the GeneRead DNAseq Panel PCR Kit V2 (Qiagen) or an Ion AmpliSeq Custom DNA Panel (Thermo Fisher Scientific, Waltham, MA, USA) and the Ion AmpliSeq Library Kit 2.0 (Thermo Fisher Scientific), following the manufacturer's instructions. Analysed genes and corresponding panels are listed in the supplementary material, Tables [Link], [Link], [Link].
Libraries were constructed using the Gene Read DNA Library I Core Kit and the Gene Read DNA I Amp Kit (Qiagen). After end‐repair and adenylation, NEXTflex DNA Barcodes were ligated (Bio Scientific, Austin, TX, USA). Barcoded libraries were amplified, and final library products were quantified, diluted, and pooled in equal amounts. Finally, 12 pmol of the constructed libraries was sequenced on the MiSeq (Illumina, San Diego, CA, USA) with a MiSeq reagent kit V2 (300 cycles) (Illumina) following the manufacturer's recommendations.
Data were exported as FASTQ files. Alignment and annotation were done using a modified version of a previously described method 14. BAM files were visualised in the Integrative Genomics Viewer (http://www.broadinstitute.org/igv, Cambridge, MA, USA). A 5% cut‐off for variant calls was used and results were only interpreted if the coverage was greater than 200.
Fluorescence in situ hybridisation (FISH) analysis
FISH analyses were performed as previously described 15, 16 with a few modifications: 2‐μm‐thick tissue sections were mounted on silanised slides and hybridised overnight with the respective probes according to the manufacturer's instructions (ZytoVision, Bremerhaven, Germany). For ALK FISH analysis, the ZytoLight® SPEC ALK/EML4 TriCheck™ (ZytoVision) probe was used. One hundred tumour cell nuclei were counted per case, and break apart or extra red signals were classified as aberrant. A cut‐off value of 15% aberrant signals was used to validate the ALK translocation as described previously 12, 16. For MYC FISH analyses, hybridisation was performed with a ZytoLight® SPEC MYC/CEN 8 Dual Color Probe (ZytoVision). For MYC amplification, a ratio of MYC/CEN ≥ 2 or an average of ≥6 MYC signals per cell was used.
Immunohistochemistry (IHC)
IHC was performed on FFPE samples to analyse the protein expression of p53. The staining was performed with the BOND‐MAX automated immunohistochemistry slide staining system (Leica). The following antibody and conditions were applied: p53 clone DO7 mouse monoclonal (Dako; FFPE retrieving conditions: 20 min in citrate buffer, pH 6; dilution: 1:800; incubation: 20 min, 100 °C).
NanoString nCounter assay
Of the 147 patients with comprehensive clinical follow‐up data (described above), only 53 FFPE samples with sufficient material for further NanoString analysis were available (21 with TP53 mutation and 32 with wild‐type TP53, both groups exclusively selected based on DNA availability) and analysed using the NanoString nCounter platform (NanoString Technologies, Seattle, WA, USA). Copy number analysis was performed as previously described 17 using 200–600 ng of genomic DNA extracted as described above.
Cell culture and growth assays
The human ALK+ NSCLC cell line H3122 was kindly provided by Professor Martin Sos (University of Cologne, Institute of Pathology). A549EML4–ALK and H2228 cell lines were purchased from ATCC (EML4–ALK Fusion‐A549 Isogenic Cell Line Human, ATCC® CCL185IG™ and NCI‐H2228, ATCC® CRL5935™). ALK rearrangement was confirmed in all three cell lines by FISH analysis, and TP53 status, as well as the presence of other known NSCLC typical mutations of the cells, was confirmed by NGS as described above. All cell lines were tested regularly for mycoplasma contamination by means of PCR using the following primers: forward: GGGAGCAAACAGGATTAGATACCCT; reverse: TGCACCATCTGTCACTCTGTTAACCTC. Cells were cultured in RPMI 1640 supplemented with 10% FCS, 100 units/ml penicillin, and 100 μg/ml streptomycin. Cells were maintained in humidified air with 5% CO2 at 37 °C.
Cell proliferation was measured using the ATPlite Luminescence Assay Kit (Perkin Elmer, Waltham, MA, USA) according to the manufacturer's instructions. In brief, 500 cells were seeded in 100 μl of RPMI medium in 96‐well plates 24 h post‐transfection with pcDNA3 control plasmid or pcDNA3‐cMYC expressing vector. Luminescence was measured after 24 h by means of a Centro LB 960 microplate Luminometer (Berthold Technologies, Bad Wildbach, Germany).
Transient transfections
H3122 and H2228 cells were transfected with the lipid‐based transfection reagent Lipofectamine® 3000 (Thermo Fisher Scientific), and A549EML4–ALK cells were transfected with FuGENE® HD Transfection Reagent (Promega, Mannheim, Germany) according to the manufacturer's protocols. pcDNA3‐cMYC plasmid was a gift from Wafik El‐Deiry (Addgene plasmid # 16011) 18.
Preparation of whole cell lysates and immunoblotting
Cells were harvested, washed once with ice‐cold PBS, and lysed with 1 ml of RIPA buffer (Sigma‐Aldrich, St Louis, MO, USA) containing protease inhibitors (complete mini, Roche Diagnostics GmbH, Mannheim, Germany). After 15 min on ice, lysates were centrifuged (15 min, 4 °C, 14 000 rpm) and supernatants were collected and stored at −80 °C until 50–100 μg of lysates was subjected to SDS‐polyacrylamide gel electrophoresis. Protein concentrations were determined by means of a Qubit™ Protein Assay Kit (Invitrogen, Carlsbad, CA, USA), according to the manufacturer's instructions. Proteins were transferred to a nitrocellulose membrane and detected using Lumi‐Light/Lumi LightPLUS Western blotting Substrate (Roche Applied Science, Penzberg, Germany) with MYC antibody [polyclonal anti‐c‐MYC antibody (ab86356); Abcam, Cambridge, UK]. To ensure equal protein loading of the cell lysates, blots were incubated with a monoclonal GAPDH‐specific antibody (Novus Biologicals, Littleton, CO, USA).
RNA extraction and quantitative real‐time PCR
Total RNA was purified using a my‐Budget RNA Mini Kit (Bio‐Budget, Krefeld, Germany) according to the manufacturer's protocol. First‐strand cDNA was synthesised with an ImProm‐II™ Reverse Transcription System (Promega, Mannheim, Germany). Real‐time PCR was carried out on the Light Cycler Instrument II (Roche, Basel, Switzerland). TaqMan master mix and TaqMan primer sets were obtained for human MYC (Hs00153408_m1), human EML4–ALK (Hs04419883_ft), and human GAPDH (Hs03929097_g1) as an internal control (Thermo Fisher Scientific). Results were calculated using the comparative deltaCT methodology.
ChIP‐Seq
ChIP‐Seq was performed through Active Motif Epigenetic Services according to their procedures. Reads were aligned to the human genome (hg19) using the BWA algorithm (default settings) 19.
Bioinformatic and statistical analyses
Copy number plots
The read count data obtained from the NanoString analyses were plotted using the ggPlot2 package v2.2.1 20 for R v3.4.0 21, expanded with the ggthemes package v3.4.0 22. Data processing was accomplished using the plyr v1.8.4 23, dplyr v.0.7.0 24, reshape2 v1.4.2 25, and stringr v1.2.0 26 packages. For each sample, the counts were plotted according to their position in the genome and their magnitude. Both axes are linearly scaled and equal for all displayed plots.
Clonality analysis
Clonality analysis was performed as previously described 27. The code provided by Youn and Simon (written in R) was executed with standard parameters, using 200 bootstrap replicates on a 25 × 14 data matrix (samples × genes). By this method, the relative mutation order probability distribution during tumourigenesis was estimated from genome sequencing data. As the available tumour samples were analysed using amplicon‐based sequencing with several different multiplex primer panels, only the largest group of consistently sequenced samples was used for estimation. This reduced the sample size to 25 (57%) individual tumours.
Brown–Forsythe test
To assess whether samples harbouring a TP53 mutation showed a statistically significant higher chromosomal instability, a Brown–Forsythe test was performed 28. Any result of a given locus differing from the expected value of n = 2 gene copies was defined as a genetic event.
Results
To investigate whether TP53 mutations in ALK+ tumours cause genetic instability, we analysed a subset of 53 ALK+ tumours, 21 harbouring a pathogenic TP53 mutation and 32 with wild‐type TP53, as well as three ALK+ cell lines, with (H3122) or without (A549EML4–ALK, H2228) TP53 mutation, regarding changes in the copy number of 87 cancer‐relevant genes. The particular type of TP53 mutation and/or the corresponding p53 immunohistochemical staining pattern were determined for each patient with sufficient available material (supplementary material, Tables S4 and S5). The staining patterns correlated with the respective type of mutation found by NGS and examples of the three possible p53 staining patterns are shown in the supplementary material, Figure S1. In all three cell lines, as well as in most tumour samples, ALK was fused to its most common fusion partner, EML4, and translocation occurred in a high percentage of tumour cells (supplementary material, Tables S4 and S5). No further ALK+/TP53 mut cell lines were commercially available, limiting the number of cell lines analysed to one (TP53 WT) or two (TP53 mut), respectively.
As shown in Figure 1A, ALK+/TP53 WT samples displayed mostly chromosomally stable genomic profiles in terms of copy number alterations, with a few exceptions: patient TP53 WT 11 had eight copies of E2F3, and patient TP53 WT 31 showed 13 copies of TERT and 15 copies of EEF1A2.
Figure 1.
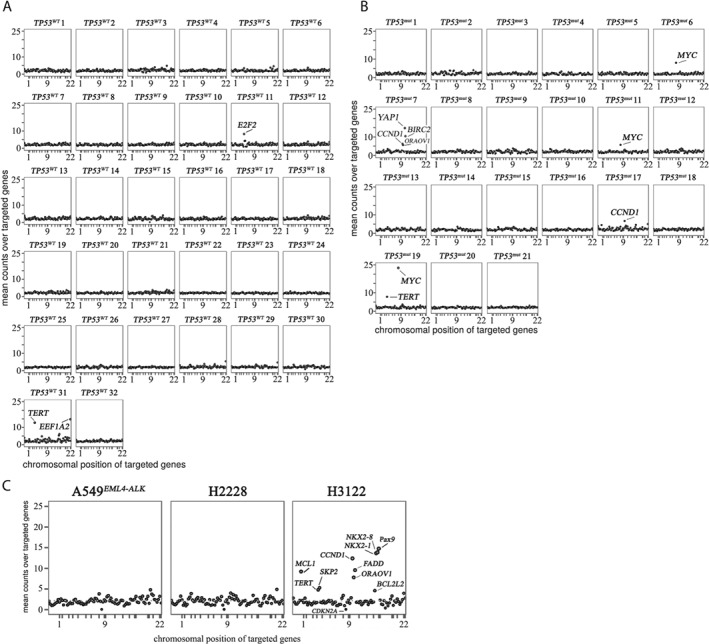
TP53 deficiency causes genomic instability in ALK+ lung tumours. Copy number plots of ALK+ samples from patients without (A) or with (B) TP53 mutation or cell lines harbouring wild‐type (C, left and middle plot) or mutated TP53 (C, right plot). The copy numbers of 87 genes were determined by means of NanoString nCounter technology. Absolute copy numbers (Y‐axis) for each gene are plotted according to their chromosomal location (X‐axis).
In contrast, the total number of genomic events in ALK+/TP53 mut samples was elevated (Figure 1B). Strikingly, a recurrent MYC gene amplification was found in 3 of the 21 cases. The MYC copy numbers were 8 (patient TP53 mut 6), 6 (patient TP53 mut 11), and 23 (patient TP53 mut 19). In all cases, ALK rearrangement and TP53 mutations were determined prior to therapy. To compare differences in gene amplifications before and after treatment, one patient (TP53 mut 11) was analysed before (primary tumour) and after (local recurrence) crizotinib administration: no remarkable differences between these samples could be found (supplementary material, Figure S2). For all analysed cases, ALK rearrangement and, if present, MYC amplifications were validated using FISH as depicted in the representative histology image (Figure 2). Biallelic TP53 deletions, which could potentially cause chromosomal instability, did not occur in the analysed cohort (TP53 copy number > 0 in all analysed cases).
Figure 2.
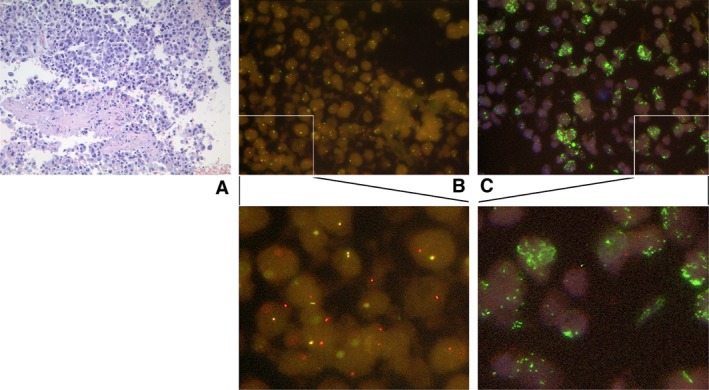
Histology of ALK+/TP53 mut lung‐adenocarcinoma‐tumour tissue (patient TP53 mut 19). (A) Representative H&E‐stained tumour. (B) FISH analysis showing ALK rearrangement. Yellow signals represent an intact ALK gene, while separated red and green or isolated red signals represent a split‐apart ALK gene. The probes used are described in ref 16. (C) FISH analysis showing MYC amplification. Green signals represent MYC; red signals represent the control locus D8Z2 (chr. 8 centromere). The images were taken at 60× magnification.
To determine whether the number of copy number alterations differed significantly between ALK+/TP53 WT and ALK+/TP53 mut samples, a Brown–Forsythe statistical test was performed. The resulting P value applied to the NanoString count data of both groups was p = 2.24 × 10‐4, lying far below the significance threshold of p = 0.05. Consequently, both groups were considered to be heteroscedastic (possessing statistically significant differences in their group variances). The actual variance values were 0.52 for ALK+/TP53 WT and 0.87 for ALK+/TP53 mut, showing that ALK+/TP53 mut cases possess a higher variance and consequently an elevated number of events in terms of changes in gene copy number.
To further validate the finding that ALK+/TP53 mut tumours harbour chromosomal instability, we analysed the three ALK+ cell lines harbouring either TP53 WT (A549EML4–ALK, H2228) or TP53 mut (H3122) regarding differences in the respective copy numbers. The NanoString analysis revealed findings consistent with the analysis of patient samples: the ALK+/TP53 WT cells had relatively stable genomes and gene copy numbers did not exceed n = 5. In contrast, the amount of CNA in H3122 cells was increased (Figure 1C, right), with seven gene loci showing copy numbers in the range of 6–15.
Given the fact that ALK rearrangements are dominant oncogenic drivers, making the accumulation of further mutations redundant, we wanted to investigate if TP53 mutations occur early during tumourigenesis, leading to genomic instability. We performed a clonality analysis approach, analysing different gene mutations with respect to the time of occurrence in the process of tumour formation (supplementary material, Figure S3) 27. Despite the reduced sample size (see the Materials and methods section), the TP53 mutation in all analysed tumours was estimated to be an early genetic event (i.e. one of the first three mutations to occur) with a probability of 89%, given a 90% confidence interval ranging from 68% to 100%.
The fact that around 14% of the patients with co‐occurrence of TP53 mutation and ALK rearrangement showed simultaneous amplifications of MYC, together with the observation that two of these three patients progressed on therapy within less than 1 year (with none of the common resistance mechanisms, namely KRAS, EGFR, ALK mutations and EGFR, MET, HER2 and ALK amplifications), prompted us to investigate further the relationship between MYC and TP53 in the given context. As patient TP53 mut 19 was diagnosed recently, no clinical follow‐up data were available, making the prediction of disease progression impossible. Currently, the treating physicians are being contacted to collect further comprehensive clinical data on all analysed cases. At the time of this study, only clinical data from the pathology charts could be accessed.
To further evaluate the role of MYC in ALK+ tumours, we transiently overexpressed MYC in A549EML4–ALK, H2228 (both TP53WT), and H3122 cells (TP53 mut), and measured the proliferation rate in all three cell lines. As shown in Figure 3A, H3122 cells with elevated MYC content showed a two‐fold increase in the proliferation rate compared with cells transfected with control vector. In contrast, there was no difference in cell growth in TP53 WT A549EML4–ALK or H2228 cells with increased MYC levels. Overexpression of MYC protein was confirmed in all cell lines by western blot analysis (Figure 3B).
Figure 3.
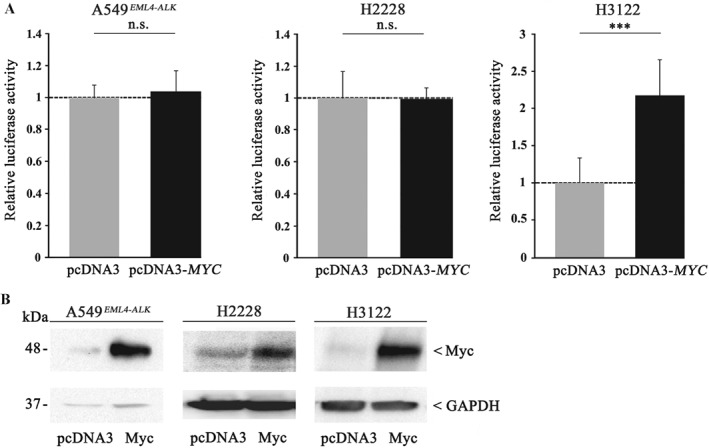
MYC enhances cell proliferation only in TP53 mut but not in TP53 WT ALK+ cell lines. (A) A549EML4–ALK (left), H2228 (middle), and H3122 (right) were transiently transfected with a pcDNA3‐MYC expression plasmid or pcDNA3 vector as control. Twenty‐four hours after transfection, cells were seeded in 96‐well plates and luminescence was measured after 24 h by means of a Centro LB 960 microplate luminometer. Each experiment was performed independently and at least in triplicates, and each measurement was carried out with eight technical replicates. All values are expressed as means ±standard deviation. Statistical significance was evaluated using Student's t‐test: n.s. = not significant, p > 0.05; ***p ≤ 0.001. (B) MYC overexpression was confirmed by immunoblot analysis in A549EML4–ALK (left), H2228 (middle), and H3122 (right) using a polyclonal anti‐MYC antibody. Equal protein loading was ensured by determining GAPDH levels.
In order to further understand the underlying mechanisms of MYC‐induced cell proliferation, we performed ChIP‐Seq (chromatin immunoprecipitation DNA sequencing) analyses and found MYC‐binding sites within the EML4‐promoter region (Figure 4A), suspecting possible MYC‐induced expression of EML4–ALK. Given the fact that we found MYC amplifications in TP53 mut ALK+ patients exclusively, experiments were performed with the only available ALK+/TP53 mut cell line, H3122. Overexpression of MYC in H3122 cells resulted in an increased EML4–ALK content, both at the RNA (Figure 4B, left) and protein (Figure 4C) levels.
Figure 4.
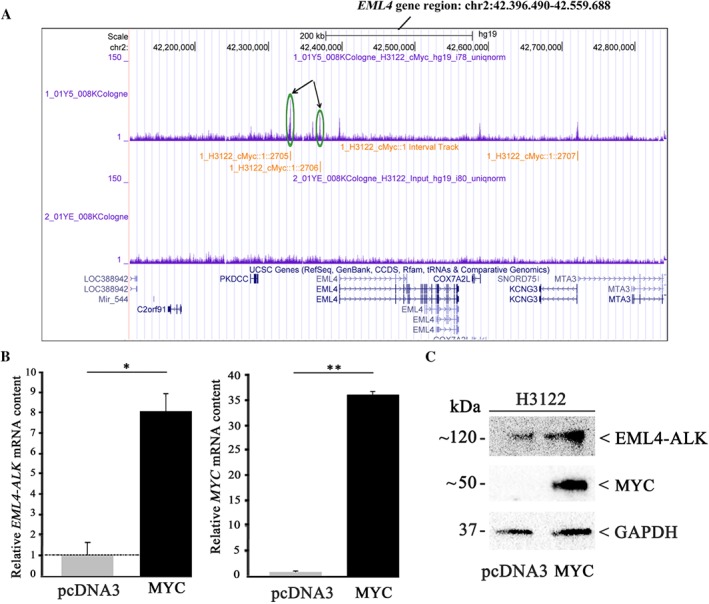
MYC upregulates EML4–ALK expression in TP53‐mutated H3122 cells. H3122 cells were transiently transfected with a MYC expression plasmid or pcDNA3 vector as control. (A) ChIP‐Seq analyses revealed MYC binding sites within the EML4–ALK promoter region (green circles and arrows). (B) MYC and EML4–ALK mRNA levels were determined by TaqMan gene expression assay. The values shown were normalised to control transfection. All values are expressed as means ±standard deviation. Statistical significance was evaluated using the Student's t‐test: *p ≤ 0.05, **p ≤ 0.01. (C) EML4–ALK and MYC protein amounts were determined by immunoblot analysis using a monoclonal anti‐ALK or a polyclonal anti‐MYC antibody. Equal protein loading was ensured by determining GAPDH levels.
Discussion
Drug resistance in ALK+ NSCLC patients continues to be a major impediment. In recent years, the analyses of post‐treatment tumour tissue samples have massively improved our understanding of the molecular mechanisms of resistance to ALK inhibitors: Camidge et al 29 were the first to divide mechanisms of resistance to ALK inhibitors (i.e. crizotinib) into two types: ALK dominant (on‐target) and ALK non‐dominant (off‐target). The ALK‐dominant type, representing approximately 50% of cases, is characterised by secondary mutations of the ALK kinase domain or copy number gains of the ALK gene (ALK amplifications), whereas the non‐dominant type includes the activation of alternative oncogenic pathways (e.g. EGFR, KRAS, KIT, MET, IGF1R pathways), which may cause resistance independently of ALK genetic alterations. EGFR and KRAS mutations 30, amplification of KIT 31 or activation of the IGF1R pathway 32 are possible resistance mechanisms leading to insensitivity to crizotinib. Other mechanisms of resistance include epithelial–mesenchymal transition (EMT) 33 and autophagy 34.
A recent study showed that 33% of ALK+ tumours exhibit mutations within TP53, whereby it could not be determined whether these mutations were present prior to treatment with second‐generation ALK inhibitors or were a result of the therapy 35. In our institution, we observed that 23.8% of all ALK+ cases harboured an additional TP53 mutation prior to treatment. In this context, we wanted to further investigate the impact of TP53 mutations in this particular tumour type. Our analyses revealed that TP53 mutations occur early during tumourigenesis, which is in line with the observed genomic instability in these ALK+ tumours. Aisner et al recently showed that concurrent TP53 mutations are associated with poorer survival among ALK+ NSCLC patients 11. They suggested that TP53 mutations lead to genetic instability in lung adenocarcinoma and thus may accelerate the development of multiple mechanisms of resistance to targeted therapy in these patients, resulting in shorter survival. The relationship between chromosomal instability caused by early mutations in TP53 and the exact underlying molecular mechanisms of resistance still need to be elucidated.
Seo et al did not find any MYC copy number changes in ten patients with ALK+ lung adenocarcinoma 36. In contrast, we have shown that 14% of ALK+/TP53‐mutated patients had MYC amplification, which was not observed in TP53 WT cases. MYC is one of the most frequently amplified oncogenes among many different human cancers and is involved in tumourigenesis in these tumours 37.
Our functional experiments using ALK+ H3122 (TP53 mut) and H2228 and A549EML4–ALK (both TP53 WT) cells revealed a proliferative advantage after MYC overexpression only in the absence of intact TP53, suggesting a potential TP53‐dependent MYC‐induced growth advantage. The impact of copy number alterations on therapy resistance has already been proven in different cancer types and it is known that patients with gene amplifications can become resistant to drug therapies, resulting in a poor prognosis 38. Several studies indicate that MYC overexpression is associated with drug resistance 39, 40, leading to the assumption that increased MYC copy number might also have a negative impact on ALK+ patients' outcome.
By ChIP‐Seq, we found MYC binding sites within the EML4 promoter region, as well as MYC‐induced increased levels of EML4–ALK RNA and protein, after overexpression of the oncogene. These preliminary findings let us propose a MYC‐induced resistance mechanism in ALK+ TP53‐deficient patients; this could be categorised according to Gainor et al 35 as an ‘ALK‐dominant mechanism’: MYC amplification and overexpression lead to increased binding of the oncogene to the EML4–ALK promoter, thereby increasing the expression of EML–ALK within the cells and causing resistance to ALK inhibitors (Figure 5). Several studies have reported that changes in MYC copy number are associated with aggressive behaviour in different cancer types, and it is reported that c‐MYC and n‐MYC, another member of the MYC oncoprotein family, are downstream targets of ALK signalling in ALK+ anaplastic large cell lymphomas 41, 42, suggesting a positive feedback loop in the MYC/EML4–ALK axis. MYC appears to be a universal amplifier of gene expression, increasing output at all active promoters in tumour cells 43, which is in line with our results.
Figure 5.
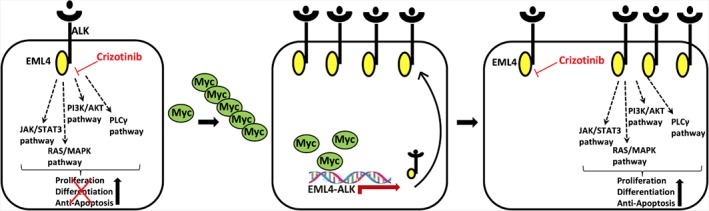
Proposed mechanism for MYC‐dependent resistance to ALK inhibitors in TP53‐mutated ALK+ NSCLC patients. ALK inhibitors such as crizotinib block EML4–ALK‐mediated proliferation of cancer cells (left). MYC amplification leads to enhanced binding of the oncogene to the EML4–ALK promoter, resulting in increased expression of the kinase (middle), causing resistance to crizotinib (right).
Compared with TP53‐deficient patients, ALK+/TP53 WT patients had genetically stable genomes, with one noteworthy exception: patient TP53 WT 31 showed a genomic‐unstable DNA profile, with amplification of diverse genes, including EEF1A2 (15 copies) and TERT (13 copies). In cancer cells, telomere dysfunction leads to genomic instability 44. By activation of telomerase, telomere function is reconstituted, resulting in highly proliferative, immortalised telomerase‐positive cells with heavily rearranged genomes 45. The genomic instability in patient TP53 WT 31 may be explained by TERT reconstitution caused by the amplification of the corresponding gene. Analyses of larger numbers of cases will be required to confirm these observations.
Author contributions statement
AMS, CA, LGM, and RB conceived the study. CA, BH, EB, SW, ND, SF, CH, SMB, JF, and MAI performed experiments and analysed the data. TB performed bioinformatics analysis. AMS, RB, and CA discussed and interpreted the results. CA, AMS, RB, SMB, JW, AK, and AHS wrote/reviewed the manuscript. All of the authors read, edited, and approved the final manuscript.
SUPPLEMENTARY MATERIAL ONLINE.
Supplementary figure legends
Figure S1. Three immunohistochemical staining patterns of p53 in ALK+ patients
Figure S2. Copy number plots of primary tumour and local recurrence of the same ALK+/TP53 mut patient
Figure S3. TP53 mutation is an early event during tumourigenesis in ALK‐driven tumours
Table S1. NGS results from the EML4–ALK‐translocated cell line H2888
Table S2. NGS results from the EML4–ALK‐translocated cell line H3122
Table S3. NGS results from the EML4–ALK‐translocated cell line A549EML4–ALK
Table S4. Characteristics of patients (TP53 WT)
Table S5. Characteristics of patients (TP53 mut)
Supporting information
Supplementary figure legends
Figure S1. Three immunohistochemical staining patterns of p53 in ALK+ patients TP53 WT 14, TP53 mut 17, and TP53 mut 7. (A) Pattern suggestive of a wild‐type TP53 gene showing patchy positivity in some tumour cell nuclei and negativity in others. (B) Pattern suggestive of a missense mutation resulting in a non‐functional protein accumulating in the tumour cell nuclei. (C) Pattern suggestive of a truncating mutation resulting in the complete loss of the protein in the tumour cell nuclei. Images were taken at 400 × original magnification.
Figure S2. Copy number plots of primary tumour (TP53 mut 11, left) and local recurrence (TP53 mut 11 rec , right) of the same ALK+/TP53 mut patient. Copy numbers of 87 genes were determined by means of NanoString nCounter technology. Absolute copy numbers (Y‐axis) for each gene are plotted according to their chromosomal location (X‐axis). rec = recurrence.
Figure S3. TP53 mutation is an early event during tumourigenesis in ALK‐driven tumours. The TP53 mutation was estimated to be an early event (i.e. one of the first three mutations to occur) with a probability of 89%, given a 90% confidence interval (CI) ranging from 68% to 100% (penultimate line).
Table S1. NGS results from the EML4–ALK‐translocated cell line H2888
Table S2. NGS results from the EML4–ALK‐translocated cell line H3122
Table S3. NGS results from the EML4–ALK‐translocated cell line A549EML4–ALK
Table S4. Characteristics of patients (TP53 WT)
Table S5. Characteristics of patients (TP53 mut)
Acknowledgements
The research reported in this article was funded by Roche Pharma AG and the Kölner Krebsstiftung. We thank Christian Reinboth for his excellent assistance with the immunohistochemical p53 staining.
No conflicts of interest were declared.
References
- 1. Torre LA, Bray F, Siegel RL, et al Global cancer statistics, 2012. CA Cancer J Clin 2015; 65: 87–108. [DOI] [PubMed] [Google Scholar]
- 2. Reck M, Popat S, Reinmuth N, et al Metastatic non‐small‐cell lung cancer (NSCLC): ESMO Clinical Practice Guidelines for diagnosis, treatment and follow‐up. Ann Oncol 2014; 25(suppl 3): iii27–39. [DOI] [PubMed] [Google Scholar]
- 3. Boolell V, Alamgeer M, Watkins DN, et al The evolution of therapies in non‐small cell lung cancer. Cancers (Basel) 2015; 7: 1815–1846. [DOI] [PMC free article] [PubMed] [Google Scholar]
- 4. Gainor JF, Varghese AM, Ou SH, et al ALK rearrangements are mutually exclusive with mutations in EGFR or KRAS: an analysis of 1,683 patients with non‐small cell lung cancer. Clin Cancer Res 2013; 19: 4273–4281. [DOI] [PMC free article] [PubMed] [Google Scholar]
- 5. Soda M, Choi YL, Enomoto M, et al Identification of the transforming EML4–ALK fusion gene in non‐small‐cell lung cancer. Nature 2007; 448: 561–566. [DOI] [PubMed] [Google Scholar]
- 6. Peters S, Camidge DR, Shaw AT, et al Alectinib versus crizotinib in untreated ALK‐positive non‐small‐cell lung cancer. N Engl J Med 2017; 377: 829–838. [DOI] [PubMed] [Google Scholar]
- 7. Vogelstein B, Lane D, Levine AJ. Surfing the p53 network. Nature 2000; 408: 307–310. [DOI] [PubMed] [Google Scholar]
- 8. Chumakov PM. Versatile functions of p53 protein in multicellular organisms. Biochemistry (Mosc) 2007; 72: 1399–1421. [DOI] [PMC free article] [PubMed] [Google Scholar]
- 9. Lax SF, Kendall B, Tashiro H, et al The frequency of p53, K‐ras mutations, and microsatellite instability differs in uterine endometrioid and serous carcinoma: evidence of distinct molecular genetic pathways. Cancer 2000; 88: 814–824. [PubMed] [Google Scholar]
- 10. O'Hara AJ, Bell DW. The genomics and genetics of endometrial cancer. Adv Genomics Genet 2012; 2012: 33–47. [DOI] [PMC free article] [PubMed] [Google Scholar]
- 11. Aisner DL, Sholl LM, Berry L, et al The impact of smoking and TP53 mutations in lung adenocarcinoma patients with targetable mutations – the Lung Cancer Mutation Consortium (LCMC2). Clin Cancer Res 2018; 24: 1038–1047. [DOI] [PMC free article] [PubMed] [Google Scholar]
- 12. Heydt C, Kostenko A, Merkelbach‐Bruse S, et al ALK evaluation in the world of multiplex testing: Network Genomic Medicine (NGM): the Cologne model for implementing personalised oncology. Ann Oncol 2016; 27(suppl 3): iii25–iii34. [DOI] [PubMed] [Google Scholar]
- 13. Travis WD, Brambilla E, Burke AP, et al (eds). WHO Classification of Tumours of the Lung, Pleura, Thymus and Heart (4th edn). International Agency for Research on Cancer: Lyon, 2015. [DOI] [PubMed] [Google Scholar]
- 14. Peifer M, Fernandez‐Cuesta L, Sos ML, et al Integrative genome analyses identify key somatic driver mutations of small‐cell lung cancer. Nat Genet 2012; 44: 1104–1110. [DOI] [PMC free article] [PubMed] [Google Scholar]
- 15. Schultheis AM, Bos M, Schmitz K, et al Fibroblast growth factor receptor 1 (FGFR1) amplification is a potential therapeutic target in small‐cell lung cancer. Mod Pathol 2014; 27: 214–221. [DOI] [PubMed] [Google Scholar]
- 16. Schildhaus HU, Deml KF, Schmitz K, et al Chromogenic in situ hybridization is a reliable assay for detection of ALK rearrangements in adenocarcinomas of the lung. Mod Pathol 2013; 26: 1468–1477. [DOI] [PubMed] [Google Scholar]
- 17. Kim ST, Lee SJ, Park SH, et al Genomic profiling of metastatic gastroenteropancreatic neuroendocrine tumor (GEP‐NET) patients in the personalized‐medicine era. J Cancer 2016; 7: 1044–1048. [DOI] [PMC free article] [PubMed] [Google Scholar]
- 18. Ricci MS, Jin Z, Dews M, et al Direct repression of FLIP expression by c‐myc is a major determinant of TRAIL sensitivity. Mol Cell Biol 2004; 24: 8541–8555. [DOI] [PMC free article] [PubMed] [Google Scholar]
- 19. Li H, Durbin R. Fast and accurate short read alignment with Burrows–Wheeler transform. Bioinformatics 2009; 25: 1754–1760. [DOI] [PMC free article] [PubMed] [Google Scholar]
- 20. Wickham H. ggplot2: Elegant Graphics for Data Analysis. Springer‐Verlag: New York, 2009. [Google Scholar]
- 21. The R code Team . R: A Language and Environment For Statistical Computing. [Accessed 2017]. Available from: https://www.r-project.org/
- 22. Arnold JB. ggthemes: Extra Themes, Scales and Geoms for ‘ggplot2’. [Accessed 2017]. Available from: https://cran.r-project.org/package=ggthemes
- 23. Wickham H. The split–apply–‐combine strategy for data analysis. J Stat Software 2011; 1–29; DOI: https://doi.org/10.18637/jss.v040.i01 [Epub ahead of print]. [Google Scholar]
- 24. Wickham H. dplyr: A Grammar of Data Manipulation. [Accessed 2017]. Available from: https://cran.r-project.org/package=dplyr
- 25. Wickham H. Reshaping data with the reshape package. J Stat Software 2007; 21: DOI: 10.18637/jss.v021.i12. [Google Scholar]
- 26. Wickham H. stringr: Simple, Consistent Wrappers for Common String Operations. [Accessed 2017]. Available from: https://cran.r-project.org/package=stringr
- 27. Youn A, Simon R. Estimating the order of mutations during tumorigenesis from tumor genome sequencing data. Bioinformatics 2012; 28: 1555–1561. [DOI] [PMC free article] [PubMed] [Google Scholar]
- 28. Brown MB, Forsythe AB. Robust tests for the equality of variances. J Am Stat Assoc 1974; 69: 364–367. [Google Scholar]
- 29. Camidge DR, Doebele RC. Treating ALK‐positive lung cancer – early successes and future challenges. Nat Rev Clin Oncol 2012; 9: 268–277. [DOI] [PMC free article] [PubMed] [Google Scholar]
- 30. Doebele RC, Pilling AB, Aisner DL, et al Mechanisms of resistance to crizotinib in patients with ALK gene rearranged non‐small cell lung cancer. Clin Cancer Res 2012; 18: 1472–1482. [DOI] [PMC free article] [PubMed] [Google Scholar]
- 31. Katayama R, Shaw AT, Khan TM, et al Mechanisms of acquired crizotinib resistance in ALK‐rearranged lung cancers. Sci Transl Med 2012; 4: 120ra17. [DOI] [PMC free article] [PubMed] [Google Scholar]
- 32. Lovly CM, McDonald NT, Chen H, et al Rationale for co‐targeting IGF‐1R and ALK in ALK fusion‐positive lung cancer. Nat Med 2014; 20: 1027–1034. [DOI] [PMC free article] [PubMed] [Google Scholar]
- 33. Kim HR, Kim WS, Choi YJ, et al Epithelial–mesenchymal transition leads to crizotinib resistance in H2228 lung cancer cells with EML4–ALK translocation. Mol Oncol 2013; 7: 1093–1102. [DOI] [PMC free article] [PubMed] [Google Scholar]
- 34. Ji C, Zhang L, Cheng Y, et al Induction of autophagy contributes to crizotinib resistance in ALK‐positive lung cancer. Cancer Biol Ther 2014; 15: 570–577. [DOI] [PMC free article] [PubMed] [Google Scholar]
- 35. Gainor JF, Dardaei L, Yoda S, et al Molecular mechanisms of resistance to first‐ and second‐generation ALK inhibitors in ALK‐rearranged lung cancer. Cancer Discov 2016; 6: 1118–1133. [DOI] [PMC free article] [PubMed] [Google Scholar]
- 36. Seo AN, Yang JM, Kim H, et al Clinicopathologic and prognostic significance of c‐MYC copy number gain in lung adenocarcinomas. Br J Cancer 2014; 110: 2688–2699. [DOI] [PMC free article] [PubMed] [Google Scholar]
- 37. Beroukhim R, Mermel CH, Porter D, et al The landscape of somatic copy‐number alteration across human cancers. Nature 2010; 463: 899–905. [DOI] [PMC free article] [PubMed] [Google Scholar]
- 38. Bertotti A, Papp E, Jones S, et al The genomic landscape of response to EGFR blockade in colorectal cancer. Nature 2015; 526: 263–267. [DOI] [PMC free article] [PubMed] [Google Scholar]
- 39. Walker TL, White JD, Esdale WJ, et al Tumour cells surviving in vivo cisplatin chemotherapy display elevated c‐myc expression. Br J Cancer 1996; 73: 610–614. [DOI] [PMC free article] [PubMed] [Google Scholar]
- 40. McNeil CM, Sergio CM, Anderson LR, et al c‐Myc overexpression and endocrine resistance in breast cancer. J Steroid Biochem Mol Biol 2006; 102: 147–155. [DOI] [PubMed] [Google Scholar]
- 41. Raetz EA, Perkins SL, Carlson MA, et al The nucleophosmin‐anaplastic lymphoma kinase fusion protein induces c‐Myc expression in pediatric anaplastic large cell lymphomas. Am J Pathol 2002; 161: 875–883. [DOI] [PMC free article] [PubMed] [Google Scholar]
- 42. Gustafson WC, Weiss WA. Myc proteins as therapeutic targets. Oncogene 2010; 29: 1249–1259. [DOI] [PMC free article] [PubMed] [Google Scholar]
- 43. Nie Z, Hu G, Wei G, et al c‐Myc is a universal amplifier of expressed genes in lymphocytes and embryonic stem cells. Cell 2012; 151: 68–79. [DOI] [PMC free article] [PubMed] [Google Scholar]
- 44. Artandi SE, Chang S, Lee SL, et al Telomere dysfunction promotes non‐reciprocal translocations and epithelial cancers in mice. Nature 2000; 406: 641–645. [DOI] [PubMed] [Google Scholar]
- 45. Maciejowski J, de Lange T. Telomeres in cancer: tumour suppression and genome instability. Nat Rev Mol Cell Biol 2017; 18: 175–186. [DOI] [PMC free article] [PubMed] [Google Scholar]
Associated Data
This section collects any data citations, data availability statements, or supplementary materials included in this article.
Supplementary Materials
Supplementary figure legends
Figure S1. Three immunohistochemical staining patterns of p53 in ALK+ patients TP53 WT 14, TP53 mut 17, and TP53 mut 7. (A) Pattern suggestive of a wild‐type TP53 gene showing patchy positivity in some tumour cell nuclei and negativity in others. (B) Pattern suggestive of a missense mutation resulting in a non‐functional protein accumulating in the tumour cell nuclei. (C) Pattern suggestive of a truncating mutation resulting in the complete loss of the protein in the tumour cell nuclei. Images were taken at 400 × original magnification.
Figure S2. Copy number plots of primary tumour (TP53 mut 11, left) and local recurrence (TP53 mut 11 rec , right) of the same ALK+/TP53 mut patient. Copy numbers of 87 genes were determined by means of NanoString nCounter technology. Absolute copy numbers (Y‐axis) for each gene are plotted according to their chromosomal location (X‐axis). rec = recurrence.
Figure S3. TP53 mutation is an early event during tumourigenesis in ALK‐driven tumours. The TP53 mutation was estimated to be an early event (i.e. one of the first three mutations to occur) with a probability of 89%, given a 90% confidence interval (CI) ranging from 68% to 100% (penultimate line).
Table S1. NGS results from the EML4–ALK‐translocated cell line H2888
Table S2. NGS results from the EML4–ALK‐translocated cell line H3122
Table S3. NGS results from the EML4–ALK‐translocated cell line A549EML4–ALK
Table S4. Characteristics of patients (TP53 WT)
Table S5. Characteristics of patients (TP53 mut)