

Abstract
Objective:
To determine the maximum tolerated dose of ABT-510, a thrombospondin-1 mimetic drug with antiangiogenic properties, when used concurrently with temozolomide and radiotherapy in patients with newly diagnosed glioblastoma.
Design:
Phase 1 dose-escalation clinical trial.
Setting:
Comprehensive Cancer Center, University of Alabama at Birmingham.
Patients:
A total of 23 patients with newly diagnosed, histologically verified glioblastoma enrolled between April 2005 and January 2007.
Interventions:
Four cohorts of 3 patients each received subcutaneous ABT-510 injection at doses of 20,50,100, or 200 mg/d. The maximum cohort was expanded to 14 patients to obtain additional safety and gene expression data. The treatment plan included 10 weeks of induction phase (temozolomide and radiotherapy with ABT-510 for 6 weeks plus ABT-510 monotherapy for 4 weeks) followed by a maintenance phase of ABT-510 and monthly temozolomide.
Main Outcome Measures:
Patients were monitored with brain magnetic resonance imaging and laboratory testing for dose-limiting toxicities, defined as grades 3 or 4 nonhematological toxicities and grade 4 hematological toxicities. Therapy was discontinued if 14 maintenance cycles were completed, disease progression occurred, or if the patient requested withdrawal. Disease progression, survival statistics, and gene expression arrays were analyzed.
Results:
There were no grade 3 or 4 dose-limiting toxicity events that appeared related to ABT-510 for the dose range of 20 to 200 mg/d. A maximum tolerated dose was not defined. Most adverse events were mild, and injection-site reactions. The median time to tumor progression was 45.9 weeks, and the median overall survival time was 64.4 weeks. Gene expression analysis using TaqMan low-density arrays identified angiogenic genes that were differentially expressed in the brains of controls compared with patients with newly diagnosed glioblastoma, and identified FGF-1 and TIE-1 as being downregulated in patients who had better clinical outcomes.
Conclusions:
ABT-510, at subcutaneous doses up to 200 mg/d, is tolerated well with concurrent temozolomide and radiotherapy in patients with newly diagnosed glioblastoma, and low-density arrays provide a useful method of exploring gene expression profiles.
PRIMARY BRAIN TUMORS AFFECT more than 50 000 individuals in the United States per year, a large percentage of which are aggressive in behavior.1 Current treatment relies primarily on surgery, radiation, and chemotherapy. For patients diagnosed with the most aggressive and most frequently occurring primary intracranial malignancy, glioblastoma, the median overall survival time is just less than 15 months.2
Malignant gliomas are characterized by an intensely angiogenic phenotype resulting from high levels of vascular endothelial growth factor (VEGF) expression.3 Angiogenesis not only appears to support the growth and progression of malignant glioma but results in significant neurologic dysfunction from loss of cerebral blood flow autoregulation and regional ischemia due to edema. Therapy directed at the promoters of glioma angiogenesis in the central nervous system is gaining attention in the neuro-oncology community. Clinical trials in patients with recurrent glioblastoma using the VEGF-neutralizing antibody bevacizumab have resulted in significant radiographic responses and improvements in patient outcomes.4,5 Despite these important advances, glioblastomas universally recur, and alternative strategies to inhibit tumor-associated angiogenesis are needed.
Although trials focused on inhibitors of aberrantly overexpressed angiogenesis-promoting factors have dominated the landscape, replacement of endogenous inhibitors of angiogenesis remain viable opportunities for clinical investigation.6 ABT-510 (Abbott Laboratories, Abbott Park, Illinois) was developed to improve pharmacodynamic and pharmacokinetic profiles of the type 1 repeat peptide of thrombospondin 1 (TSP-1). Both TSP-1 and its highly homologous family member, TSP-2, can promote antiangiogenic effects through sequences found in the TSP-1 repeat and amino-terminal domains.7–9 Peptides from the second TSP-1 repeat domain that contain the sequence GVITRIR inhibit angiogenesis in vitro.10 ABT-510 can (1) induce apoptosis of bovine capillary endothelial cells and human umbilical artery endothelial cells, (2) inhibit tubular morphogenesis induced by VEGF, and (3) inhibit corneal neovascularization induced by basic fibroblast growth factor.11,12 ABT-510 limits angiogenesis by inducing apoptosis in brain microvascular endothelial cells through a death receptor-mediated pathway. ABT-510 competes with thrombospondin and inhibits VEGF-induced migration in vitro of human microvascular endothelial cells and inhibits malignant glioma growth in vivo by inhibiting angiogenesis.13,14
A rationale for the study of endogenous inhibitors of angiogenesis in malignant glioma is thus provided as a means to block a disease behavior that is detrimental to patient outcomes. We report the toxicity profile and patients’ responses to ABT-510, a thrombospondin mimetic antiangiogenic drug, when used concurrently with standard therapy in patients with newly diagnosed glioblastoma.
METHODS
This was an investigator-initiated study supported by the University of Alabama at Birmingham Specialized Program in Research Excellence for Neurological Cancer. The protocol (UAB 0327) was reviewed and approved by the institutional review board, and all patients signed informed consent.
Patients eligible for enrollment met the following criteria: 19 years or older, histologically proven glioblastoma, recovery from toxicities of previous therapies, treated with a stable dose of corticosteroids for 5 or more days, Karnofsky performance status of 60% or better, adequate hematologic, renal, and hepatic function, and capability of providing informed consent.
TREATMENT PLAN
This study was designed as an open-label, phase I trial to evaluate the toxicities and determine the maximum tolerated dose (MTD) of ABT-510 in patients with newly diagnosed glioblastoma when given with standard radiation and chemotherapy with temozolomide. ABT-510 is N-acetylsarcosyl-glycyl-l-valyl-D-allo-isoleucyl-l-threonyl-l-norvaly-l-isoleucyl-l-arginyl-l-prolyl-N-ethylamide that is supplied as an acetate salt and is soluble in water or saline. The study drug was given as a subcutaneous daily injection on a dosing schedule that was continuous. The treatment schema is illustrated in Figure 1. A 4-week interval was considered a treatment cycle. The cohort size was 3 evaluable patients; cohorts were expanded to 6 patients if a single dose-limiting toxicity (DLT) event occurred in the initial 3 patients. The starting cohort received ABT-510 at a dose of 20 mg, and the protocol-defined dose levels were 50, 100, and 200 mg/d. The maximum-dose group was expanded to a total of 14 patients to collect additional safety/toxicity and molecular data in this patient population. The starting dose and schedule were selected based on animal studies and previous experience in humans. The MTD was defined as the dose level below the dose that induced DLTs in more than 2 of 6 patients or the dose level below which produced DLT in 2 or more of 3 patients (3 or more of 6). A DLT was defined as any grade 3 or 4 toxicity attributable to ABT-510, evaluated according to the National Cancer Institute Common Toxicity Criteria version 3. Patients had an evaluation for measurable disease by cranial magnetic resonance imaging every 8 weeks of treatment and a neurological examination every 4 weeks. Pharmacokinetic studies were not performed, and patients were not stratified based on anticonvulsant use.
Figure 1.

ABT-510 phase 1 trial treatment schema. The initial induction therapy phase of the clinical trial involved the Stupp regimen of temozolomide chemoradiation followed by chemotherapy maintenance. qd indicates every day; RT, radiation therapy; and SC, subcutaneous.
GENE EXPRESSION ANALYSIS
Formalin-fixed, paraffin-embedded tumor tissue sections were collected from 20 of the 23 enrolled patients. The RNA was extracted from 20-μm curls using the Roche High Pure RNA Paraffin Kit (Roche Diagnostics, Mannheim, Germany) per the manufacturer’s instructions. The quality of the RNA was deemed adequate in 15 samples based on A260/A280 ratios. Control brain samples (5 samples) were obtained from the University of Alabama at Birmingham Brain Tumor Tissue Bank and collected from brain resected from patients who had surgery for epilepsy or trauma. Reverse transcription was performed using the High Capacity cDNA Archive Kit (Applied Biosystems, Foster City, California) per the manufacturer’s instructions.
Individual real-time quantitative polymerase chain reaction assays were formatted into a TaqMan low-density array (TLDA; Applied Biosystems). The precision, accuracy, and intra-assay and interassay variability have been previously described in detail by our laboratory.15 The Taqman Human Angiogenesis TLDA (Part Number 4378710; Applied Biosystems) was used, with analysis performed using the Applied Biosystems Prism 7900HT sequence detection system. Samples were normalized to the 18S housekeeping gene included on the array. Gene expression values were calculated using the comparative Ct method.15
Real-time polymerase chain reaction was used to analyze the expression levels of 96 genes in 15 tumor samples and 5 control brains. Expression values for individual samples were calculated by the comparative Ct method, normalized to a single control brain, and logarithmically (log2) transformed. To eliminate nonspecific expression changes, the data were filtered by demanding that the expression level of any gene in any tumor sample be outside the interval consisting of the mean (2SDs) of the expression of the same gene in the 5 control brains (eTables 1 and 2; www.archneurol.com). The log2-transformed expression levels of filtered genes were changed to 0. A 2-sample t test was applied at the 1% significance level (P < .01) to discover genes that predicted long survival times. Data analysis was done in Matlab (Mathworks, Natick, Massachusetts).
STATISTICAL ANALYSIS
Patient characteristics and toxicities were summarized using appropriate descriptive statistics. Survival time was calculated from the start of treatment until death from any cause, and surviving patients were censored at the time of last follow-up. The method of Kaplan and Meier was used to estimate survival. Confidence intervals were calculated using standard methods. These analyses were performed using SAS version 9.1.3 (SAS Institute, Cary, North Carolina).
RESULTS
PATIENT CHARACTERISTICS
The study was activated in April 2005, and 24 patients were accrued by November 2006. One patient withdrew consent before initiating treatment and is not considered in this analysis. Most patients were white (87%) and male (61%). The median age was 55 years (range, 20-73 years). The median Karnofsky Performance Status score at the time of consent was 90 (range, 70-100) and the median Mini-Mental State Examination score was 29 (range, 19-30). All patients had prior surgery and initiated adjuvant treatment with standard fractionated radiation therapy with concurrent temozolomide chemotherapy following the Stupp regimen, with the exception of the number of maintenance cycles.2
TOXIC EFFECTS
The most common adverse reaction of ABT-510 was location injection site reaction given the subcutaneous delivery of the compound. In this trial, there were no DLTs described for the 20, 50,100, or 200 mg daily doses, and an MTD was not defined. The primary adverse events noted that were felt to be possibly or probably related to ABT-510 were injection site reactions and fatigue. These were predominantly clustered at the maximum dose level of 200 mg per day, as shown in the Table. All of the events were graded as 1 or 2. The injection site dermal reactions were described as mild erythema or swelling. Because the maximum dose was delivered on a twice-daily schedule owing to the volume, these reactions likely reflect an adverse effect of the volume of administration and not necessarily an inflammatory reaction to ABT-510. Fatigue was also a common adverse event and again was clustered in the upper dose group with a mild effect being quantified as grade 1 or 2 in all circumstances. There were no hematological toxicities felt to be related to ABT-510. A total of 18.5% of enrolled subjects had a grade 3 or 4 neutropenia or thrombocytopenia secondary to temozolomide.
Table.
Grade 1 or 2 Toxic Effects at Least Possibly Related to ABT-510 by Dose Level
| Toxic Effect | Patients, No. by Dose Level |
||||
|---|---|---|---|---|---|
| 20 mg (n=3) | 50 mg (n=3) | 100 mg (n=3) | 200 mg (n=14) | Total (N=23) | |
| Fatigue | 0 | 0 | 0 | 8 | 8 |
| Hair loss | 0 | 0 | 0 | 1 | 1 |
| Injection site reaction | 0 | 0 | 1 | 3 | 4 |
| Pain | 0 | 0 | 0 | 1 | 1 |
| Weight loss | 0 | 0 | 0 | 1 | 1 |
RESPONSE ASSESSMENT
Of the 23 patients who began treatment, all but 1 completed the induction phase. The 1 patient voluntarily discontinued ABT-510 in the fourth week of radiation with temozolomide owing to the need for twice-daily subcutaneous injections. Of the 23 patients treated, 3 were still alive as of November 10, 2009. The median time to progression was 45.9 weeks (95% confidence interval, 29.3-73.0), and the median overall survival time was 64.4 months (95% confidence interval, 48.7-84.7). The Kaplan-Meier estimates of time to progression and overall survival for the entire study population are illustrated in Figure 2.
Figure 2.

Kaplan-Meier curves for time to progression (A) and overall survival time (B).
GENE EXPRESSION PROFILES
The gene expression levels in the 5 control brains were applied to determine a reference range consisting of the mean (2 SDs) for each gene (P< .05). Genes whose expression levels fell outside of the reference range and 73% to 99% of the tumors are shown in Figure 3 and Figure 4, respectively. The results are consistent with the existence of a concerted promigration, proangiogenesis, and progrowth effort of the tumor. The expression levels of a number of genes implicated in migration and invasion including ANGPT2, MMP2, FN1, and the genes that encode the α-5 and α-4 integrins (ITGA5 and ITGA4) were upregulated. ANGPT2 is believed to enhance glioma invasion through enhanced matrix metalloproteinase 2 expression and secretion; this effect is mediated by its interaction with α5-β1 integrins and by the activation of key signaling pathways.16,17 TIMP3 has been shown to promote glioma cell invasion.18,19 Integrin α5-β3 is known to enhance angiogenesis and tumor growth.19 The genes encoding the molecules that promote angiogenesis and tumor growth, including VEGFB,20 angiopoietinlike 2, interleukin 8,21 platelet endothelial cell adhesion molecule 1,22 and Perlecan were also found to be upregulated. Perlecan regulates prostate cancer cell growth via the Sonic Hedgehog pathway.23 Interestingly, the expression levels of TSP1 and TSP2 were not elevated compared with control brains in 60% and 87% of the tumors, respectively.
Figure 3.

Genes differentially expressed in 100% of tumors. Shown are the log2-transformed expression ratios of the genes whose expression levels in 15 of 15 tumors fall outside the reference range determined from 5 control brains. ANGPT2indicates the gene encoding angiopoietin 2; COL4A1, collagen type IV α1; COL4A2, collagen type IV α2; EDIL3, epithelial growth factor–like repeats and discoidin I–like domains containing protein 3; FN1, fibronectin 1; IL8, interleukin 8; ITGA4, integrin α4; ITGB3, integrin β3; NRP2, neuropilin 2; and PECAM1, platelet-endothelial cell adhesion molecule 1.
Figure 4.
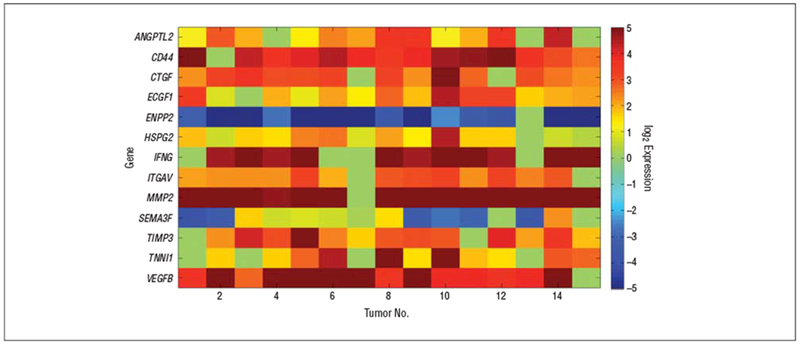
Genes differentially expressed in 73% to 99% of the tumors. Shown are the log2-transformed expression ratios of the genes whose expression levels in 11 to 14 of 15 tumors fall outside the reference range determined from 5 control brains. ANGPTL2 indicates the gene encoding angiopoietin-like 2; CD44, CD44 antigen; CTGF, connective tissue growth factor; ECGF-1, endothelial cell growth factor 1, thymidine phosphorylase, ectonucleotide pyrophosphatase/ phosphodiesterase 2; HSPG2, heparan sulfate proteoglycan of basement membrane; INFG, suppressor of cytokine signaling 1; ITGAV, integrin α5; MMP2, matrix metalloproteinase 2; SEMA3F, semaphorin 3F; TIMP3, tissue inhibitor of metalloproteinase 3; TINN1, troponin 1; VEGFB, vascular endothelial growth factor B.
Finally, we examined the differential gene expression in tumors from patients who were still alive (RNA was available for 2 patients still alive >3 years from enrollment) compared with those who did not survive (RNA was available for 13 patients) using a 2-sample t test (P< .01). The results revealed that low expression levels of TIE1 and FGF1 correlate with longer survival times. The gene expression heat maps are shown in Figure 5. TIE1 is an orphan receptor tyrosine kinase that is expressed almost exclusively in endothelial cells and is required for normal embryonic vascular development. Signaling through TIE1 and its biological effects are not well understood; nevertheless, autophosphorylation of TIE1 leads to downstream activation of phosphoinositide kinase and Akt (protein kinase B family) and inhibition of apoptosis.24–27 Acidic fibroblast growth factor 1 (FGF-1) is a member of the fibroblast growth factor family that binds with high affinity to all 4 fibroblast growth factor receptors, which are involved in diverse cellular processes such as tumor cell migration and angiogenesis. Thus, it is not surprising that low FGF1 expression correlates with long survival times.28
Figure 5.
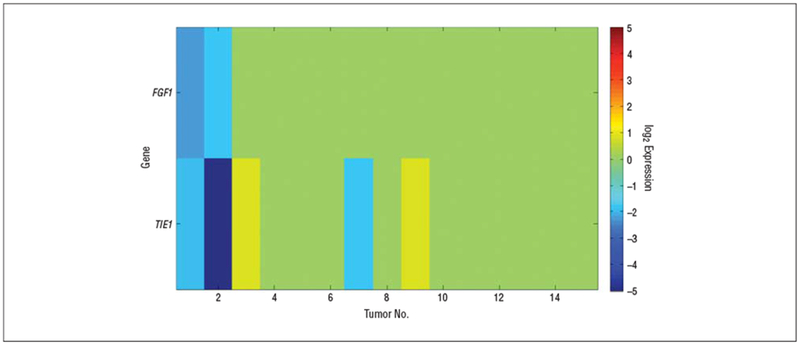
Molecules that correlate with longer survival times. Shown are the genes discovered in a 2-sample t test at the 1% significance level comparing the expression levels of patients who were still alive with the expression levels of those who did not survive. TIE1 indicates the gene encoding tyrosine kinase with immunoglobulin and endothelial growth factor homology domains 1; FGF1, fibroblast growth factor 1.
COMMENT
This is one of the first studies to focus on the clinical evaluation of endogenous inhibitors of angiogenesis as an antiangiogenesis strategy exclusively in glioblastoma. The primary objective of the study, which was to define the MTD of ABT-510, was not met, as the highest available formulation did not generate DLTs.
The adverse events described in this study were similar to those described in other early-phase trials of ABT-510 in patients with cancer. Injection site reactions (erythema and edema) and fatigue (asthenia) were noted in 46% and 32%, respectively, of patients with advanced cancer enrolled in a phase I trial of 2 different dose schedules of ABT-510.29 The maximum dose explored in the study was 100 mg each day, and all of the adverse events related to ABT-510 were graded as mild. In a phase II study in patients with advanced renal cell carcinoma, the primary adverse events remained injection site reactions and fatigue; however 20% of grade 3 or 4 events were judged by the investigators to be possibly or probably related to treatment.30 Our results expand on these findings in 3 ways. First, the addition of ABT-510 to standard chemoradiation for malignant glioma did not result in an increase in adverse events or the identification of new events not previously described. Second, we did not see evidence of intracranial hemorrhage, even asymptomatic occurrences, as an untoward event in patients with intracranial malignancies. Third, the maximum dose was expanded to 200 mg per day without a change in the pattern or grade of adverse events. The hematological toxicities affecting 18.5% of patients were felt to be secondary to temozolomide and are consistent with hematological toxicity rates previously described for the use of temozolomide with radiation therapy.2 These findings suggest that addition of the endogenous inhibitor of angiogenesis ABT-510 to standard chemoradiation was well tolerated by patients with glioblastoma.
The analysis of secondary outcomes of this trial, including time to progression and overall survival time, were slightly improved when considering results from larger randomized trials.2 This is encouraging for a phase I trial when optimal dosing has not been established. Given the minimal toxicity seen and the promise of survival, we would recommend future studies of ABT-510 at a dose of 200 mg per day combined with temozolomide and radiation therapy for newly diagnosed glioblastoma.
The use of quantitative real-time polymerase chain reaction to evaluate gene expression in pretreatment tumor tissues provided a powerful opportunity to expand our understanding of glioma angiogenesis in the context of an antiangiogenesis phase I clinical trial. The use of TaqMan chemistry provided us with several advantages including the ability to use RNA extracted from archival patient tumor blocks that had been routinely formalin-fixed and paraffin embedded, robust quantification with real-time polymerase chain reaction, and the ability to use a commercially available, predefined angiogenesis gene array. The Applied Biosystems Angiogenesis gene array allows for the quantification of 92 genes associated with angiogenesis and 4 endogenous controls. The use of control brain tissues from 5 patients without tumor allowed us to define a reference range of variability of gene expression levels and to discover genes whose expression levels fall outside this range (P < .05). The results reveal a multimolecular system that appears to support angiogenesis, enhanced migration/invasion, and growth (Figures 3, 4, and 5). Furthermore, the pretreatment tumor tissues of patients with the longest survival times showed low expression levels of TIE1 and FGF1 (Figure 5; P < .01). Though this is a phase I study and the patient number is small, the findings raise many questions and uncover interesting hypotheses that set the stage for future studies. In particular, though TSP1 and FGF1 exert opposing effects on angiogenesis, the question arises regarding whether loss of FGF1 and/or TIE1 activity is a necessary condition for TSP-1 to yield therapeutic clinical benefits; specifically, whether the downregulation of FGF1 and/or TIE1 may be markers that predict tumor response to TSP-1.31,32 Recall that the molecular studies, performed on tumor samples obtained before TSP-1 was given, revealed an apparent molecular system that supports angiogenesis, growth, and tumor cell migration (Figures 3, 4, and 5). Studying the reaction of this molecular system to TSP-1 and how this reaction might correlate with clinical benefits may advance our understanding of the biology of glioblastoma and yield valuable clinical tools.
In conclusion, the addition of the thrombospondin-1 fragment, TSP-1, to standard therapy for newly diagnosed patients with glioblastoma was well tolerated without unexpected adverse or serious adverse events. The time to progression and overall survival times of these patients were encouraging in light of historical expectations. Future phase 2 studies should be considered for the newly diagnosed glioblastoma population using the 200 mg per day dose as the maximum clinically feasible dose. Also, the addition of ABT-510 as an endogenous inhibitor of angiogenesis to VEGF-targeted therapies such as bevacizumab and VEGF trap offer a unique opportunity for synergy without toxicity overlap. The use of quantitative real-time polymerase chain reaction and low-density arrays provides a unique and powerful method to extract gene expression data from early-phase clinical trials and should be expanded in phase II studies with emphasis on FGF and TIE1 expression as markers of responsiveness to thrombospondin mimetics.
Supplementary Material
Acknowledgments
Funding/Support: This study was supported by grants P50 CA097247 and P50 CA097247-S1 from the National Cancer Institute.
Footnotes
Financial Disclosure: None reported.
Previous Presentation: This data was presented in part at the American Society of Clinical Oncology Annual Meeting; May 29, 2009; Orlando, Florida; and at the National Cancer Institute Translates Meeting; November 6, 2009; Washington, DC.
Online-Only Material: The eTables are available at http://archneurol.com.
REFERENCE
- 1.Central Brain Tumor Registry of the United States. Statistical Report: Primary Brain Tumors in the United States, 2000-2004. Hinsdale, IL: Central Brain Tumor Registry of the United States; 2008. [Google Scholar]
- 2.Stupp R, Mason WP, van den Bent MJ, et al. ; European Organisation for Research and Treatment of Cancer Brain Tumor and Radiotherapy Groups; National Cancer Institute of Canada Clinical Trials Group. Radiotherapy plus concomitant and adjuvant temozolomide for glioblastoma. N Engl J Med. 2005; 352(10):987–996. [DOI] [PubMed] [Google Scholar]
- 3.Plate KH, Breier G, Weich HA, Risau W. Vascular endothelial growth factor is a potential tumour angiogenesis factor in human gliomas in vivo. Nature. 1992; 359(6398):845–848. [DOI] [PubMed] [Google Scholar]
- 4.Vredenburgh JJ, Desjardins A, Herndon JE II, et al. Phase II trial of bevacizumab and irinotecan in recurrent malignant glioma. Clin Cancer Res. 2007;13(4): 1253–1259. [DOI] [PubMed] [Google Scholar]
- 5.Friedman HS, Prados MD, Wen PY, et al. Bevacizumab alone and in combination with irinotecan in recurrent glioblastoma. J Clin Oncol. 2009;27(28):4733–4740. [DOI] [PubMed] [Google Scholar]
- 6.Rege TA, Fears CY, Gladson CL. Endogenous inhibitors of angiogenesis in malignant gliomas: nature’s antiangiogenic therapy. Neuro Oncol. 2005;7(2):106–121. [DOI] [PMC free article] [PubMed] [Google Scholar]
- 7.Chen H, Herndon ME, Lawler J. The cell biology of thrombospondin-1. Matrix Biol. 2000;19(7):597–614. [DOI] [PubMed] [Google Scholar]
- 8.Simantov R, Silverstein RL. CD36: a critical anti-angiogenic receptor. Front Biosci. 2003;8:s874–s882. [DOI] [PubMed] [Google Scholar]
- 9.Fears CY, Grammer JR, Stewart JE Jr, et al. Low-density lipoprotein receptor-related protein contributes to the antiangiogenic activity of thrombospondin-2 in a murine glioma model. Cancer Res. 2005;65(20):9338–9346. [DOI] [PubMed] [Google Scholar]
- 10.Dawson DW, Volpert OV, Pearce SF, et al. Three distinct D-amino acid substitutions confer potent antiangiogenic activity on an inactive peptide derived from a thrombospondin-1 type 1 repeat. Mol Pharmacol. 1999;55(2):332–338. [DOI] [PubMed] [Google Scholar]
- 11.Reiher FK, Volpert OV, Jimenez B, et al. Inhibition of tumor growth by systemic treatment with thrombospondin-1 peptide mimetics. Int J Cancer. 2002;98 (5):682–689. [DOI] [PubMed] [Google Scholar]
- 12.Haviv F, Bradley MF, Kalvin DM, et al. Thrombospondin-1 mimetic peptide inhibitors of angiogenesis and tumor growth: design, synthesis, and optimization of pharmacokinetics and biological activities. J Med Chem. 2005;48(8):2838–2846. [DOI] [PubMed] [Google Scholar]
- 13.Anderson JC, Grammer JR, Wang W, et al. ABT-510, a modified type 1 repeat peptide of thrombospondin, inhibits malignant glioma growth in vivo by inhibiting angiogenesis. Cancer Biol Ther. 2007;6(3):454–462. [DOI] [PubMed] [Google Scholar]
- 14.Rege TA, Stewart J Jr, Dranka B, Benveniste EN, Silverstein RL, Gladson CL. Thrombospondin-1-induced apoptosis of brain microvascular endothelial cells can be mediated by TNF-R1. J Cell Physiol. 2009;218(1):94–103. [DOI] [PMC free article] [PubMed] [Google Scholar]
- 15.Grunda JM, Nabors LB, Palmer CA, et al. Increased expression of thymidylate synthetase (TS), ubiquitin specific protease 10 (USP10) and survivin is associated with poor survival in glioblastoma multiforme (GBM). J Neurooncol. 2006; 80(3):261–274. [DOI] [PubMed] [Google Scholar]
- 16.Hu B, Jarzynka MJ, Guo P, Imanishi Y, Schlaepfer DD, Cheng SY. Angiopoietin 2 induces glioma cell invasion by stimulating matrix metalloprotease 2 expression through the alphavbeta1 integrin and focal adhesion kinase signaling pathway. Cancer Res. 2006;66(2):775–783. [DOI] [PMC free article] [PubMed] [Google Scholar]
- 17.Hu B, Guo P, Fang Q, et al. Angiopoietin-2 induces human glioma invasion through the activation of matrix metalloprotease-2. Proc Natl Acad Sci USA. 2003; 100(15):8904–8909. [DOI] [PMC free article] [PubMed] [Google Scholar]
- 18.Huang H, Colella S, Kurrer M, Yonekawa Y, Kleihues P, Ohgaki H. Gene expression profiling of low-grade diffuse astrocytomas by cDNA arrays. Cancer Res. 2000;60(24):6868–6874. [PubMed] [Google Scholar]
- 19.Gabriely G, Wurdinger T, Kesari S, et al. MicroRNA 21 promotes glioma invasion by targeting matrix metalloproteinase regulators. Mol Cell Biol. 2008;28 (17):5369–5380. [DOI] [PMC free article] [PubMed] [Google Scholar]
- 20.Gollmer JC, Ladoux A, Gioanni J, et al. Expression of vascular endothelial growth factor-b in human astrocytoma. Neuro Oncol 2000;2(2):80–86. [DOI] [PMC free article] [PubMed] [Google Scholar]
- 21.Samaras V, Piperi C, Levidou G, et al. Analysis of interleukin (IL)-8 expression in human astrocytomas: associations with IL-6, cyclooxygenase-2, vascular endothelial growth factor, and microvessel morphometry. Hum Immunol. 2009; 70(6):391–397. [DOI] [PubMed] [Google Scholar]
- 22.Aroca F, Renaud W, Bartoli C, Bouvier-Labit C, Figarella-Branger D. Expression of PECAM-1/CD31 isoforms in human brain gliomas. J Neurooncol. 1999;43 (1):19–25. [DOI] [PubMed] [Google Scholar]
- 23.Datta MW, Hernandez AM, Schlicht MJ, et al. Perlecan, a candidate gene for the CAPB locus, regulates prostate cancer cell growth via the Sonic Hedgehog pathway. Mol Cancer. 2006;5:9. [DOI] [PMC free article] [PubMed] [Google Scholar]
- 24.Loughna S, Sato TN. A combinatorial role of angiopoietin-1 and orphan receptor TIE1 pathways in establishing vascular polarity during angiogenesis. Mol Cell. 2001;7(1):233–239. [DOI] [PubMed] [Google Scholar]
- 25.Eklund L, Olsen BR. Tie receptors and their angiopoietin ligands are context-dependent regulators of vascular remodeling. Exp Cell Res. 2006;312(5):630–641. [DOI] [PubMed] [Google Scholar]
- 26.Singh H, Milner CS, Aguilar Hernandez MM, Patel N, Brindle NP. Vascular endothelial growth factor activates the Tie family of receptor tyrosine kinases. Cell Signal. 2009;21(8):1346–1350. [DOI] [PubMed] [Google Scholar]
- 27.Kontos CD, Cha EH, York JD, Peters KG. The endothelial receptor tyrosine kinase Tie1 activates phosphatidylinositol 3-kinase and Akt to inhibit apoptosis. Mol Cell Biol. 2002;22(6):1704–1713. [DOI] [PMC free article] [PubMed] [Google Scholar]
- 28.Stefanik DF, Rizkalla LR, Soi A, Goldblatt SA, Rizkalla WM. Acidic and basic fibroblast growth factors are present in glioblastoma multiforme. Cancer Res 1991; 51(20):5760–5765. [PubMed] [Google Scholar]
- 29.Gordon MS, Mendelson D, Carr R, et al. A phase 1 trial of 2 dose schedules of ABT-510, an antiangiogenic, thrombospondin-1-mimetic peptide, in patients with advanced cancer. Cancer. 2008;113(12):3420–3429. [DOI] [PubMed] [Google Scholar]
- 30.Ebbinghaus S, Hussain M, Tannir N, et al. Phase 2 study of ABT-510 in patients with previously untreated advanced renal cell carcinoma. Clin Cancer Res. 2007; 13(22 pt 1):6689–6695. [DOI] [PubMed] [Google Scholar]
- 31.Taraboletti G, Belotti D, Giavazzi R. Thrombospondin modulates basic fibroblast growth factor activities on endothelial cells. EXS 1992;61:210–213. [DOI] [PubMed] [Google Scholar]
- 32.Taraboletti G, Roberts D, Liotta LA, Giavazzi R. Platelet thrombospondin modulates endothelial cell adhesion, motility, and growth: a potential angiogenesis regulatory factor. J Cell Biol. 1990;111(2):765–772. [DOI] [PMC free article] [PubMed] [Google Scholar]
Associated Data
This section collects any data citations, data availability statements, or supplementary materials included in this article.