

Abstract
Seipin, the gene that causes Berardinelli‐Seip congenital lipodystrophy type 2 (BSCL2), is important for adipocyte differentiation and lipid homeostasis. Previous studies in Drosophila revealed that Seipin promotes ER calcium homeostasis through the Ca2+‐ATPase SERCA, but little is known about the events downstream of perturbed ER calcium homeostasis that lead to decreased lipid storage in Drosophila dSeipin mutants. Here, we show that glycolytic metabolites accumulate and the downstream mitochondrial TCA cycle is impaired in dSeipin mutants. The impaired TCA cycle further leads to a decreased level of citrate, a critical component of lipogenesis. Mechanistically, Seipin/SERCA‐mediated ER calcium homeostasis is important for maintaining mitochondrial calcium homeostasis. Reduced mitochondrial calcium in dSeipin mutants affects the TCA cycle and mitochondrial function. The lipid storage defects in dSeipin mutant fat cells can be rescued by replenishing mitochondrial calcium or by restoring the level of citrate through genetic manipulations or supplementation with exogenous metabolites. Together, our results reveal that Seipin promotes adipose tissue lipid storage via calcium‐dependent mitochondrial metabolism.
Keywords: calcium, lipid storage, metabolism, mitochondrion, Seipin
Subject Categories: Membrane & Intracellular Transport, Metabolism
Introduction
Impaired lipid metabolism is associated with an imbalance in energy homeostasis and many other disorders. Excessive lipid storage results in obesity, while a lack of adipose tissue leads to lipodystrophy. Clinical investigations reveal that obesity and lipodystrophy share some common secondary effects, especially non‐alcoholic fatty liver disease and severe insulin resistance (Chehab, 2008). Berardinelli‐Seip congenital lipodystrophy type 2 (BSCL2/CGL2) is one of the most severe lipodystrophy diseases (Magre et al, 2001). Patients with BSCL2 manifest almost total loss of adipose tissue as well as fatty liver, insulin resistance, and myohypertrophy (Cartwright & Goodman, 2012). BSCL2 results from mutation of the Seipin gene, which is highly conserved from yeast to human (Fei et al, 2008).
To study the function of Seipin, genetic models were established in different organisms, including yeast, fly, and mouse, and in human cells (Szymanski et al, 2007; Cui et al, 2011; Fei et al, 2011b; Tian et al, 2011). As a transmembrane protein residing in the endoplasmic reticulum (ER) and in the vicinity of lipid droplet (LD) budding sites, Seipin has been shown to be involved in LD formation (Szymanski et al, 2007; Wang et al, 2016), phospholipid metabolism (Fei et al, 2008, 2011c), lipolysis (Zhou et al, 2015, 2016), and ER calcium homeostasis (Bi et al, 2014). As a result of the functional studies in these models, several factors that interact with Seipin protein were identified, such as the phosphatidic acid phosphatase lipin, 14‐3‐3β, and glycerol‐3‐phosphate acyltransferase (GPAT; Sim et al, 2012; Yang et al, 2014; Talukder et al, 2015; Pagac et al, 2016). Drosophila Seipin (dSeipin) functions tissue autonomously in preventing ectopic lipid accumulation in salivary gland (a non‐adipose tissue) and in promoting lipid storage in fat tissue (Tian et al, 2011). The non‐adipose tissue phenotype is likely attributed to the increased level of phosphatidic acid (PA) generated by elevated GPAT activity (Pagac et al, 2016). We also found that in adipose tissue, Seipin interacts with the ER Ca2+‐ATPase SERCA, whose activity is reduced in dSeipin mutants, leading to reduced ER calcium levels. Further genetic analysis suggested that the perturbed level of intracellular calcium contributes to the lipodystrophy (Bi et al, 2014). However, it is not known how the depleted ER calcium pool causes decreased lipid storage.
Besides the ER, mitochondria are another important intracellular calcium reservoir. Mitochondrial calcium is mainly derived from the ER through the IP3R channel (Hayashi & Su, 2007). IP3R not only releases calcium from the ER into the cytosol, but also provides sufficient Ca2+ at mitochondrion‐associated ER membranes (MAMs) for activation of the mitochondrial calcium uniporter (MCU; De Stefani et al, 2016). The mitochondrial Ca2+ level varies greatly in different cell types and can be modulated by influx and efflux channel proteins, such as MCU and NCLX, a mitochondrial Na+/Ca2+ exchanger (Palty et al, 2010). A proper mitochondrial Ca2+ level is implicated in mitochondrial integrity and function (Arruda & Hotamisligil, 2015). Mitochondrial calcium is needed to support the activity of the mitochondrial matrix dehydrogenases in the TCA cycle (Rizzuto et al, 2012). TCA cycle intermediates are used for the synthesis of important compounds, including glucose, amino acids, and fatty acids. Acetyl‐CoA, as the basic building block of fatty acids, is generally derived from glycolysis, the TCA cycle, and fatty acid β‐oxidation. In mammalian adipocytes, acetyl‐CoA derived from the TCA cycle intermediate citrate is crucial for de novo lipid biosynthesis, which contributes significantly to lipid storage (Kurokawa et al, 2010; Harris et al, 2011).
In this study, we used multiple comparative omics to analyze the proteomic, transcriptomic, and metabolic differences between larval fat cells of dSeipin mutants and wild type. Our results reveal an impairment in channeling glycolytic metabolites to mitochondrial metabolism in dSeipin mutant fat cells, and scarcity of mitochondrial Ca2+, are the causative factors of this metabolic dysregulation. We also provide evidence showing that dSeipin lipodystrophy is rescued by restoring mitochondrial calcium or replenishing citrate. We propose that the low ER Ca2+ level in dSeipin mutants cannot maintain a sufficiently high mitochondrial Ca2+ concentration to support the TCA reactions. This in turn leads to reduced lipogenesis in dSeipin mutants.
Results
The levels of glycolytic pathway enzymes are decreased in dSeipin mutant fat cells
In order to characterize the events downstream of Seipin/SERCA and calcium signal‐mediated lipid homeostasis, we performed comparative proteome analysis on dSeipin mutant and wild‐type fat body samples (Bi et al, 2014). We plotted the proteins according to logarithm‐transformed ratios of different samples and P‐value (Fig 1A). The ratios (WT2:WT1) from two wild‐type replicates were treated as quality control. Considering the ratios of proteins from two replicates of dSeipin mutants and wild type (Mutant1:WT1 and Mutant2:WT1), we focused on proteins with a ratio lower than 10−0.5 and a P‐value < 0.01. In addition to two previously identified fatty acid biosynthesis enzymes ATPCL and ACC (Bi et al, 2014), we found that the levels of a set of glycolytic enzymes, including Pgi, Gapdh1, Pgk, Pglym78, Enolase, and pyruvate kinase (PyK/CG7070), are reduced dramatically in dSeipin mutants (Fig 1A and B). As a comparison, the levels of most TCA cycle enzymes are not reduced (Fig 1B). Among these downregulated glycolytic enzymes, the reduction of PyK may be especially relevant, as PyK is a rate‐limiting enzyme which controls the final step of glycolysis by generating pyruvate from phosphoenolpyruvate. Pyruvate is an important precursor of acetyl‐CoA, which is the basic unit for fatty acid synthesis. Pyruvate can be transported into mitochondria by mitochondrial pyruvate carrier (MPC; Bricker et al, 2012), and then, the mitopyruvate can be converted to acetyl‐CoA by pyruvate dehydrogenase (PDH; Severson et al, 1974). Acetyl‐CoA cannot cross the mitochondrial membrane directly and needs to be converted to citrate, which shuttles from mitochondria into the cytosol, where it is converted back to acetyl‐CoA for lipogenesis (Ferramosca et al, 2006). In addition, the glycerin skeleton for lipogenesis can be derived from the glycolysis intermediate dihydroxyacetone phosphate. Therefore, the reduced levels of glycolytic pathway enzymes in dSeipin mutants raise the possibility that compromised glycolysis subsequently decreases lipogenesis and causes the reduced lipid storage in dSeipin mutant fat cells. Besides decreased lipogenesis, hyperactive lipolysis may also lead to lipid storage reduction. Therefore, we measured the ex vivo activity of TAG hydrolase in larval fat tissue. We found that lipolysis activities of dSeipin mutants are not significantly different from the wild‐type control (Appendix Fig S1), suggesting that the decreased lipid storage of dSeipin mutant likely results from defects in lipid synthesis rather than from hyperactive lipolysis.
Figure 1. Glycolytic protein levels are decreased in dSeipin mutant fat bodies and characterization of the genetic interaction between the glycolytic pathway and dSeipin .
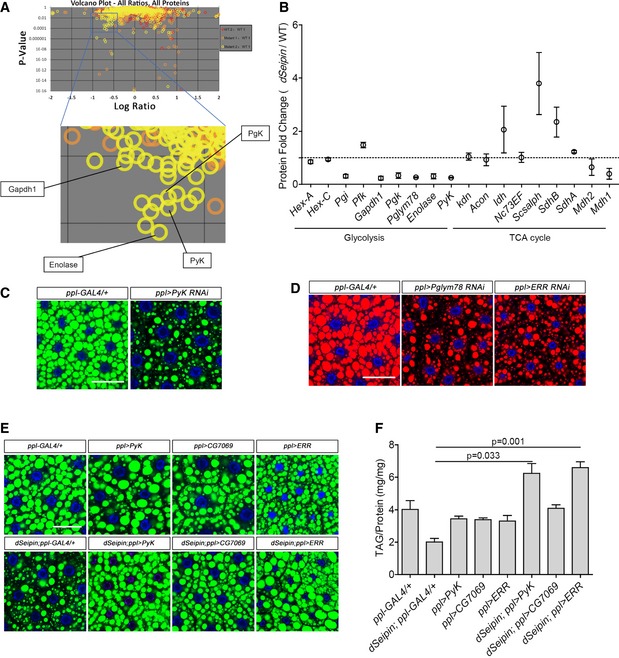
- Volcano plots of iTRAQ proteomics analysis of third‐instar larval fat bodies (top). Four glycolytic proteins are indicated in the zoomed frame (bottom). The volcano plots show the logarithm‐transformed ratios of all quantitative proteins in different samples (x‐axis, WT2:WT1, red circles; Mutant1:WT1, orange‐yellow; Mutant2:WT1, yellow) versus the probability that the difference from the unity ratio (1:1) is random (P‐values on the y‐axis). The target‐decoy method was used to estimate the false discovery rate (FDR). The channels WT1 and WT2 are two equivalent biological replicates of the wild‐type control, and the ratio of WT2:WT1 was assigned as the decoy. The channels Mutant1 and Mutant2 are two equivalent biological replicates for the dSeipin mutant, and the ratios of Mutant1:WT1 and Mutant2:WT1 were assigned as the targets.
- Data mining from (A). The levels of most glycolytic proteins are dramatically decreased in dSeipin mutant fat cells, while the enzymes of the TCA cycle are not reduced (two replicates for each phenotype).
- BODIPY staining of lipid droplets in third‐instar larval fat bodies of PyK RNAi and ppl‐GAL4 control. Nuclei were stained by DAPI.
- Nile red staining of lipid droplets in third‐instar larval fat bodies of Pglym78 RNAi, ERR RNAi, and ppl‐GAL4 control. Nuclei were stained by DAPI.
- Overexpressing PyK or ERR in dSeipin mutant fat bodies rescues the lipid storage phenotype. Lipid droplets were stained by BODIPY, and nuclei were stained by DAPI.
- TAG levels in third‐instar larval fat bodies of different genetic backgrounds, related to (E). TAG levels were normalized to protein content (n = 5, fat bodies from ≥ 10 larvae were used for each repeat).
To test whether the impaired glycolysis causes lipid storage defects in Drosophila, we performed fat body‐specific knockdowns of several key glycolytic genes, including PyK and Pglym78. Neutral lipid dye staining results suggest that depleting either PyK or Pglym78 is sufficient to cause lipodystrophy in third‐instar larvae (Fig 1C and D). ERR is the best‐known master transcriptional regulator of the whole glycolysis pathway in Drosophila (Tennessen et al, 2011). ERR RNAi in larval fat bodies also results in lipodystrophy (Fig 1D). Additionally, to investigate the contribution of glycolysis to lipogenesis in mammalian cells, we also knocked down pyruvate kinase in human HepG2 cells. There are four pyruvate kinases, PKM1, PKM2, PKL, and PKR, in human. Since PKM2 is the highest expressed one in HepG2 cells based on quantitative RT–PCR (qRT–PCR; Appendix Fig S2A), we focused on PKM2. To promote lipid droplet accumulation, cells were treated with oleic acid (OA). The neutral lipid staining result suggests that in both OA‐loaded and non‐OA conditions, knockdown of PKM2 causes a reduction of lipid storage (Appendix Fig S2B). This indicates that the contribution of glycolysis to lipid storage is conserved in fruit fly and human cells. Taken together, these results demonstrate that glycolysis is required for proper lipid storage in the Drosophila larval fat body and raise the possibility that reduced glycolytic enzyme levels might be the cause of the lipodystrophy in dSeipin mutants.
Decreased lipid storage in dSeipin mutants and SERCA RNAi animals can be restored by elevating glycolysis
Based on the above hypothesis, elevating glycolysis may rescue the lipid storage defects in dSeipin mutants. Indeed, fat body‐specific overexpression of PyK (CG7070) significantly rescues the lipid storage defects in both dSeipin mutants and animals expressing SERCA RNAi (Fig 1E and Appendix Fig S3). Triacylglycerol (TAG) measurements also support the rescuing effect (Fig 1F). Furthermore, ectopic expression of CG7069, which encodes another putative pyruvate kinase that is not expressed in fat body, also rescues the larval lipid storage defect of dSeipin mutants albeit not to the same extent as PyK (Fig 1E and F). Overexpression of ERR, which could be considered as elevating glycolysis activity overall, also rescues the lipid storage defects in both dSeipin mutant and SERCA RNAi larvae (Fig 1E and F, and Appendix Fig S3). Taken together, the results of these rescuing experiments suggest that stimulating endogenous pyruvate production can effectively mitigate the lipodystrophy of dSeipin mutants and SERCA RNAi animals.
Transcription of glycolytic genes is not reduced in dSeipin mutant fat tissue
We then examined the link between Seipin/SERCA‐mediated lipid homeostasis and the protein levels of glycolytic enzymes. We hypothesized that the reduced protein levels of multiple glycolytic enzymes in dSeipin mutants is due to decreased gene transcription, because the transcription of functionally related genes is often controlled by a common transcription factor. Since ERR is well known for its role in regulating glycolysis, we explored the potential link between dSeipin and ERR. If Seipin/SERCA signals through ERR‐mediated transcription, we would expect a reduction in the transcription of ERR‐targeted glycolytic genes in dSeipin mutants. Comparative transcriptome analysis was performed in larval fat body samples of dSeipin mutants and wild type. To our surprise, despite the dramatic reduction in protein levels, the transcript levels of many glycolytic genes, including PyK, Pgi, Pgd, and Pglym78, are not reduced in dSeipin mutants compared to controls (Appendix Fig S4A). The transcriptions of Pgi and Pgd are even slightly elevated in dSeipin mutants (Appendix Fig S4A). These results indicate that ERR is unlikely to be the mediator of the Seipin‐glycolysis axis.
We also used Gene Set Enrichment Analysis (GSEA) to identify significant patterns in genes that share common biological functions or signaling pathways in the comparative transcriptome analysis (Subramanian et al, 2005). GSEA shows that gene sets involved in glycolysis and pyruvate metabolism are not enriched in the transcripts that are differentially expressed in dSeipin mutant fat bodies (Appendix Fig S4B and C). This argues against the possibility that dSeipin affects the transcription program of the glycolytic pathway. Interestingly, the gene set for calcium signaling scores high in GSEA (Appendix Fig S4D), which is consistent with and further supports our previous conclusion that calcium homeostasis is affected in dSeipin mutants (Bi et al, 2014).
TCA cycle metabolites are decreased in dSeipin mutant fat cells
If downregulated glycolysis is the real cause of defective lipid storage, we should expect a reduction in glycolytic metabolites in dSeipin mutants. In order to determine the levels of glycolytic intermediates, in particular pyruvate, we performed comparative metabolome analysis in five replicates of fat bodies from wild‐type controls and dSeipin mutants. Due to limited resolution, we were only able to identify 58 metabolites with confidence (Appendix Table S1). Hierarchical clustering analysis (HCA) of non‐amino acid metabolites clearly separates controls and dSeipin mutants (Fig 2A). Unexpectedly, HCA results show that several glycolytic metabolites actually accumulate in dSeipin mutant larval fat cells (Fig 2A). For example, compared to wild type, lactic acid was increased 2.5‐fold in dSeipin mutants (Fig 2A and Appendix Table S1). Importantly, although the PyK protein level was significantly reduced in dSeipin mutants, pyruvate was increased 3.1‐fold in dSeipin mutants compared to wild type (Fig 2A and Appendix Table S1). This result argues against the hypothesis that the lipodystrophy in dSeipin mutants results from impaired glycolysis. It is possible that the reduced protein levels of glycolytic enzymes may be due to negative feedback of accumulated metabolic products. In addition, although glycolytic intermediates accumulate in dSeipin mutants, further elevating glycolysis may lead to even higher glycolytic metabolic flow, which can still result in a rescuing effect because of elevated metabolic flow downstream of pyruvate.
Figure 2. The TCA cycle is downregulated in dSeipin mutant fat bodies.
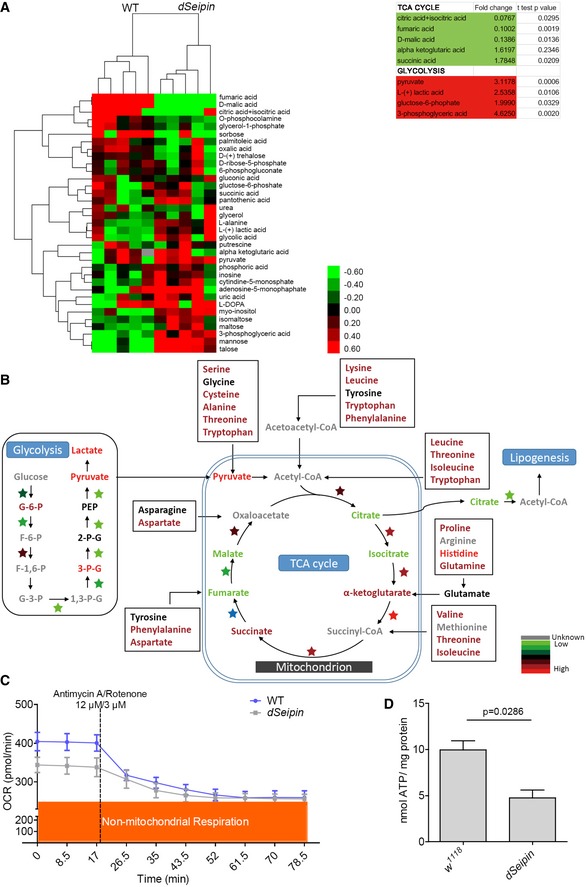
- Hierarchical clustering analysis (HCA) of GC/MS metabolomics data. The colors indicate the relative levels in dSeipin mutant or WT cells. Note that the top three metabolites in the cluster are from the TCA cycle. The fold change and t‐test P‐value are shown in the right panel for several metabolites in the TCA cycle and glycolysis.
- Schematic diagram of metabolic pathways combining the quantitative metabolomics and proteomics data. The metabolites are color‐coded to represent their relative levels in dSeipin mutant third‐instar larval fat tissues compared to WT. The color‐coded stars represent different enzymes, and the colors indicate the relative protein levels in dSeipin mutant cells compared to WT.
- Oxygen consumption rate of third‐instar larval fat bodies (n = 4, fat bodies from 20 larvae were used per well).
- Intracellular ATP levels of third‐instar larval fat bodies (n = 4, fat bodies from ≥ 20 larvae were used for each repeat).
The above results prompted us to examine the metabolic flow downstream of pyruvate in dSeipin mutants. In the HCA results, we noticed that the top three metabolites in the downregulated group are metabolites of the TCA cycle (Fig 2A). In particular, citrate and isocitrate are reduced to less than 10% of wild type in dSeipin mutant samples. Fumaric acid and D‐malic acid are reduced to 10 and 14% of wild type, respectively (Appendix Table S1). Citrate shuttles between the mitochondrion and the cytosol. The cytosolic citrate can be converted into acetyl‐CoA, which is used for lipogenesis (Fig 2B). The reduced amounts of TCA cycle metabolites seem to be due to the low activities of TCA cycle enzymes but not to decreased expression levels, because neither the protein levels nor the mRNA levels of TCA cycle enzymes are reduced based on quantitative proteomic and RNA transcriptome data. In fact, Idh/isocitrate dehydrogenase, Scs‐alpha/succinyl CoA synthetase α‐subunit, and SdhB/succinate dehydrogenase subunit B are upregulated (Fig 1B and Appendix Fig S4A). To sum up, the metabolic analysis argues against the possibility that downregulated glycolysis is the primary causative factor of the lipodystrophy in dSeipin mutants. Moreover, it implies that the lipid storage defect of dSeipin mutant fat bodies is caused by impairment of the TCA cycle and the production of low levels of TCA cycle metabolites, such as citrate, that are required for lipogenesis.
In addition to the elevated glycolytic end products and decreased metabolites of the TCA cycle, many amino acids supplying the TCA cycle accumulate in dSeipin mutant fat bodies (Fig 2B and Appendix Table S1). This suggests that mitochondrial function is impaired. To assess the activity of mitochondria, we examined the respiratory ability of mitochondria by monitoring the oxygen consumption rate (OCR) in dissected third‐instar larval fat bodies. We found that the basal mitochondrial oxygen consumption rate of dSeipin mutant fat bodies is lower than that of wild‐type controls (Fig 2C). Application of electron transport chain inhibitors (rotenone/antimycin A) revealed that the non‐mitochondrial respiration level in dSeipin mutants was comparable to that in wild‐type controls (Fig 2C). These results indicate that the overall mitochondrial respiration in dSeipin mutant fat cells is reduced compared to wild type. Since the impairment of mitochondrial function leads to lower ATP yields, we next measured the level of intracellular ATP. Compared to wild type, the intracellular ATP content is reduced by half in dSeipin mutant fat bodies (Fig 2D), which is consistent with the OCR result.
Besides the above steady‐state results, we also assessed the metabolic flux of glycolysis and TCA cycle through isotopic 13C‐glucose tracing experiments in dissected fat bodies (Fig 3A). To ensure that the isolated tissues retain the lipogenic activity, early third‐instar larvae were used in this assay. Compared to controls, the rates of 13C incorporation into glycolytic intermediates, such as glucose‐6‐phosphate/fructose‐6‐phosphate (G6P/F6P), 3‐phosphoglycerate (3PG), phosphoenolpyruvate (PEP), and pyruvate, are not significantly altered or even slightly increased in dSeipin mutants (Fig 3B). In contrast, the rates of 13C incorporation into acetyl‐CoA and TCA cycle intermediates, such as citrate, isocitrate, and ketoglutarate, are reduced in dSeipin mutants (Fig 3B and C). These results indicate that dSeipin mutants exhibit a defect in channeling pyruvate to mitochondrial metabolism, which is consistent with the steady‐state data. Therefore, our results imply that Seipin‐mediated lipid storage involves the mitochondrion, an organelle that was largely ignored in previous Seipin studies.
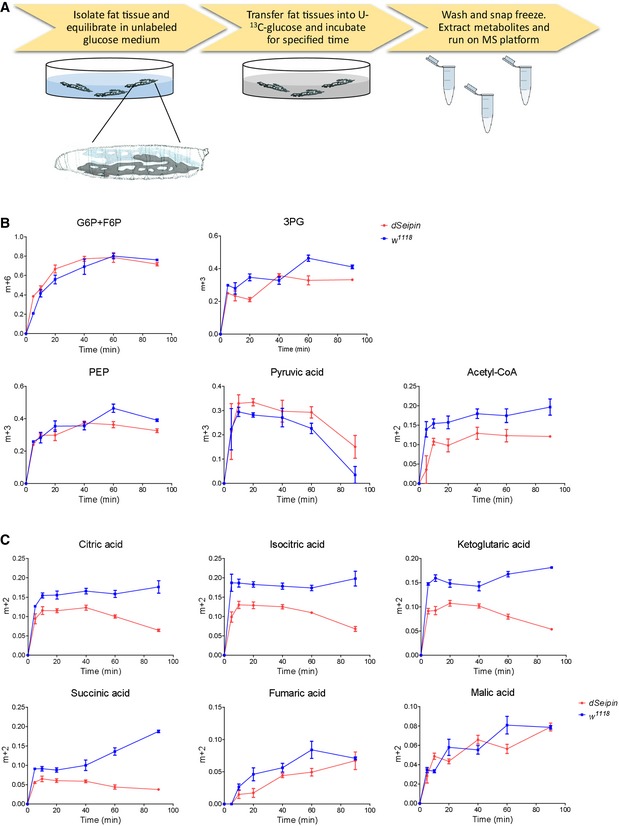
Figure 3. Carbon metabolic flux tracing from isotopic labeled glucose in larval fat bodies.
-
ASchematic of the experimental procedure for U‐13C glucose labeling of isolated Drosophila larval fat tissues.
-
B, CTime‐course fractional 13C labeling of glycolytic metabolites and acetyl‐CoA (B) and TCA cycle metabolites (C) in the fat tissue after incubating with U‐13C‐glucose. The y‐axis in the graphs represents the ratio of intensities (area under the curve) of the labeled mass isotopomers to the sum of the labeled and unlabeled mass isotopomers for a given metabolite. n = 5 for each time point. Fat bodies from 15 larvae were used for each repeat. Error bars represent ±SEM.
External supplementation with pyruvate or citrate rescues the lipodystrophy in dSeipin mutants
The metabolomic results raise the possibility that defective mitochondria in dSeipin mutants may cause the reduction in citrate levels, and the shortage of citrate leads to the low level of lipogenesis. If the level of citrate is important for reduced lipogenesis in dSeipin mutants, supplementation of the culture media with citrate may attenuate the lipodystrophy in dSeipin mutants. We therefore cultured flies on food containing 1, 3, or 10% citrate. Both the 3 and 10% citrate food resulted in low viability, while the 1% citrate diet did not affect larval growth. By BODIPY staining, we found that the 1% citrate diet rescued the reduced lipid storage phenotype of dSeipin mutants (Fig 4A). As a control, diets with an additional 3 or 10% more glucose were tested and were unable to rescue the defective lipid storage (Appendix Fig S5). Moreover, the citrate supplement also significantly rescues the TAG levels in dSeipin mutants (Fig 4B), supporting our citrate‐shortage model of dSeipin lipodystrophy.
Figure 4. External supplementation with citrate or pyruvate rescues the lipodystrophy of dSeipin mutants.
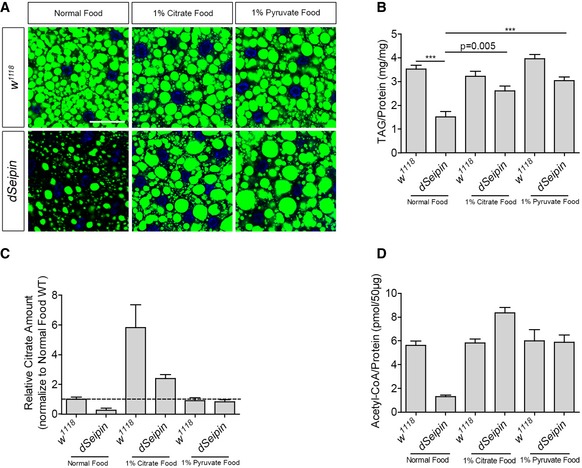
- 1% citrate or 1% pyruvate supplement rescues the fat body lipid storage phenotype of dSeipin mutants. BODIPY staining labels the lipid droplets and DAPI labels the nuclei. Scale bar represents 50 μm.
- Determination of TAG levels in third‐instar larval fat bodies of wild type or dSeipin mutants cultured on different foods, related to (A) (n = 6, fat bodies from ≥ 10 larvae were used for each repeat).
- Measurement of citrate levels in third‐instar larval fat bodies of wild type or dSeipin mutants grown on different foods, related to (A) (n = 3, fat bodies from 20 larvae were used for each repeat).
- Measurement of acetyl‐CoA levels in third‐instar larval fat bodies of wild type or dSeipin mutants grown on different foods, related to (A) (n = 3, fat bodies from 15 larvae were used for each repeat).
In line with the citrate‐shortage model, we then wondered why elevating glycolysis by overexpressing PyK or ERR reversed the lipodystrophy of dSeipin mutants (Fig 1E). It is possible that despite the reduced efficiency of the TCA cycle, elevating the glycolytic flow may lead to a much higher level of pyruvate. Elevating the level of pyruvate can partially restore the citrate level through the TCA cycle (Fig 2B). We tested this possibility by examining the effect of pyruvate supplementation in dSeipin mutants. Sodium pyruvate was added into the fly medium at a concentration of 1, 3, or 10%. Similar to the citrate treatments, high concentrations (3 or 10%) of pyruvate are toxic, leading to low viability of both wild type and dSeipin mutants. Interestingly, the 1% pyruvate diet efficiently rescued the decreased lipid storage phenotype of dSeipin mutants as judged by both BODIPY staining and TAG measurement (Fig 4A and B). We further measured the levels of citrate in wild type and dSeipin mutant fat cells with or without pyruvate treatment, using citrate treatment as a positive comparison. Indeed, although pyruvate treatment did not affect the level of citrate in wild type, it restored the level of citrate in dSeipin mutants. The citrate treatment dramatically increased the level of citrate in both wild type and dSeipin mutants (Fig 4C). Moreover, as the downstream derivate of cytosolic citrate, the reduced level of acetyl‐CoA in dSeipin mutants was also restored by both dietary treatments (Fig 4D). Therefore, both pyruvate and citrate supplements can efficiently restore the intracellular citrate and acetyl‐CoA levels and rescue the lipid storage defects in dSeipin mutants.
Mitochondria are affected in dSeipin mutants
The above results established the involvement of the mitochondrial TCA cycle in dSeipin/SERCA‐mediated lipid storage homeostasis. We also examined the morphology and the activity of mitochondria by MitoTracker Red staining. MitoTracker Red labels active mitochondria, and its accumulation is dependent upon membrane potential. The sizes of mitochondrial puncta stained by MitoTracker Red are reduced significantly in dSeipin mutant fat cells (Fig 5A and B). This result suggests that the mitochondrial activity and/or morphology are abnormal in dSeipin mutants. In order to investigate the fine ultrastructure of mitochondria, we performed transmission electron microscope (TEM) imaging on third‐instar larval fat bodies. Consistent with the reduced lipid storage in dSeipin mutants, the diameter of lipid droplets is greatly reduced in dSeipin mutants (Fig 5C and D). Interestingly, although the MitoTracker Red staining reveals smaller puncta in dSeipin mutants, there is no distinguishable difference in the size of mitochondria in dSeipin mutants and wild type under the TEM (Fig 5C and E). This suggests that mitochondrial activity, but not size, is altered in dSeipin mutants.
Figure 5. Mitochondrial defects in dSeipin mutant fat cells.
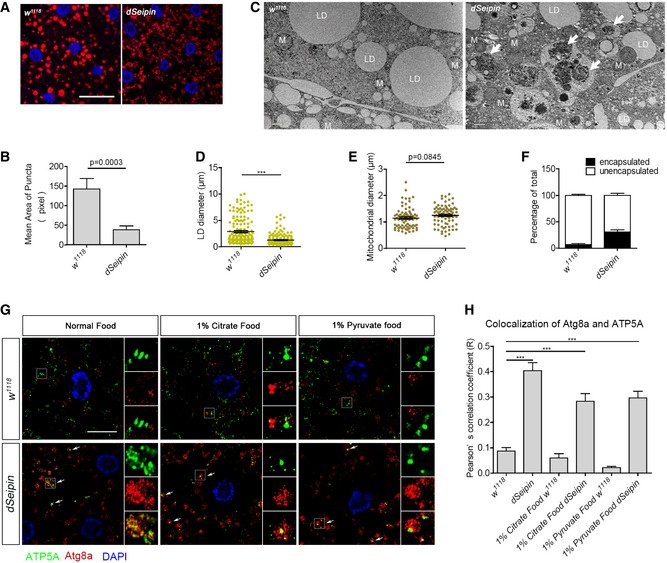
- Mitochondria in third‐instar larval fat bodies are labeled by MitoTracker Red staining. DAPI staining labels the nuclei. Scale bar represents 50 μm.
- Sizes of mitochondrial puncta measured by ImageJ software. Related to (A). (≥1,000 puncta per genotype).
- TEM images of larval fat body cells in wild‐type and dSeipin mutants. Some lipid droplets (LD) and mitochondria (M) are denoted. Some mitochondria are encapsulated by autophagosomes in the dSeipin mutant (indicated by white arrows). Scale bar represents 1 μm.
- Quantification of lipid droplet diameters in the TEM images by ImageJ. Related to (C) (160 lipid droplets for each genotype).
- Quantification of mitochondrial diameters in the TEM images by ImageJ. Related to (C) (80 mitochondria for each genotype).
- Percentage of mitochondria enveloped by autophagosomes. Related to (C) (n = 10, 10 independent pictures are calculated for each genotype).
- Immunostaining of control and dSeipin mutant larval fat tissues. Anti‐ATP5A indicates mitochondria, and anti‐Atg8a indicates autophagosomes. DAPI labels the nuclei. To the right of each picture, the zoomed and channel‐split views of the region enclosed by the white frame are displayed (from top to bottom: ATP5A, Atg8a, and merged). White arrows indicate some mitochondrial signals surrounded by autophagosome signals. Scale bar represents 20 μm.
- Colocalization analysis of ATP5A and Atg8a calculated by Pearson's correlation coefficient (R) (six independent images for each calculation).
In the TEM images, we also noticed that numerous mitochondria are encapsulated by autophagosomes in dSeipin mutants, while few such structures are observed in wild type (Fig 5C and F). We then used an ATP5A antibody to label mitochondria and an Atg8a antibody to label autophagosomes. A significant colocalization of ATP5A‐positive mitochondria and Atg8a‐positive autophagosomes was found in dSeipin mutant fat cells, suggesting that mitophagy is elevated in dSeipin mutants (Fig 5G and H). Taken together, the reduced levels of TCA cycle metabolites, reduced OCR, reduced ATP production, and elevated mitophagy indicate that mitochondrial function is impaired in dSeipin mutant fat cells.
Since pyruvate and citrate supplements rescue the lipid storage defects in dSeipin mutants, we next explored whether these treatments rescue the mitophagy phenotype to further dissect the link between mitophagy and reduced lipid storage. Interestingly, neither pyruvate nor citrate supplements rescue the elevated mitophagy phenotype of dSeipin mutants (Fig 5G and H). This result indicates that the dSeipin mitophagy phenotype is not caused by reduced levels of the TCA metabolite citrate or reduced lipid storage. Nevertheless, it is still possible that increased mitophagy and decreased mitochondrial metabolism both contribute to the lipid storage phenotype.
Reducing mitochondrion‐to‐cytosol calcium release restores the lipid content in dSeipin mutants
Our previous findings indicated that ER calcium homeostasis is disturbed by mutation of dSeipin (Bi et al, 2014). How can the Seipin/SERCA‐calcium signaling axis affect mitochondria? Mitochondrial calcium, a crucial intracellular calcium pool, is derived from the ER through ER–mitochondrion contacts. An adequate level of mitochondrial calcium is required for the proper activity of three matrix dehydrogenases: PDH, isocitrate dehydrogenase, and α‐ketoglutarate dehydrogenase (Denton et al, 1972, 1978; McCormack & Denton, 1979). Interestingly, PDH catalyzes the formation of acetyl‐CoA from mitochondrial pyruvate. Therefore, mitochondrial calcium positively regulates mitochondrial metabolism and ATP production (Griffiths & Rutter, 2009). To test whether influx of ER calcium into mitochondria is required for cellular lipid storage, we performed fat body‐specific knockdown of ERMES (ER–mitochondria encounter structure) genes, which are required for mitochondrial Ca2+ import (Michel & Kornmann, 2012), with ppl‐GAL4‐driven RNAi. The genes targeted by RNAi were CG13838, the putative Drosophila Mmm1; CG43347, the putative Drosophila Mdm10; Marf, the homolog of mammalian mitofusin Mfn2, which positively regulates mitochondrial Ca2+ uptake (de Brito & Scorrano, 2008); and Miro, the homolog of yeast Gem1, which was recently documented as an ERMES member that is required for ER‐mito‐Ca2+ transport in Drosophila (Lee et al, 2016). The level of mitochondrial calcium was detected by Rhod‐2 staining. As expected, the mitochondrial calcium levels in the fat bodies are reduced when these genes are knocked down (Appendix Fig S6A and B). BODIPY staining reveals that lipid storage is also decreased in these knockdowns (Appendix Fig S6C), suggesting that mitochondrial calcium homeostasis is required for proper cellular lipid storage.
We next examined whether the mitochondrial calcium level is affected in dSeipin mutants. Rhod‐2 staining results demonstrate that the mitochondrial calcium level in the third‐instar larval fat body of dSeipin mutants is lower than that of wild type (Fig 6A and B). To test whether the decreased mitochondrial calcium contributes to Seipin‐mediated lipid homeostasis, we manipulated mitochondrial calcium through genetic approaches. Mitochondrial calcium homeostasis is maintained by various channels, including the inner mitochondrial membrane‐resident MCU for calcium influx and NCLX for calcium efflux (De Stefani et al, 2016). Overexpression of Drosophila MCU (CG18769) had no rescuing effect on the lipid storage defects in dSeipin mutant larvae (Fig 6C and D). It is possible that MCU is not a limiting factor for mitochondrial calcium import in fat bodies (Fieni et al, 2012). Consistent with this, RNAi of MCU did not affect the mitochondrial calcium level and lipid storage in fat bodies (Appendix Fig S6). Among the 10 potential Drosophila NCLX homologs (CG14744, CG13223, CG12376, CG5348, CG14743, CG34162, CG12061, CG1090, CG18660, and CG2893), CG18660 is most likely localized to mitochondria based on subcellular localization prediction (http://cello.life.nctu.edu.tw/). To further investigate the subcellular localization of CG18660 in vivo, a CG18660‐EGFP fusion protein was expressed in S2 cells. Immunostaining with anti‐ATP5A antibody shows that CG18660‐EGFP partially colocalizes with mitochondria (Appendix Fig S7). Therefore, CG18660 is the possible Drosophila mitochondrial Na+/Ca2+ exchanger. We found that fat body‐specific knockdown of CG18660 is able to reverse the lipid storage defects in dSeipin mutant fat cells (Fig 6C). TAG measurements also provide evidence for the rescuing effect of CG18660 RNAi in dSeipin mutants (Fig 6D). Similarly, CG18660 RNAi rescues the reduced lipid storage in SERCA RNAi fat bodies (Appendix Fig S3). Importantly, CG18660 RNAi partially restores the mitochondrial calcium level in dSeipin mutant fat cells, while MCU overexpression failed to do so, based on Rhod‐2 staining (Fig 6A and B). Along the same line, RyR RNAi, which is able to rescue the lipodystrophy in dSeipin mutants through retention of ER calcium (Bi et al, 2014), also partially restores the mitochondrial calcium level (Fig 6A and B). These results indicate that decreased mitochondrial calcium contributes to Seipin/SERCA‐mediated lipid homeostasis in Drosophila fat tissue.
Figure 6. Reducing mitochondrial calcium release rescues the lipid storage defects in dSeipin mutants.
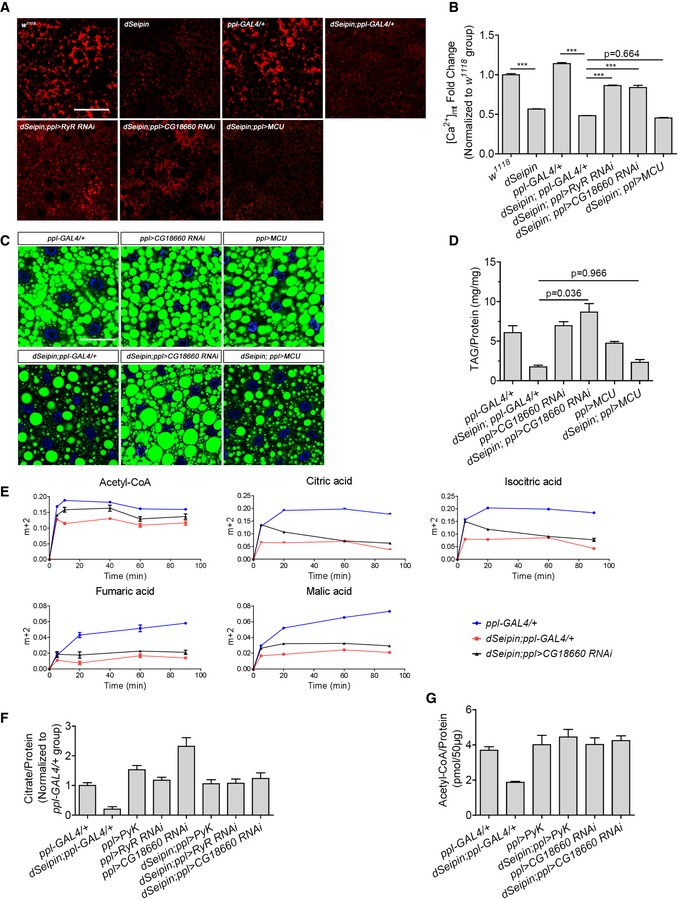
- Rhod‐2 staining indicates the mitochondrial calcium levels in third‐instar larval fat bodies of different genetic backgrounds.
- Mean red fluorescence intensity per unit area measured by ImageJ software. Related to (A) (six independent images for each calculation).
- Knockdown of CG18660 in dSeipin mutant fat bodies rescues the lipid storage phenotype. Lipid droplets are stained by BODIPY and nuclei are stained by DAPI.
- Determination of TAG levels in third‐instar larval fat bodies of different genetic backgrounds, related to (C) (n = 5, fat bodies from ≥ 10 larvae were used for each repeat).
- Time‐course fractional 13C labeling of acetyl‐CoA and selected TCA cycle metabolites in fat tissues after incubation with U‐13C‐glucose. The y‐axis in the graphs represents the ratio of intensities (area under the curve) of labeled mass isotopomers to the sum of the labeled and unlabeled mass isotopomers for a given metabolite (n = 3 for each time point, fat bodies from 15 larvae were used for each repeat).
- Measurement of citrate levels in third‐instar larval fat bodies of different genetic backgrounds (n = 3, fat bodies from 20 larvae were used for each repeat).
- Measurement of acetyl‐CoA levels in third‐instar larval fat bodies of different genetic backgrounds (n = 3, 15 independent fat bodies for each repeat).
Putting the results together, it is likely that the decreased mitochondrial calcium compromises the production of citrate and acetyl‐CoA, leading to reduced lipogenesis and lipid storage defects in dSeipin mutant fat cells. To test this possibility, we monitored the metabolic flux in calcium‐restored dSeipin mutant with CG18660 RNAi. The results reveal that incorporation rates of acetyl‐CoA and four TCA cycle intermediates are partially rescued when mitochondrial Ca2+ is restored (Fig 6E). In addition, this recovery of metabolic activity was also reflected in the steady‐state levels of metabolites. The levels of citrate and acetyl‐CoA were restored in the genetically rescued dSeipin mutants (Fig 6F and G).
The active form of PDH is maintained by mitochondrial Ca2+‐activated PDH phosphatase, and it can be converted to the inactive form by PDH kinase. Dichloroacetate (DCA) can inhibit PDH kinase, thereby activating PDH (Whitehouse et al, 1974). To explore whether DCA can be used as a potential compound to alleviate lipodystrophy of dSeipin mutants, we added 5 and 10 mM DCA to the fly medium. We found that DCA administration can rescue the lipid storage defects of dSeipin mutants (Appendix Fig S8). This further illustrates that mitochondrial acetyl‐CoA synthesis is key for dSeipin‐mediated cellular lipid storage. Altogether, these lines of evidence indicate that mitochondrial calcium‐dependent mitochondrial metabolism is important for dSeipin‐regulated lipid homeostasis in Drosophila larval fat cells (Fig 7).
Figure 7. Proposed working model.
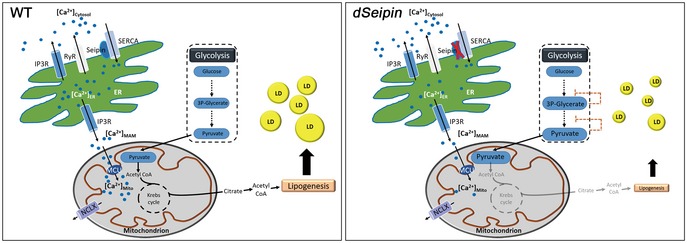
Schematic model showing how the Seipin‐SERCA complex regulates lipid storage by controlling calcium homeostasis in the ER and mitochondria.
Discussion
Our current study reveals that Seipin promotes fat tissue lipid storage via calcium‐dependent mitochondrial metabolism. Defective ER calcium homeostasis in dSeipin mutants is associated with reduced mitochondrial calcium and impaired mitochondrial function, such as low production of TCA cycle metabolites. Restoring mitochondrial calcium levels or replenishing citrate, a key TCA cycle product and also an important precursor of lipogenesis, rescues the lipid storage defects in dSeipin mutant fat cells.
Determining the underlying cause with multiple approaches: lessons beyond genetics
In this study, we investigated the underlying causes of Seipin‐dependent lipodystrophy by integrating multiple omic analyses, including RNA‐seq, quantitative proteomics, and metabolomic analysis. Compared to previous studies based on genetics and traditional cellular phenotypic analysis, these combinatory omic approaches provide an unprecedented spectrum of molecular phenotypes, which not only add new information but also pinpoint logical directions for further investigations.
Omics analyses, in particular lipidomic analysis, have been utilized to investigate the underlying mechanisms in several previous Seipin studies and led to the finding that PA is elevated in several Seipin mutant models (Fei et al, 2008, 2011c; Tian et al, 2011; Jiang et al, 2014; Liu et al, 2014a). In this study, based on genetic rescuing assays and quantitative proteomics analysis, we initially proposed that downregulated glycolysis is the cause of lipodystrophy. However, both the RNA‐seq results and metabolomic data argue against this possibility and suggest a new mechanism. Despite reduced levels of glycolytic enzymes, transcription of the corresponding genes is not affected, and glycolytic metabolites, in particular pyruvate, are increased in dSeipin mutants compared to wild type. Metabolomic data further show that citrate and isocitrate, which are the products of the first two steps of the mitochondrial TCA cycle, are dramatically decreased in dSeipin mutants, suggesting a defective metabolic flow downstream of pyruvate. These results lead to a new possibility that the lipid storage defects in dSeipin mutants are caused by a defective TCA cycle and this is indeed supported by the metabolic flux analysis. Our findings further suggest the involvement of mitochondria. In line with this, the previous discovery that fatty acid β‐oxidation is elevated in dSeipin mutant fat cells may reflect compensation for the reduced TCA cycle and lipogenesis (Bi et al, 2014). This possibility is supported by the results of genetic and citrate‐supplement rescue experiments and by citrate measurements.
It is known that glycolytic enzymes and metabolites are regulated by a metabolic feedback loop (Gruning et al, 2011), which may complicate the explanation of genetic interactions. Our findings highlight that although genetic analysis and rescue results provide important clues, multiple lines of evidence are critical for unraveling complex intracellular pathways. In this case, the combination of omic results and genetic analysis led to the finding that mitochondrial metabolism is important in Seipin‐associated lipodystrophy.
Dual role of mitochondria in lipid metabolism: providing the substrate for lipogenesis and breaking down fatty acids for energy
Mitochondria are hubs in key cellular metabolic processes, including the TCA cycle, ATP production, and amino acid catabolism. Mitochondria also play a central role in lipid homeostasis by controlling two seemingly opposite metabolic pathways, lipid biosynthesis, and fatty acid breakdown. Therefore, impairment of mitochondrial function in different tissues may lead to different, even opposite, phenotypes in lipid storage. In tissues where lipid biosynthesis is the major pathway, defective mitochondria might result in reduced lipid storage, whereas in tissues where fatty acid oxidation prevails, the same defect might lead to increased lipid storage. Reduced lipid storage in dSeipin mutants suggests the former case. The reduced level of citrate and other TCA cycle products in dSeipin mutants suggests an impairment of mitochondrial function. The reduction of OCR and ATP production, the decreased Rhod‐2 staining, and the aberrant enrichment of mitochondria within autophagosomes all further support this notion. Interestingly, in mouse brown adipose tissue, Seipin mutation increases mitochondrial respiration along with normal MitoTracker labeling (Zhou et al, 2016). The discrepancies suggest that Seipin may have cell type‐specific functions. Unlike white adipose tissue, which favors lipid storage/biosynthesis, brown adipose tissue is prone to fatty acid breakdown.
The link between mitochondria and Seipin was concealed in several previous studies. GPATs, which are recently reported Seipin‐interacting proteins, participate in many mitochondrial processes. For example, mitochondria from brown adipocytes that are deficient in GPAT4 exhibit high oxidative levels (Cooper et al, 2015), and mitochondrial GPAT is required for mitochondrial dynamics (Ohba et al, 2013). PA, which is elevated in Seipin mutants, is required for mitochondrial morphology and function (Potting et al, 2013). Similarly, mitochondrial impairments were also observed in various lipodystrophic conditions. Downregulation of mitochondrial transcription and altered mitochondrial function were indicated in type III congenital generalized lipodystrophy (Bosch et al, 2011; Asterholm et al, 2012). Multiple mitochondrial metabolic processes are altered in mice with lipodystrophy caused by Zmpste24 mutation (Peinado et al, 2011). HIV patients treated with anti‐retroviral therapy manifest partial lipodystrophy and impaired mitochondria in adipocytes (Miro et al, 2000). Moreover, mitochondrial dysfunction in adipose tissue triggers lipodystrophy and systemic disorders in mice (Vernochet et al, 2014). Therefore, the contribution of mitochondrial dysfunction to the cause or development of lipodystrophic conditions warrants further examination.
Mitochondrial calcium is key for dSeipin‐mediated lipid storage
We previously reported that dSeipin/SERCA‐mediated ER calcium homeostasis is critical for lipid storage (Bi et al, 2014). Consistent with this, transcripts encoding calcium signaling factors are enriched in the genes that are differentially expressed between dSeipin mutants and wild type. Mitochondrial calcium is transported from the ER through the ER‐resident channel IP3R. The reduction of mitochondrial calcium in dSeipin mutant fat cells (Fig 6A and B) suggests that the decreased ER calcium leads to an insufficient level of mitochondrial calcium. Importantly, RNAi of a putative Drosophila mitochondrial calcium efflux channel (NCLX/CG18660) not only restores the mitochondrial calcium level but also rescues the lipid storage defects in dSeipin mutants, indicating that mitochondrial calcium is key for dSeipin‐mediated lipid storage. This explains our previous finding that the lipid storage defects in dSeipin mutants are rescued by RNAi of RyR, which is not required for ER–mitochondrion calcium transport, but not by RNAi of IP3R (Bi et al, 2014).
Cellular calcium has been linked to lipid storage and related diseases in recent studies (Arruda & Hotamisligil, 2015; Koliaki & Roden, 2016). Comprehensive genetic screening in Drosophila showed that ER calcium‐related proteins are key regulators of lipid storage (Baumbach et al, 2014). In particular, SERCA, as the sole ER calcium influx channel and an interacting partner of Seipin, has been repeatedly implicated in lipid metabolism. Dysfunctional lipid metabolism can disrupt ER calcium homeostasis by inhibiting SERCA and further disturbing systemic glucose homeostasis (Fu et al, 2011). Increased SERCA expression was shown to have dramatic anti‐diabetic benefits in mouse models (Fu et al, 2015). In a genomewide association study, SERCA was been found to be associated with obesity (Locke et al, 2015). In addition, cellular calcium influx is important for transcriptional programming of lipid metabolism, including lipolysis in mice (Maus et al, 2017). Our study here further elucidates that ER calcium and mitochondrial calcium are important for cellular lipid homeostasis. It also provides a new insight into the pathogenic mechanism of congenital lipodystrophy.
The role of Seipin in lipid storage and lipid droplet formation
Since Seipin mutations lead to opposite effects on lipid storage in adipose tissue (lipodystrophy) and non‐adipose tissues (ectopic lipid storage), numerous studies have been carried out to understand the underlying mechanisms. In Seipin mutants, elevated GPAT activity leads to an increased level of PA. This may cause the formation of supersized lipid droplets in non‐adipose cells because of the fusogenic property of PA in lipid leaflets (Fei et al, 2011c; Tian et al, 2011; Wolinski et al, 2015; Qi et al, 2016), and may also lead to adipogenesis defects due to the potential role of PA as an inhibitor of preadipocyte differentiation (Fei et al, 2011a; Pagac et al, 2016). The Seipin‐mediated lipid storage phenotype is further complicated by the role of Seipin in lipid droplet formation, which is mainly studied in unicellular eukaryotic yeast or in cultured cells from multicellular eukaryotic organisms. Seipin has been found in the ER‐LD contact sites, which are considered as essential subcellular foci for LD formation/maturation (Szymanski et al, 2007; Wang et al, 2016). Moreover, in mammalian adipose tissue, the role of Seipin in lipogenesis or lipolysis may also be masked by the defect in early adipogenesis (Yang et al, 2013).
How can previous findings in different model organisms and different cell types be reconciled? Seipin has been characterized as a tissue‐autonomous lipid modulator (Tian et al, 2011; Chen et al, 2012; Jiang et al, 2014). It is likely that Seipin participates in lipid metabolism via distinct mechanisms in different tissues. Alternatively, the metabolic processes that involve Seipin may have different outcomes in different tissues. For example, mitochondria have a different impact on lipid metabolism in different tissues: In non‐fat cells, mitochondria mainly direct energy mobilization, whereas in fat cells, mitochondria mainly lead anabolism. The molecular role of Seipin and the phenotypic outcomes in Seipin mutants may rely on specific cellular and developmental contexts.
Materials and Methods
Fly stocks and husbandry
Unless specified, Drosophila stocks were maintained on standard cornmeal–yeast food at 25°C. w 1118 or ppl‐GAL4 was utilized as the wild‐type control in this study. All the overexpression and RNAi flies were transferred from 25 to 29°C 1 day after egg laying. Drosophila stocks were obtained from Bloomington Stock Center, NIG Stock Center, Vienna Drosophila RNAi Center, and Tsinghua Fly Center except for UAS‐dERR, which was kindly provided by Dr. Jason M. Tennessen.
Staining and microscopy
Lipid droplet staining by BODIPY or Nile red dye was performed as previously described (Bi et al, 2012; Fan et al, 2017). For MitoTracker Red staining, third‐instar larval fat bodies were maintained in Schneider's medium, incubated in MitoTracker Red solution (100 nM, diluted by Schneider's medium) for 30 min and then rinsed three times in 1xPBS. The samples were fixed by 4% PFA for 15 min, washed three times in 1xPBS, stained by DAPI (2 ng/μl) for 5 min, and then washed three more times in 1xPBS. For Rhod‐2 staining, third‐instar larval fat bodies were dissected out and maintained in Schneider's medium, incubated in Rhod‐2, AM solution (5 μM, diluted by Schneider's medium) for 30 min, rinsed with indicator‐free medium, and then incubated for a further 30 min to allow complete de‐esterification of intracellular AM esters. For the detection of Atg8a‐positive mitophagy, larval fat tissues were dissected in PBS and fixed in 4% paraformaldehyde in PBS for 20 min, permeabilized in PBST (0.1% Triton X‐100) for 5 min, blocked with 10% BSA in PBST for 1 h, and incubated with rabbit monoclonal anti‐Atg8 (1:200; Abcam, ab109364) and mouse monoclonal anti‐ATP5A (1:200; Abcam, ab14748) overnight at 4°C. Alexa Fluor 488‐conjugated goat anti‐mouse and Alexa Fluor 555‐conjugated goat anti‐rabbit (1:400; Invitrogen) were used as secondary antibodies. The samples were mounted and immediately imaged with a confocal microscope. Mitochondrial size and fluorescence intensity were quantified by ImageJ software.
High‐pressure freezing (HPF) TEM
The dissected‐out third‐instar larval fat bodies were loaded into carriers and cryofixed on a Leica Microsystems HPM 100 at ~2,100 bar and automatically cooled into liquid nitrogen. After HPF, the samples were transferred under liquid nitrogen to a Leica Microsystems AFS‐2 unit and then incubated at −90°C for 72 h in freeze substitution solution: acetone with 2% (wt/vol) osmium tetroxide and 2% (vol/vol) water. The temperature was increased by 8°C/h for 4 h and was then held at −60°C for 12 h. Next, the temperature was increased again at a rate of 5°C/h for 6 h and held at −30°C for 10 h, and then held at 10°C for 10 h. Samples were then washed four times in acetone, then stained in 1% uranyl acetate for 1 h, and rinsed three times in pure acetone. Samples were infiltrated stepwise with increasing concentrations of Embed 812 (2:1 for 3 h, 1:1 for 5 h) and then incubated twice with 100% fresh resin for 8 h. Samples were placed in fresh resin in an embedding mold and polymerized in a 60°C oven for 3 days. Ultrathin sections (60 nm) were produced with a diamond knife (Diatome) on an ultramicrotome (Ultracut UCT; Leica Microsystems), and slices were collected on slot copper grids (EMS) and then visualized with a JEM‐1400 TEM, operating at 80 kV. Pictures were recorded on a Gatan 832 4 k × 2.7 k CCD camera.
Metabolic profiling and hierarchical clustering analysis
Wandering third‐instar larval fat bodies were collected and frozen. The freeze‐dried samples were crushed using a ball mill for 5 min at 20 Hz before extraction to increase the extraction efficiency. Afterward, 5 mg of each sample was extracted with 1 ml extraction solvent consisting of methanol/water/chloroform (2.5:1:1). 60 μl ribitol (0.2 mg/ml) was added subsequently as an internal standard. The samples were prepared and analyzed on GC/MS platforms.
HCA of the metabolic product levels in the dSeipin and WT groups was performed using Cluster3.0 software (de Hoon et al, 2004). The relative level (x i) of individual components is calculated with the formula: where a i is the measured level of that component. Ten samples in total were measured from wild‐type controls and dSeipin mutants.
HCA was conducted after data loading and adjustment. Metabolites and samples were clustered using the Euclidean distance for the metric calculation. Complete linkage was chosen as the clustering method. The clustering output files were viewed with TreeView.
Stable isotope carbon metabolic tracing
For single time measurement, fat bodies from 15 early third‐instar larvae were dissected in unlabeled culture medium and further incubated for 15 min to prevent effects due to sudden medium change. Subsequently, isolated tissues were rapidly transferred to culture medium containing uniformly labeled U‐13C6‐ glucose and incubated for the indicated time. After culture, the tissues were washed three times by 75 mM ammonium carbonate (pH 7.4) and quenched by snap freezing in liquid nitrogen. Samples were stored in Eppendorf tubes containing 200 μl ddH2O at −80°C until mass spectrometric detection. Metabolites were extracted and analyzed on a primary mass spectrometer platform. The extraction protocol was carried out according to the previous method with minor modification (Lam et al, 2016; Li et al, 2017). Chromatographic separation was performed on reversed‐phase ACQUITY UPLC HSS T3 1.8 μm, 2.1 × 100 mm columns (Waters, Dublin, Ireland) using an ultra‐performance LC system (UltiMate 3000; Thermo Fisher Scientific). MS was performed using an Orbitrap mass spectrometer (Q Exactive, Thermo Fisher Scientific) equipped with an ESI source. Data were acquired in positive and negative ion modes.
Biochemical measurements
TAG measurement was performed as previously described (Liu et al, 2014b). Citrate in wandering third‐instar larval fat bodies was measured using a Citrate Assay Kit (Sigma, MAK057). Briefly, for each repeat, 20 larval fat bodies were dissected out and homogenized in 200 μl citrate assay buffer. Of this homogenate, 50 μl was aspirated out for determination of protein concentration by Bradford assay, and the rest was used in the citrate assay according to the manufacturer's procedure. Intracellular acetyl‐CoA levels were measured by the PicoProbe acetyl‐CoA assay kit (Abcam, ab87546) following the manufacturer's instructions. For each single measurement, 15 larval fat bodies were dissected out and homogenized in 220 μl acetyl‐CoA assay buffer. Of this homogenate, 10 μl was aspirated out for protein determination, and the rest was deproteinized with a 10‐KDa molecular weight cutoff spin filter prior to the reaction according to the manufacturer's procedure. Intracellular ATP levels were measured by the ATP bioluminescence assay kit HS II (Roche Applied Science) following the manufacturer's instructions. Briefly, third‐instar larval fat bodies were dissected out and treated with the same volume of cell lysis reagent (provided in the kit) for 5 min at room temperature. Then, the samples were centrifuged at 10,000 × g for 1 min and the supernatant (50 μl) was transferred to a fresh white 96‐well plate. The reaction was initiated by the addition of 50 μl of the luciferase reagent (from the kit) to the blank, standard, or sample by automated injection. The measurements were performed using a light integration time of 3 s following a delay of 1 s. A Thermo Scientific Fluoroskan AscentTM FL luminometer was utilized in these assays.
The oxygen consumption rate of isolated third‐instar larval fat tissue was measured with a Seahorse XF24 Extracellular Flux Analyzer (Seahorse Bioscience). The instrument was maintained at room temperature. After the OCR measurement, the islet plate was taken out and the protein concentrations of the samples were determined by Bradford assay. The inputs were normalized to 25 μg protein.
Special dietary treatment
Sodium pyruvate (Sigma) or sodium citrate (Sigma) was added to ordinary fly medium at the indicated mass–volume concentration. Adult flies were transferred from normal medium to the special foods. The third‐instar larvae of the next generation were used in subsequent tests.
Statistical analysis
All data are shown as mean ± SEM. Statistical analyses were performed using Prism 5 software (GraphPad software) or SPSS.
Author contributions
Experiments were designed by LD and XH. Bioinformatics analyses were performed by XY. MS of metabolic flux tracing was performed by HT. TEM imaging was performed by JL. GC/MS of metabolomics was performed by FZ. GW, YW, MD, and GS are the project consultants. Samples preparation and most experiments were done by LD. LD and XH wrote the manuscript.
Conflict of interest
The authors declare that they have no conflict of interest.
Supporting information
Appendix
Review Process File
Acknowledgements
We thank Drs. Carl Thummel and Jason M. Tennessen for providing reagents. Research reported here was supported by grants XDB13030300, 2016YFA0500100/2018YFA0506902, and 31630019 from the Chinese Academy of Sciences, the Ministry of Science and Technology of China, and the National Natural Science Foundation of China, respectively.
The EMBO Journal (2018) 37: e97572
References
- Arruda AP, Hotamisligil GS (2015) Calcium homeostasis and organelle function in the pathogenesis of obesity and diabetes. Cell Metab 22: 381–397 [DOI] [PMC free article] [PubMed] [Google Scholar]
- Asterholm IW, Mundy DI, Weng J, Anderson RG, Scherer PE (2012) Altered mitochondrial function and metabolic inflexibility associated with loss of caveolin‐1. Cell Metab 15: 171–185 [DOI] [PMC free article] [PubMed] [Google Scholar]
- Baumbach J, Hummel P, Bickmeyer I, Kowalczyk KM, Frank M, Knorr K, Hildebrandt A, Riedel D, Jackle H, Kuhnlein RP (2014) A Drosophila in vivo screen identifies store‐operated calcium entry as a key regulator of adiposity. Cell Metab 19: 331–343 [DOI] [PubMed] [Google Scholar]
- Bi J, Xiang Y, Chen H, Liu Z, Gronke S, Kuhnlein RP, Huang X (2012) Opposite and redundant roles of the two Drosophila perilipins in lipid mobilization. J Cell Sci 125: 3568–3577 [DOI] [PubMed] [Google Scholar]
- Bi J, Wang W, Liu Z, Huang X, Jiang Q, Liu G, Wang Y, Huang X (2014) Seipin promotes adipose tissue fat storage through the ER Ca2+‐ATPase SERCA. Cell Metab 19: 861–871 [DOI] [PubMed] [Google Scholar]
- Bosch M, Mari M, Herms A, Fernandez A, Fajardo A, Kassan A, Giralt A, Colell A, Balgoma D, Barbero E, Gonzalez‐Moreno E, Matias N, Tebar F, Balsinde J, Camps M, Enrich C, Gross SP, Garcia‐Ruiz C, Perez‐Navarro E, Fernandez‐Checa JC et al (2011) Caveolin‐1 deficiency causes cholesterol‐dependent mitochondrial dysfunction and apoptotic susceptibility. Curr Biol 21: 681–686 [DOI] [PMC free article] [PubMed] [Google Scholar]
- Bricker DK, Taylor EB, Schell JC, Orsak T, Boutron A, Chen YC, Cox JE, Cardon CM, Van Vranken JG, Dephoure N, Redin C, Boudina S, Gygi SP, Brivet M, Thummel CS, Rutter J (2012) A mitochondrial pyruvate carrier required for pyruvate uptake in yeast, Drosophila, and humans. Science 337: 96–100 [DOI] [PMC free article] [PubMed] [Google Scholar]
- de Brito OM, Scorrano L (2008) Mitofusin 2 tethers endoplasmic reticulum to mitochondria. Nature 456: 605–610 [DOI] [PubMed] [Google Scholar]
- Cartwright BR, Goodman JM (2012) Seipin: from human disease to molecular mechanism. J Lipid Res 53: 1042–1055 [DOI] [PMC free article] [PubMed] [Google Scholar]
- Chehab FF (2008) Obesity and lipodystrophy–where do the circles intersect? Endocrinology 149: 925–934 [DOI] [PMC free article] [PubMed] [Google Scholar]
- Chen W, Chang B, Saha P, Hartig SM, Li L, Reddy VT, Yang Y, Yechoor V, Mancini MA, Chan L (2012) Berardinelli‐Seip congenital lipodystrophy 2/seipin is a cell‐autonomous regulator of lipolysis essential for adipocyte differentiation. Mol Cell Biol 32: 1099–1111 [DOI] [PMC free article] [PubMed] [Google Scholar]
- Cooper DE, Grevengoed TJ, Klett EL, Coleman RA (2015) Glycerol‐3‐phosphate acyltransferase isoform‐4 (GPAT4) limits oxidation of exogenous fatty acids in brown adipocytes. J Biol Chem 290: 15112–15120 [DOI] [PMC free article] [PubMed] [Google Scholar]
- Cui X, Wang Y, Tang Y, Liu Y, Zhao L, Deng J, Xu G, Peng X, Ju S, Liu G, Yang H (2011) Seipin ablation in mice results in severe generalized lipodystrophy. Hum Mol Genet 20: 3022–3030 [DOI] [PubMed] [Google Scholar]
- De Stefani D, Rizzuto R, Pozzan T (2016) Enjoy the trip: calcium in mitochondria back and forth. Annu Rev Biochem 85: 161–192 [DOI] [PubMed] [Google Scholar]
- Denton RM, Randle PJ, Martin BR (1972) Stimulation by calcium ions of pyruvate dehydrogenase phosphate phosphatase. Biochem J 128: 161–163 [DOI] [PMC free article] [PubMed] [Google Scholar]
- Denton RM, Richards DA, Chin JG (1978) Calcium ions and the regulation of NAD+‐linked isocitrate dehydrogenase from the mitochondria of rat heart and other tissues. Biochem J 176: 899–906 [DOI] [PMC free article] [PubMed] [Google Scholar]
- Fan W, Lam SM, Xin J, Yang X, Liu Z, Liu Y, Wang Y, Shui G, Huang X (2017) Drosophila TRF2 and TAF9 regulate lipid droplet size and phospholipid fatty acid composition. PLoS Genet 13: e1006664 [DOI] [PMC free article] [PubMed] [Google Scholar]
- Fei W, Shui G, Gaeta B, Du X, Kuerschner L, Li P, Brown AJ, Wenk MR, Parton RG, Yang H (2008) Fld1p, a functional homologue of human seipin, regulates the size of lipid droplets in yeast. J Cell Biol 180: 473–482 [DOI] [PMC free article] [PubMed] [Google Scholar]
- Fei W, Du X, Yang H (2011a) Seipin, adipogenesis and lipid droplets. Trends Endocrinol Metab 22: 204–210 [DOI] [PubMed] [Google Scholar]
- Fei W, Li H, Shui G, Kapterian TS, Bielby C, Du X, Brown AJ, Li P, Wenk MR, Liu P, Yang H (2011b) Molecular characterization of seipin and its mutants: implications for seipin in triacylglycerol synthesis. J Lipid Res 52: 2136–2147 [DOI] [PMC free article] [PubMed] [Google Scholar]
- Fei W, Shui G, Zhang Y, Krahmer N, Ferguson C, Kapterian TS, Lin RC, Dawes IW, Brown AJ, Li P, Huang X, Parton RG, Wenk MR, Walther TC, Yang H (2011c) A role for phosphatidic acid in the formation of “supersized” lipid droplets. PLoS Genet 7: e1002201 [DOI] [PMC free article] [PubMed] [Google Scholar]
- Ferramosca A, Savy V, Conte L, Colombo S, Einerhand AW, Zara V (2006) Conjugated linoleic acid and hepatic lipogenesis in mouse: role of the mitochondrial citrate carrier. J Lipid Res 47: 1994–2003 [DOI] [PubMed] [Google Scholar]
- Fieni F, Lee SB, Jan YN, Kirichok Y (2012) Activity of the mitochondrial calcium uniporter varies greatly between tissues. Nat Commun 3: 1317 [DOI] [PMC free article] [PubMed] [Google Scholar]
- Fu S, Yang L, Li P, Hofmann O, Dicker L, Hide W, Lin X, Watkins SM, Ivanov AR, Hotamisligil GS (2011) Aberrant lipid metabolism disrupts calcium homeostasis causing liver endoplasmic reticulum stress in obesity. Nature 473: 528–531 [DOI] [PMC free article] [PubMed] [Google Scholar]
- Fu S, Yalcin A, Lee GY, Li P, Fan J, Arruda AP, Pers BM, Yilmaz M, Eguchi K, Hotamisligil GS (2015) Phenotypic assays identify azoramide as a small‐molecule modulator of the unfolded protein response with antidiabetic activity. Sci Transl Med 7: 292ra98 [DOI] [PMC free article] [PubMed] [Google Scholar]
- Griffiths EJ, Rutter GA (2009) Mitochondrial calcium as a key regulator of mitochondrial ATP production in mammalian cells. Biochim Biophys Acta 1787: 1324–1333 [DOI] [PubMed] [Google Scholar]
- Gruning NM, Rinnerthaler M, Bluemlein K, Mulleder M, Wamelink MM, Lehrach H, Jakobs C, Breitenbach M, Ralser M (2011) Pyruvate kinase triggers a metabolic feedback loop that controls redox metabolism in respiring cells. Cell Metab 14: 415–427 [DOI] [PMC free article] [PubMed] [Google Scholar]
- Harris CA, Haas JT, Streeper RS, Stone SJ, Kumari M, Yang K, Han X, Brownell N, Gross RW, Zechner R, Farese RV Jr (2011) DGAT enzymes are required for triacylglycerol synthesis and lipid droplets in adipocytes. J Lipid Res 52: 657–667 [DOI] [PMC free article] [PubMed] [Google Scholar]
- Hayashi T, Su TP (2007) Sigma‐1 receptor chaperones at the ER‐mitochondrion interface regulate Ca2+ signaling and cell survival. Cell 131: 596–610 [DOI] [PubMed] [Google Scholar]
- de Hoon MJ, Imoto S, Nolan J, Miyano S (2004) Open source clustering software. Bioinformatics 20: 1453–1454 [DOI] [PubMed] [Google Scholar]
- Jiang M, Gao M, Wu C, He H, Guo X, Zhou Z, Yang H, Xiao X, Liu G, Sha J (2014) Lack of testicular seipin causes teratozoospermia syndrome in men. Proc Natl Acad Sci USA 111: 7054–7059 [DOI] [PMC free article] [PubMed] [Google Scholar]
- Koliaki C, Roden M (2016) Alterations of mitochondrial function and insulin sensitivity in human obesity and diabetes mellitus. Annu Rev Nutr 36: 337–367 [DOI] [PubMed] [Google Scholar]
- Kurokawa J, Arai S, Nakashima K, Nagano H, Nishijima A, Miyata K, Ose R, Mori M, Kubota N, Kadowaki T, Oike Y, Koga H, Febbraio M, Iwanaga T, Miyazaki T (2010) Macrophage‐derived AIM is endocytosed into adipocytes and decreases lipid droplets via inhibition of fatty acid synthase activity. Cell Metab 11: 479–492 [DOI] [PubMed] [Google Scholar]
- Lam SM, Chua GH, Li XJ, Su B, Shui G (2016) Biological relevance of fatty acyl heterogeneity to the neural membrane dynamics of rhesus macaques during normative aging. Oncotarget 7: 55970–55989 [DOI] [PMC free article] [PubMed] [Google Scholar]
- Lee S, Lee KS, Huh S, Liu S, Lee DY, Hong SH, Yu K, Lu B (2016) Polo kinase phosphorylates Miro to control ER‐mitochondria contact sites and mitochondrial Ca2+ homeostasis in neural stem cell development. Dev Cell 37: 174–189 [DOI] [PMC free article] [PubMed] [Google Scholar]
- Li X, Chung ACK, Li S, Wu L, Xu J, Yu J, Wong C, Cai Z (2017) LC‐MS‐based metabolomics revealed SLC25A22 as an essential regulator of aspartate‐derived amino acids and polyamines in KRAS‐mutant colorectal cancer. Oncotarget 8: 101333–101344 [DOI] [PMC free article] [PubMed] [Google Scholar]
- Liu L, Jiang Q, Wang X, Zhang Y, Lin RC, Lam SM, Shui G, Zhou L, Li P, Wang Y, Cui X, Gao M, Zhang L, Lv Y, Xu G, Liu G, Zhao D, Yang H (2014a) Adipose‐specific knockout of Seipin/Bscl2 results in progressive lipodystrophy. Diabetes 63: 2320–2331 [DOI] [PubMed] [Google Scholar]
- Liu Y, Wang W, Shui G, Huang X (2014b) CDP‐diacylglycerol synthetase coordinates cell growth and fat storage through phosphatidylinositol metabolism and the insulin pathway. PLoS Genet 10: e1004172 [DOI] [PMC free article] [PubMed] [Google Scholar]
- Locke AE, Kahali B, Berndt SI, Justice AE, Pers TH, Felix R, Powell C, Vedantam S, Buchkovich ML, Yang J, Croteau‐Chonka DC, Esko T, Fall T, Ferreira T, Gustafsson S, Kutalik Z, Luan JA, Magi R, Randall JC, Winkler TW et al (2015) Genetic studies of body mass index yield new insights for obesity biology. Nature 518: 197–206 [DOI] [PMC free article] [PubMed] [Google Scholar]
- Magre J, Delepine M, Khallouf E, Gedde‐Dahl T Jr, Van Maldergem L, Sobel E, Papp J, Meier M, Megarbane A, Bachy A, Verloes A, d'Abronzo FH, Seemanova E, Assan R, Baudic N, Bourut C, Czernichow P, Huet F, Grigorescu F, de Kerdanet M et al (2001) Identification of the gene altered in Berardinelli‐Seip congenital lipodystrophy on chromosome 11q13. Nat Genet 28: 365–370 [DOI] [PubMed] [Google Scholar]
- Maus M, Cuk M, Patel B, Lian J, Ouimet M, Kaufmann U, Yang J, Horvath R, Hornig‐Do HT, Chrzanowska‐Lightowlers ZM, Moore KJ, Cuervo AM, Feske S (2017) Store‐operated Ca2+ entry controls induction of lipolysis and the transcriptional reprogramming to lipid metabolism. Cell Metab 25: 698–712 [DOI] [PMC free article] [PubMed] [Google Scholar]
- McCormack JG, Denton RM (1979) The effects of calcium ions and adenine nucleotides on the activity of pig heart 2‐oxoglutarate dehydrogenase complex. Biochem J 180: 533–544 [DOI] [PMC free article] [PubMed] [Google Scholar]
- Michel AH, Kornmann B (2012) The ERMES complex and ER‐mitochondria connections. Biochem Soc Trans 40: 445–450 [DOI] [PubMed] [Google Scholar]
- Miro O, Gomez M, Pedrol E, Cardellach F, Nunes V, Casademont J (2000) Respiratory chain dysfunction associated with multiple mitochondrial DNA deletions in antiretroviral therapy‐related lipodystrophy. AIDS 14: 1855–1857 [DOI] [PubMed] [Google Scholar]
- Ohba Y, Sakuragi T, Kage‐Nakadai E, Tomioka NH, Kono N, Imae R, Inoue A, Aoki J, Ishihara N, Inoue T, Mitani S, Arai H (2013) Mitochondria‐type GPAT is required for mitochondrial fusion. EMBO J 32: 1265–1279 [DOI] [PMC free article] [PubMed] [Google Scholar]
- Pagac M, Cooper DE, Qi Y, Lukmantara IE, Mak HY, Wu Z, Tian Y, Liu Z, Lei M, Du X, Ferguson C, Kotevski D, Sadowski P, Chen W, Boroda S, Harris TE, Liu G, Parton RG, Huang X, Coleman RA et al (2016) SEIPIN regulates lipid droplet expansion and adipocyte development by modulating the activity of glycerol‐3‐phosphate acyltransferase. Cell Rep 17: 1546–1559 [DOI] [PMC free article] [PubMed] [Google Scholar]
- Palty R, Silverman WF, Hershfinkel M, Caporale T, Sensi SL, Parnis J, Nolte C, Fishman D, Shoshan‐Barmatz V, Herrmann S, Khananshvili D, Sekler I (2010) NCLX is an essential component of mitochondrial Na+/Ca2+ exchange. Proc Natl Acad Sci USA 107: 436–441 [DOI] [PMC free article] [PubMed] [Google Scholar]
- Peinado JR, Quiros PM, Pulido MR, Marino G, Martinez‐Chantar ML, Vazquez‐Martinez R, Freije JM, Lopez‐Otin C, Malagon MM (2011) Proteomic profiling of adipose tissue from Zmpste24‐/‐ mice, a model of lipodystrophy and premature aging, reveals major changes in mitochondrial function and vimentin processing. Mol Cell Proteomics 10: M111 008094 [DOI] [PMC free article] [PubMed] [Google Scholar]
- Potting C, Tatsuta T, Konig T, Haag M, Wai T, Aaltonen MJ, Langer T (2013) TRIAP1/PRELI complexes prevent apoptosis by mediating intramitochondrial transport of phosphatidic acid. Cell Metab 18: 287–295 [DOI] [PubMed] [Google Scholar]
- Qi Y, Kapterian TS, Du X, Ma Q, Fei W, Zhang Y, Huang X, Dawes IW, Yang H (2016) CDP‐diacylglycerol synthases regulate the growth of lipid droplets and adipocyte development. J Lipid Res 57: 767–780 [DOI] [PMC free article] [PubMed] [Google Scholar]
- Rizzuto R, De Stefani D, Raffaello A, Mammucari C (2012) Mitochondria as sensors and regulators of calcium signalling. Nat Rev Mol Cell Biol 13: 566–578 [DOI] [PubMed] [Google Scholar]
- Severson DL, Denton RM, Pask HT, Randle PJ (1974) Calcium and magnesium ions as effectors of adipose‐tissue pyruvate dehydrogenase phosphate phosphatase. Biochem J 140: 225–237 [DOI] [PMC free article] [PubMed] [Google Scholar]
- Sim MF, Dennis RJ, Aubry EM, Ramanathan N, Sembongi H, Saudek V, Ito D, O'Rahilly S, Siniossoglou S, Rochford JJ (2012) The human lipodystrophy protein seipin is an ER membrane adaptor for the adipogenic PA phosphatase lipin 1. Mol Metab 2: 38–46 [DOI] [PMC free article] [PubMed] [Google Scholar]
- Subramanian A, Tamayo P, Mootha VK, Mukherjee S, Ebert BL, Gillette MA, Paulovich A, Pomeroy SL, Golub TR, Lander ES, Mesirov JP (2005) Gene set enrichment analysis: a knowledge‐based approach for interpreting genome‐wide expression profiles. Proc Natl Acad Sci USA 102: 15545–15550 [DOI] [PMC free article] [PubMed] [Google Scholar]
- Szymanski KM, Binns D, Bartz R, Grishin NV, Li WP, Agarwal AK, Garg A, Anderson RG, Goodman JM (2007) The lipodystrophy protein seipin is found at endoplasmic reticulum lipid droplet junctions and is important for droplet morphology. Proc Natl Acad Sci USA 104: 20890–20895 [DOI] [PMC free article] [PubMed] [Google Scholar]
- Talukder MM, Sim MF, O'Rahilly S, Edwardson JM, Rochford JJ (2015) Seipin oligomers can interact directly with AGPAT2 and lipin 1, physically scaffolding critical regulators of adipogenesis. Mol Metab 4: 199–209 [DOI] [PMC free article] [PubMed] [Google Scholar]
- Tennessen JM, Baker KD, Lam G, Evans J, Thummel CS (2011) The Drosophila estrogen‐related receptor directs a metabolic switch that supports developmental growth. Cell Metab 13: 139–148 [DOI] [PMC free article] [PubMed] [Google Scholar]
- Tian Y, Bi J, Shui G, Liu Z, Xiang Y, Liu Y, Wenk MR, Yang H, Huang X (2011) Tissue‐autonomous function of Drosophila seipin in preventing ectopic lipid droplet formation. PLoS Genet 7: e1001364 [DOI] [PMC free article] [PubMed] [Google Scholar]
- Vernochet C, Damilano F, Mourier A, Bezy O, Mori MA, Smyth G, Rosenzweig A, Larsson NG, Kahn CR (2014) Adipose tissue mitochondrial dysfunction triggers a lipodystrophic syndrome with insulin resistance, hepatosteatosis, and cardiovascular complications. FASEB J 28: 4408–4419 [DOI] [PMC free article] [PubMed] [Google Scholar]
- Wang H, Becuwe M, Housden BE, Chitraju C, Porras AJ, Graham MM, Liu XN, Thiam AR, Savage DB, Agarwal AK, Garg A, Olarte MJ, Lin Q, Frohlich F, Hannibal‐Bach HK, Upadhyayula S, Perrimon N, Kirchhausen T, Ejsing CS, Walther TC et al (2016) Seipin is required for converting nascent to mature lipid droplets. Elife 5: e16582 [DOI] [PMC free article] [PubMed] [Google Scholar]
- Whitehouse S, Cooper RH, Randle PJ (1974) Mechanism of activation of pyruvate dehydrogenase by dichloroacetate and other halogenated carboxylic acids. Biochem J 141: 761–774 [DOI] [PMC free article] [PubMed] [Google Scholar]
- Wolinski H, Hofbauer HF, Hellauer K, Cristobal‐Sarramian A, Kolb D, Radulovic M, Knittelfelder OL, Rechberger GN, Kohlwein SD (2015) Seipin is involved in the regulation of phosphatidic acid metabolism at a subdomain of the nuclear envelope in yeast. Biochim Biophys Acta 1851: 1450–1464 [DOI] [PubMed] [Google Scholar]
- Yang W, Thein S, Guo X, Xu F, Venkatesh B, Sugii S, Radda GK, Han W (2013) Seipin differentially regulates lipogenesis and adipogenesis through a conserved core sequence and an evolutionarily acquired C‐terminus. Biochem J 452: 37–44 [DOI] [PubMed] [Google Scholar]
- Yang W, Thein S, Wang X, Bi X, Ericksen RE, Xu F, Han W (2014) BSCL2/seipin regulates adipogenesis through actin cytoskeleton remodelling. Hum Mol Genet 23: 502–513 [DOI] [PubMed] [Google Scholar]
- Zhou H, Lei X, Benson T, Mintz J, Xu X, Harris RB, Weintraub NL, Wang X, Chen W (2015) Berardinelli‐Seip congenital lipodystrophy 2 regulates adipocyte lipolysis, browning, and energy balance in adult animals. J Lipid Res 56: 1912–1925 [DOI] [PMC free article] [PubMed] [Google Scholar]
- Zhou H, Black SM, Benson TW, Weintraub NL, Chen W (2016) Berardinelli‐Seip congenital lipodystrophy 2/Seipin is not required for brown adipogenesis but regulates brown adipose tissue development and function. Mol Cell Biol 36: 2027–2038 [DOI] [PMC free article] [PubMed] [Google Scholar]
Associated Data
This section collects any data citations, data availability statements, or supplementary materials included in this article.
Supplementary Materials
Appendix
Review Process File