Abstract
The goal of this study was to assess the ability of quantitative T1 cardiovascular magnetic resonance (CMR) imaging to calculate liver extracellular volume (ECV) in patients with varying degrees of congestive hepatopathy (CH). T1 measurements and ECV calculations were performed retrospectively in three cohorts of patients: normal cardiac function, tetralogy of Fallot (TOF) repair and Fontan palliation. All CMR studies included modified look-locker inversion recovery (MOLLI) T1 mapping scans performed pre and post injection of a gadolinium based contrast agent (GBCA). Pixel intensity data was manually collected from images of the liver and cardiac blood pool to determine contrast-induced changes in T1 for liver and blood. This data was then used to compute liver ECV. 172 subjects were included in the study. Of these, 140 subjects were normal cardiac function patients, 16 were TOF repair patients and 16 patients were with Fontan palliation. A statistically significant difference in both the liver native T1 and ECV measurements was found between patients with normal cardiac function vs. Fontan palliation patients (p<0.01). Our data indicates that measuring T1 maps both pre and post GBCA injection within CMR scan session can be used to follow progression of liver fibrosis. This technique has the potential to improve diagnosis and treatment of patients with chronic liver disease and liver fibrosis.
Keywords: Liver fibrosis, congestive hepatopathy, tetralogy of Fallot, Fontan, magnetic resonance imaging, T1 maps
Background
Surgical repairs of congenital heart disease, such as the tetralogy of Fallot (TOF) repair and Fontan palliation, allow many patients with congenital heart disease to survive into adulthood. The Fontan operation is a single ventricle repair that reroutes blood from the inferior vena cava and superior vena cava directly to the pulmonary arteries without passing through the right ventricle. This procedure can result in passive hepatic venous congestion (PHVC) in the liver. The TOF surgical repair provides relatively normal cardiac blood flow through the heart, but overtime, the right ventricle may become volume or pressure overloaded due to pulmonary artery regurgitation or stenosis and often requires additional surgical repair of the right ventricular outflow in adulthood [1]. Both surgical procedures can result in chronic PHVC.
Any congestive cardiac failure or right ventricular infarction can cause PHVC [2]. When PHVC persists over an extended period of time, it can result in congestive hepatopathy (CH) [2, 3]. The hepatic fibrosis that occurs in CH is related to the severity of PHVC and duration of the cardiac anomaly causing said PHVC [3]. The degree of PHVC is much greater in Fontan palliation patients than in TOF repair patients, due to the drastic change in venous blood flow. Thus, patients with the TOF repair have minimal risk of developing CH, while the risk for CH is much more significant in patients with the Fontan palliation.
Chronic liver injury and hepatic congestion ultimately lead to excess extracellular volume (ECV) in the liver due to scaring and interstitial fibrosis [4]. In chronic liver disease, hepatic fibrosis disrupts liver structure and function and can progress to cirrhosis [5]. Currently, liver biopsy serves as the gold standard for detecting liver fibrosis; however, this method comes with significant drawbacks, including risk of complication, need for sedation, sampling error and high cost [4, 6, 7]. Determining the magnitude of liver fibrosis is critical to stage disease, establish prognosis and monitor progression. Early intervention in patients with mild liver fibrosis has been found to halt fibrosis progression [5, 8]. Therefore, it is essential to develop an accurate, reproducible tool to detect early stages and progression of hepatic fibrosis.
Cardiovascular magnetic resonance (CMR) is routinely performed in Fontan and TOF patients as surveillance of cardiac function and flow. T1 proton relaxation time is a useful feature of CMR used to characterize myocardial and liver tissue [9, 10]. Values for T1 are based on the chemical and physical environment of water protons within each tissue, so every tissue has a unique identifiable value [11]. Edema and inflammatory changes due to congestion can contribute to this unique proton environment within the liver [12].
Due to its proximity to the heart, a large portion of the liver is imaged during the T1 mapping sequence of CMR imaging. The purpose of this exploratory study was to retrospectively evaluate hepatic ECV measurement through CMR using T1 maps with and without a GBCA in a cohort of patients with cardiac function that varies from normal to compromised.
Methods
A retrospective analysis of CMR images from patients with normal cardiac function, TOF repair and Fontan palliation was performed. The picture archiving computer system (PACS) (Merge; Chicago, IL, USA) was searched for all patients who had a dedicated CMR examination. Only CMR examinations which included modified look-locker inversion recovery (MOLLI) sequences of T1 maps performed with and without contrast were selected. As part of a standard clinical CMR protocol, a cardiac gated MOLLI based T1 mapping was performed in these patients pre and approximately 10 minutes post contrast to quantitatively assess cardiomyopathy. FDA approved vendor provided MOLLI sequence parameters were used [10]. 3 slices along short-axis view were acquired. Left lobe of the liver was mostly included in the field of view of acquisition. The gadolinium based contrast agent (GBCA) used in the study was gadoterate meglumine (DOTAREM, Guerbet LLC, Bloomington, IN, USA). Normal cardiac function patients that met the imaging criteria were selected from August 1st, 2016 to May 31, 2017. Normal cardiac function was defined by reports that were read as ‘normal’ based on values that fell in the ‘normal’ range by CMR analysis [13]. Liver function tests (LFT) were available in a minority of patients with cardiomyopathy leading to the assumption that there was no significant liver disease present in this group. TOF repair and Fontan palliation patients that met the imaging criteria were selected from January 1st, 2014 to May 31st, 2017, due to the small sample size. LFT’s were not available for patients with TOF repair. For 14 patients with Fontan palliation, Gamma-glutamyltransferase (GGT) were elevated above normal levels and biliruben was below normal level. Alanine transaminase (ALT) and Aspartate transaminase (AST) were within normal range. LFT’s were not available for 2 patients with Fontan palliation. Hematocrit (HCT) values were used in equations to estimate liver ECV. Due to small sample size, TOF and Fontan patients were included in the study if they were missing HCT values. Seven patients were missing HCT values: 6 with TOF, 1 with Fontan palliation. For this subset, the HCT value was estimated to be 45% (Normal range: 40 – 50%) [14]. Exclusion criteria for TOF and Fontan subjects included missing the T1 mapping sequence. Exclusion criteria for normal cardiac function subjects included missing a HCT value, having elevated cardiac enzymes, Fabry disease and duration between the HCT value and CMR scan exceeding two days.
All CMR images were acquired on a 1.5T Phillips Ingenia scanner (Philips Healthcare, Best, The Netherlands) equipped with a gradient system with a maximum amplitude of 45 mT/m and a 200 mT/m/msec slew rate. Imaging was performed with an anterior-posterior Torso coil combination. 3 ROIs on 3 individual slices were traced in the liver and 1 ROI was drawn in the cardiac blood pool (Figure 1). Liver ROI’s were carefully drawn to exclude any blood vessels and included as much of the liver parenchyma as possible while staying ~2 mm inside the boundary and avoiding any major signal heterogeneity. The blood pool ROI was carefully drawn to exclude any myocardium. Care was taken to copy the ROI’s as closely as possible on both the pre and post contrast scans. The values from the 3 ROIs drawn on the liver were averaged for both the pre and post contrast data. Liver ECV values were calculated based on the following equations using the means for both pre and post contrast values [11]:
where ECV and HCT values are given as percentages.
Figure 1.
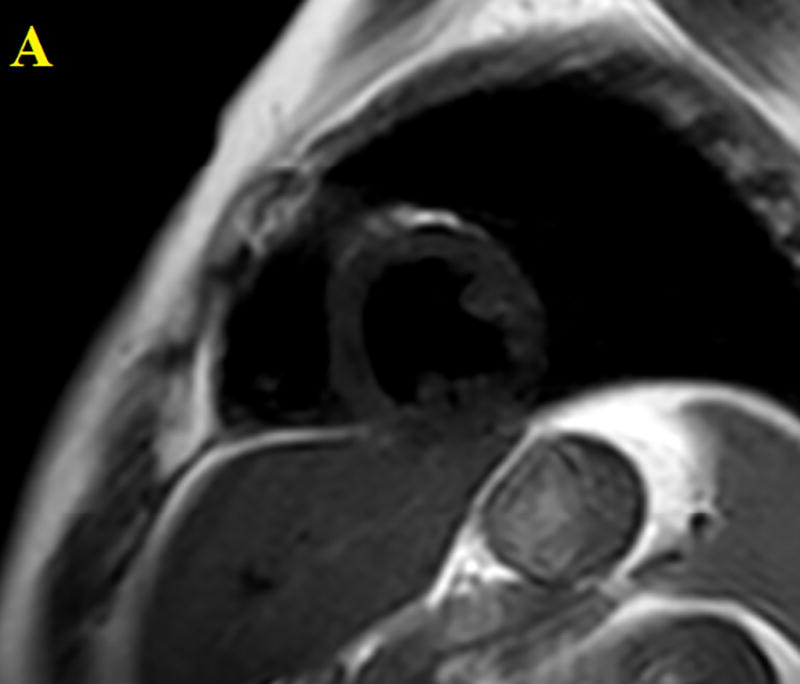
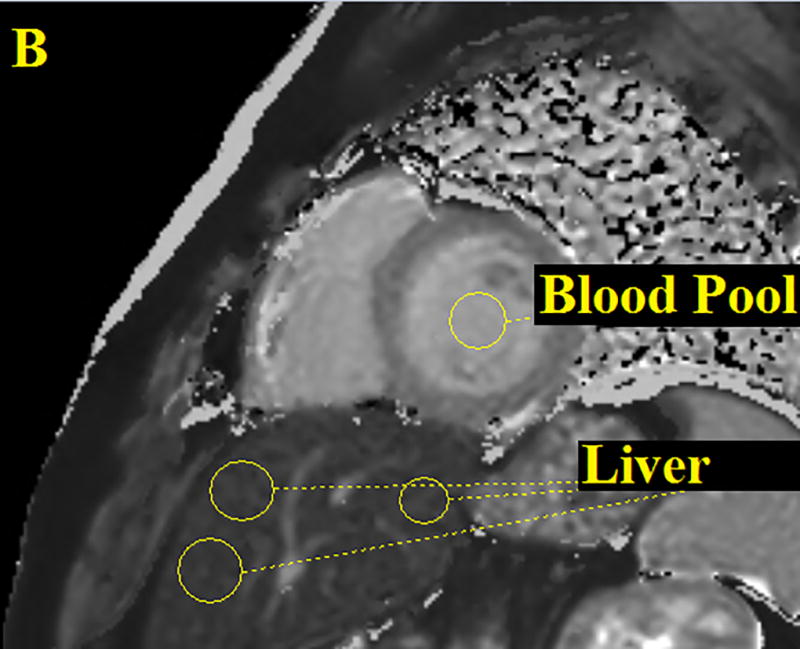
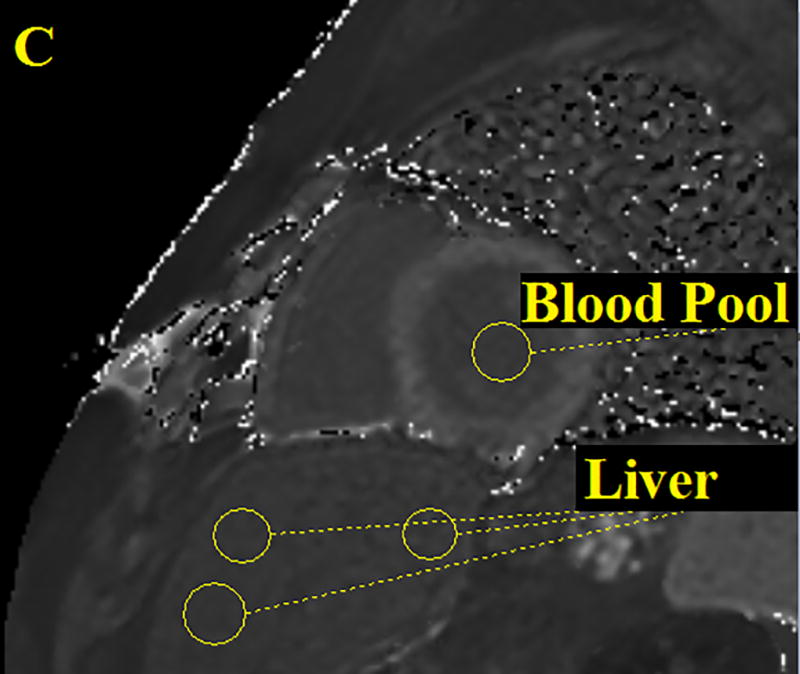
Three ROI’s were drawn on the patient’s liver then averaged and one ROI was drawn on the cardiac blood pool. Performed for all CMR images both pre and post contrast. The figure above shows an anatomical image, proton density weighted dark blood double inversion recovery turbo spin echo (A), a pre contrast T1 map (B) and a post contrast T1 map (C).
For all included patients complete sets of data (ΔR1liver, ΔR1blood, ECVliver) were recorded. All normal cardiac function patients (140 subjects) were screened and did not have any cardiac dysfunction that would cause hepatic abnormality. Statistical analyses of mean T1 native liver and liver ECV values for the normal cardiac function patients, TOF patients and Fontan palliation patients were performed. Continuous variables were summarized with mean and standard deviation (SD) and were compared between categories (Normal cardiac function, TOF, Fontan) using one way ANOVA. The categories for normal cardiac function and TOF repair were grouped together and compared to the Fontan group. Receiver operating characteristic (ROC) curves were generated to illustrate the diagnostic ability using mean T1 native liver value and liver ECV. The area under the curve (AUC), sensitivity and specificity at the optimal threshold were reported. Logistic regression models were conducted to evaluate the correlation between categories and native liver T1 and ECV adjusting for T1 post liver, delta R1 liver and as the covariates. Model selection was based on a stepwise-criterion. All analyses were performed using SAS version 9.3.
This study was approved by the Institutional Review Board and all study procedures were performed in a HIPPA compliant manner.
Results
337 patients met the exam date inclusion criteria. Of these, 30 were missing the T1 mapping sequence, 1 had elevated cardiac enzymes, 5 had Fabry disease, 60 were missing HCT values and 69 had more than a two day difference between their CMR scan date and HCT date and were subsequently excluded. After exclusion, 172 patients were included in the study. Of these, 140 patients were considered normal cardiac function patients, 16 were TOF repair and 16 were Fontan palliation. Demographics and clinical data are shown in Table 1. Summary of age, mean T1 native and mean liver ECV data are shown in Table 2 with standard deviations. Breakdown of specific disorders found within the included cohort can be found in Table 3 and it should be noted that the hypertrophic cardiomyopathy were genetic carriers but had not manifested the phenotype at the time of imaging.
Table 1.
Summary of Demographic and Clinical Data
| Number of Subjects | Male | 155 | |
| Female | 17 | ||
| Cardiac Function Evaluation or Prior Surgical Repair | Normal Cardiac Function | 140 | |
| TOF | 16 | ||
| Fontan | 16 | ||
| Age (y) | Age Range | Number of Patients | Mean Age |
| 0.0 to 9.9 | 10 | 8.7 | |
| 10.0 to 19.9 | 114 | 14.2 | |
| 20.0 to 29.9 | 34 | 23.6 | |
| >30.0 | 14 | 39.7 | |
Table 2.
Summary of Age, Mean Native T1 and Mean ECV Values of Included Cohort
| Condition | N | Mean Age (y) | Mean Native T1 (SD) | Mean ECV (SD) |
|---|---|---|---|---|
| Normal Cardiac Function | 140 | 15.5 | 587 (64) | 29.3 (5.5) |
| TOF | 16 | 32.2 | 610 (151) | 30.7 (10.8) |
| Fontan | 16 | 23.9 | 706 (130) | 40.5 (9.3) |
Table 3.
Summary of Subject Diagnoses
| Disorder | Number of Subjects |
|---|---|
| Normal Cardiac Function | 140 |
| Duchenne Muscular Dystrophy | 111 |
| Hypertrophic Cardiomyopathy* | 8 |
| DMD Carrier | 9 |
| Becker’s Muscular Dystrophy | 7 |
| Other | 5 |
| Tetralogy of Fallot | 16 |
| Fontan Palliation | 16 |
Phenotype negative, genotype positive hypertrophic cardiomyopathy.
For the generation of the ROC curves, the data was grouped according to assessed cardiac condition or surgical procedure performed. The Fontan group was analyzed against the combined normal cardiac function and TOF groups. ROC curves were developed for each covariate, including mean T1 native liver, mean T1 post liver and liver ECV. After analysis of each ROC curve, the mean T1 native liver and liver ECV curves had the highest sensitivity, specificity and AUC compared to the other covariate ROC curve. The other covariate curve, mean T 1 post liver, produced an AUC of 0.653, a sensitivity of 0.56 and a specificity of 0.68. The mean T1 native liver ROC curve produced an AUC of 0.786, a sensitivity of 0.75 and a specificity of 0.88 (Figure 2). The cutoff value for the mean T1 native liver ROC = 996. The liver ECV ROC curve produced an AUC of 0.869, a sensitivity of 0.81 and a specificity of 0.83 (Figure 2). The liver ECV ROC produced a cutoff value of 55.
Figure 2.
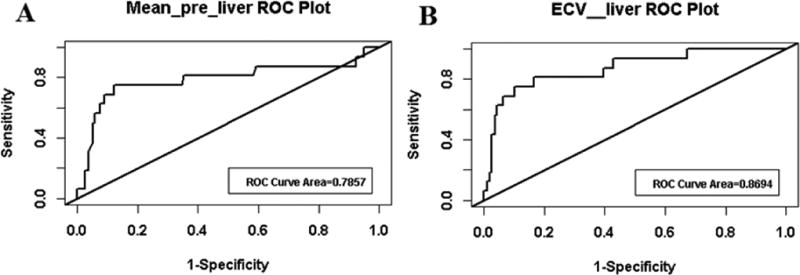
ROC curves generated for mean T1 native liver (A) and liver ECV (B). Graphs created by grouping the Fontan category against the normal cardiac function and TOF category.
Statistically significant results were identified within the mean T1 native data, between the normal cardiac function vs. the Fontan groups (p<0.01) (Figure 3). Statistically significant results were also found within the liver ECV data, between the normal cardiac function vs. Fontan and the TOF vs. Fontan groups (Figure 4).
Figure 3.
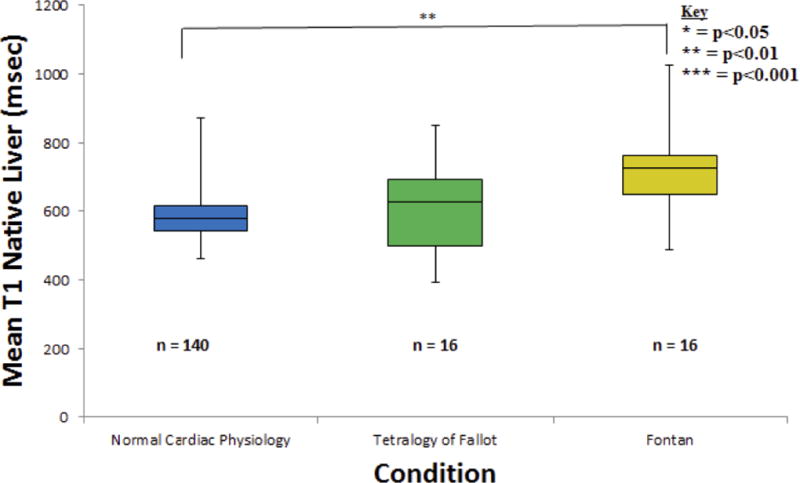
Three T1 native liver measurements were averaged and recorded for all 172 subjects. Data was found to be significantly different (p = 0.0024) between the normal cardiac function and Fontan categories. A significant statistical difference could not be found between the TOF and Fontan groups (p = 0.0622), possibly due to the small sample size.
Figure 4.
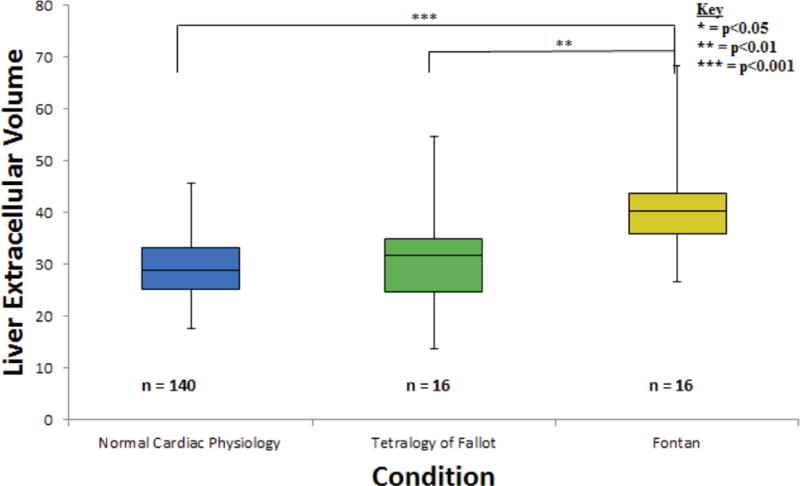
One liver ECV calculation was performed for each of the 172 total subjects. Data was found to be significantly different (p = 0.0002) between the normal cardiac function and Fontan groups. Additionally, data was found to be significantly different (p = 0.0098) between the TOF and Fontan categories.
Discussion
Prior studies have examined the measurement of liver fibrosis through MR techniques [15]. Chow et al., found that quantitative MR could detect longitudinal changes in mouse liver fibrosis models [12]. Studies have found success in staging cirrhosis using MR techniques, but the optimal process to stage early fibrosis is still being developed [15–17]. Cardiac gated native T1 mapping using MOLLI is shown to be the superior diagnostic tool for detecting early stage liver cirrhosis and has been shown to be more accurate than T2 mapping and diffusion weighted MR imaging of the liver [15, 18, 19]. Our study adds to this knowledge by looking at readily available pre and post-contrast data that were acquired as part of routine CMR study. In our study, using native T1 values, we found statistically significant differences in T1 value between patients with normal cardiac physiology and patients with Fontan palliation (p<0.01); and using ECV, which includes data from pre and post contrast images, statistically significant values were observed between the normal cardiac function vs. Fontan and the TOF vs. Fontan groups showing that using pre and post contrast data adds more value as compared to single native T1 measurement. T1 measurements correlate with the presence of elevated extra-cellular water and increase in T1 value reflects elevated extra-cellular water. Although cardiac gating is unessential for T1 mapping of the liver, in its current version, the FDA approved vendor provided implementation of MOLLI is designed for cardiac applications. Our ‘normal’ liver T1 values agree with previously published T1 values using the same technique [15, 19].
The small increase in the native T1 and ECV of TOF patients did not show a significant difference when compared to the normal cardiac function group. The TOF group was included to see if we could identify an intermediate group that may have mild CH and to help inform sample size calculations needed for future studies. Based on our data, to detect a difference in ECV between TOF and normal controls when the mean ECV was 29 for normal controls and 31 for TOF, with a SD of 7, we would need 194 subjects per CH group. However, if we assume the mean ECVs are 27 for normal controls and 32 for TOF, with a SD of 7, only 32 subjects per group would be needed. Future prospective studies would improve our understanding of the role of MR technology in assessing liver fibrosis related to CH.
Future progress in expanding this subject area is critical to developing T1 mapping to stage liver fibrosis and CH. While MR elastography derived liver stiffness value has been widely used as a non-invasive biomarker of liver fibrosis, it needs additional hardware and software that may or may not be available during CMR studies [20–22]. In our study, MOLLI based T1 mapping was acquired for the myocardium as part of standard clinical care. It may be possible to evaluate and follow native T1 of the liver without contrast to evaluate fibrosis in the liver over the course of the disease, but we suspect that measuring ECV will be a more powerful method. Furthermore, future studies should widen the scope of methods used to detect liver fibrosis in patients. Alternate methods, that may enhance the value of T1 mapping and measurement of ECV when used in multi-parametric combinations, include T2 mapping, diffusion weighted imaging, MR perfusion, MR elastography and serologic markers of fibrosis [18, 21, 22].
Conclusions
T1 native liver values and ECV values calculated after GBCA administration show promise in identifying fibrotic changes in the liver during routine CMR imaging of patients with congenital heart disease. This process has the potential to be an accurate, safe and cost effective alternative to liver biopsy. This same imaging technique could be utilized in patients with other liver diseases to monitor fibrosis.
Limitations
While the data shows encouraging results from this study, there were limitations. Liver biopsy staging of fibrosis was not available in this cohort. At this time, liver biopsy is needed to stage liver fibrosis. This study had a disproportionate ratio of males to females; 155:17. However, we expect to see similar results in both males and females. Additionally, we tacitly assume reproducibility of T1 measurements within a patient. Furthermore, the estimation of 38% of the TOF population’s HCT value, estimated to be 45%, probably had an effect on the accuracy of the ECV. However, a 5% error in actual HCT would only result in a 2.5% difference in ECV and since the standard deviation of ECV in this group was 10.8% it would require an error of 20% in the HCT to result in substantial bias. Additionally, the HCT in most TOF subjects is in the normal range. Using patients with cardiomyopathy as the normal cardiac function control group does not assure normal liver conditions since all subjects have an underlying medical or genetic diagnosis. However, upon review of individual medical records, it is likely these normal cardiac function patients have normal livers. Our study was done at a single tertiary care children’s hospital, and hence the age range of our patient population is skewed towards a younger age group. Despite these limitations, we believe this cohort and contrast provided reliable data for the study.
Acknowledgments
We would like to thank the Summer Undergraduate Research Fellowship (SURF) program at Cincinnati Children’s Hospital Medical Center.
Funding
Funding for this research was received with a grant from the NIH, R01DK100429.
Abbreviations
- CMR
Cardiovascular magnetic resonance
- ECV
extracellular volume
- CH
congestive hepatopathy
- TOF
tetralogy of Fallot
- MOLLI
modified look-locker inversion recovery
- GBCA
gadolinium based contrast agent
- MR
magnetic resonance
- HCT
haematocrit
- SD
standard deviation
- ROC
receiver operator characteristic
- DMD
Duchenne muscular dystrophy
- PHVC
Passive hepatic venous congestion
- AUC
Area under curve
- PACS
Picture archiving computer system
Footnotes
Compliance with Ethical Standards
Informed Consent: This was a retrospective study and informed consent was waived by the IRB.
Disclosure of potential conflict of interest: None
Ethical approval: All procedures performed in studies involving human participants were in accordance with the ethical standards of the institutional and/or national research committee and with the 1964 Helsinki declaration and its later amendments or comparable ethical standards.
Declarations
Ethics Approval and consent to participate
This study was approved by the Institutional Review Board and all study procedures were performed in a HIPPA compliant manner.
Consent for publication
Not applicable.
Availability of data and material
The PACS system (Merge; Chicago, IL, USA) was searched for all patients who had a dedicated CMR examination.
Competing interests
Not applicable.
Authors’ Contributions
All authors read, critically edited the initial manuscript, added intellectual content and approved the final version. IMK, SDS and RJF designed, coordinated and conducted the study. IMK acquired all data and was mentored by SDS under the SURF program. SX assisted with study design and added critical manuscript content.
References
- 1.Dennis M, et al. Adults with repaired tetralogy: low mortality but high morbidity up to middle age. Open Heart. 2017;4(1):e000564. doi: 10.1136/openhrt-2016-000564. [DOI] [PMC free article] [PubMed] [Google Scholar]
- 2.Wells ML, et al. Imaging Findings of Congestive Hepatopathy. Radiographics. 2016;36(4):1024–37. doi: 10.1148/rg.2016150207. [DOI] [PubMed] [Google Scholar]
- 3.Simonetto DA, et al. Chronic passive venous congestion drives hepatic fibrogenesis via sinusoidal thrombosis and mechanical forces. Hepatology. 2015;61(2):648–59. doi: 10.1002/hep.27387. [DOI] [PMC free article] [PubMed] [Google Scholar]
- 4.Bandula S, et al. Equilibrium contrast-enhanced CT imaging to evaluate hepatic fibrosis: initial validation by comparison with histopathologic sampling. Radiology. 2015;275(1):136–43. doi: 10.1148/radiol.14141435. [DOI] [PubMed] [Google Scholar]
- 5.Li XM, et al. Diagnostic value of gadobenate dimeglumine-enhanced hepatocyte-phase magnetic resonance imaging in evaluating hepatic fibrosis and hepatitis. World J Gastroenterol. 2017;23(17):3133–3141. doi: 10.3748/wjg.v23.i17.3133. [DOI] [PMC free article] [PubMed] [Google Scholar]
- 6.Ratziu V, et al. Sampling variability of liver biopsy in nonalcoholic fatty liver disease. Gastroenterology. 2005;128(7):1898–906. doi: 10.1053/j.gastro.2005.03.084. [DOI] [PubMed] [Google Scholar]
- 7.Regev A, et al. Sampling error and intraobserver variation in liver biopsy in patients with chronic HCV infection. Am J Gastroenterol. 2002;97(10):2614–8. doi: 10.1111/j.1572-0241.2002.06038.x. [DOI] [PubMed] [Google Scholar]
- 8.Arthur MJ. Reversibility of liver fibrosis and cirrhosis following treatment for hepatitis C. Gastroenterology. 2002;122(5):1525–8. doi: 10.1053/gast.2002.33367. [DOI] [PubMed] [Google Scholar]
- 9.Towbin AJ, Serai SD, Podberesky DJ. Magnetic resonance imaging of the pediatric liver: imaging of steatosis, iron deposition, and fibrosis. Magn Reson Imaging Clin N Am. 2013;21(4):669–80. doi: 10.1016/j.mric.2013.05.001. [DOI] [PubMed] [Google Scholar]
- 10.Messroghli DR, et al. Modified Look-Locker inversion recovery (MOLLI) for high-resolution T1 mapping of the heart. Magn Reson Med. 2004;52(1):141–6. doi: 10.1002/mrm.20110. [DOI] [PubMed] [Google Scholar]
- 11.Lee JJ, et al. Myocardial T1 and Extracellular Volume Fraction Mapping at 3 Tesla. Journal of Cardiovascular Magnetic Resonance. 2011;13 doi: 10.1186/1532-429X-13-75. [DOI] [PMC free article] [PubMed] [Google Scholar]
- 12.Chow AM, et al. Measurement of liver T1 and T2 relaxation times in an experimental mouse model of liver fibrosis. Journal of Magnetic Resonance Imaging. 2012;36(1):152–158. doi: 10.1002/jmri.23606. [DOI] [PubMed] [Google Scholar]
- 13.Kawel-Boehm N, et al. Normal values for cardiovascular magnetic resonance in adults and children. J Cardiovasc Magn Reson. 2015;17:29. doi: 10.1186/s12968-015-0111-7. [DOI] [PMC free article] [PubMed] [Google Scholar]
- 14.Jae SY, et al. Higher blood hematocrit predicts hypertension in men. J Hypertens. 2014;32(2):245–50. doi: 10.1097/HJH.0000000000000029. [DOI] [PubMed] [Google Scholar]
- 15.Banerjee R, et al. Multiparametric magnetic resonance for the non-invasive diagnosis of liver disease. J Hepatol. 2014;60(1):69–77. doi: 10.1016/j.jhep.2013.09.002. [DOI] [PMC free article] [PubMed] [Google Scholar]
- 16.Yin M, et al. Hepatic MR Elastography: Clinical Performance in a Series of 1377 Consecutive Examinations. Radiology. 2016;278(1):114–24. doi: 10.1148/radiol.2015142141. [DOI] [PMC free article] [PubMed] [Google Scholar]
- 17.Xanthakos SA, et al. Use of magnetic resonance elastography to assess hepatic fibrosis in children with chronic liver disease. J Pediatr. 2014;164(1):186–8. doi: 10.1016/j.jpeds.2013.07.050. [DOI] [PMC free article] [PubMed] [Google Scholar]
- 18.Cassinotto C, et al. MR relaxometry in chronic liver diseases: Comparison of T1 mapping, T2 mapping, and diffusion-weighted imaging for assessing cirrhosis diagnosis and severity. European Journal of Radiology. 2015;84(8):1459–1465. doi: 10.1016/j.ejrad.2015.05.019. [DOI] [PubMed] [Google Scholar]
- 19.Ding Y, et al. Liver fibrosis staging using T1 mapping on gadoxetic acid-enhanced MRI compared with DW imaging. Clin Radiol. 2015;70(10):1096–103. doi: 10.1016/j.crad.2015.04.014. [DOI] [PubMed] [Google Scholar]
- 20.Serai SD, Towbin AJ, Podberesky DJ. Pediatric liver MR elastography. Dig Dis Sci. 2012;57(10):2713–9. doi: 10.1007/s10620-012-2196-2. [DOI] [PubMed] [Google Scholar]
- 21.Serai SD, Trout AT, Sirlin CB. Elastography to assess the stage of liver fibrosis in children: Concepts, opportunities, and challenges. Clinical Liver Disease. 2017;9(1):5–10. doi: 10.1002/cld.607. [DOI] [PMC free article] [PubMed] [Google Scholar]
- 22.Serai SD, et al. Magnetic resonance elastography of the liver in patients status-post fontan procedure: feasibility and preliminary results. Congenit Heart Dis. 2014;9(1):7–14. doi: 10.1111/chd.12144. [DOI] [PMC free article] [PubMed] [Google Scholar]


