

Abstract
Non-alcoholic fatty liver disease (NAFLD) is the most common diffuse liver disease, with a worldwide prevalence of 20% to 46%. NAFLD can be subdivided into simple steatosis and nonalcoholic steatohepatitis. Most cases of simple steatosis are non-progressive, whereas nonalcoholic steatohepatitis may result in chronic liver injury and progressive fibrosis in a significant minority. Effective risk stratification and management of NAFLD requires evaluation of hepatic parenchymal fat, fibrosis, and inflammation. Liver biopsy remains the current gold standard; however, non-invasive imaging methods are rapidly evolving and may replace biopsy in some circumstances. These methods include well-established techniques, such as conventional ultrasonography, computed tomography, and magnetic resonance imaging and newer imaging technologies, such as ultrasound elastography, quantitative ultrasound techniques, magnetic resonance elastography, and magnetic resonance-based fat quantitation techniques. The aim of this article is to review the current status of imaging methods for NAFLD risk stratification and management, including their diagnostic accuracy, limitations, and practical applicability.
Keywords: Simple steatosis, Non-alcoholic fatty liver disease, Ultrasonography, Computed tomography, Nonalcoholic steatohepatitis, Elastography, Magnetic resonance
Core tip: Patients with non-alcoholic fatty liver disease (NAFLD) are at risk of steatohepatitis and progressive liver fibrosis culminating in cirrhosis, typically over a period of decades. Early diagnosis and risk stratification are essential for effective management. Current imaging methods such as ultrasound, computed tomography, and magnetic resonance elastography have demonstrated their values to serve as noninvasive imaging biomarkers to evaluate NAFLD progression, but they are still relatively limited in the detection of inflammation, which is more important than steatosis in terms of its high risk for fibrosis, cirrhosis, and hepatocellular carcinoma.
INTRODUCTION
Non-alcoholic fatty liver disease (NAFLD) is increasingly becoming a disease of clinical importance, largely due to increasing prevalence, better understanding of pathophysiology, and rapid development of therapeutics[1]. In this article, we review imaging methods for NAFLD screening, diagnosis and risk stratification, with a focus on diagnostic accuracy, limitations, and practical applicability.
EPIDEMIOLOGY AND CLINICAL FEATURES OF NAFLD
NAFLD is a chronic liver disease defined as the pathological presence of hepatic steatosis (> 5% of the cross-sectional area of the liver occupied by fat vacuoles) in the absence of any secondary cause for hepatic fat accumulation, such as alcohol use, steatogenic medication, and hereditary disorders[1]. It has an estimated worldwide prevalence ranging from 20% to 46%, varying with study population and diagnostic criteria used[2]. In the United States, NAFLD is estimated to affect approximately 30% (100 million) of the population[3,4]. The prevalence is even higher amongst obese (70%) and diabetic (90%) individuals[5]. NAFLD-related liver impairment is expected to be the dominant cause of end stage liver disease (ESLD) requiring transplantation in the United States by 2020[4].
NAFLD comprises a spectrum of disease that can be simplified into two categories: (1) Simple Steatosis (SS), 70%-75% of cases, defined by excess liver fat without inflammation or cellular injury; and (2) nonalcoholic steatohepatitis (NASH), 25%-30% of cases, defined by the presence of excess liver fat with inflammation and cellular injury[1,2]. It is important to appreciate that SS and NASH are not entirely distinct, with many patients falling along a spectrum of fatty accumulation, inflammation, and hepatocyte injury. Nonetheless, this simplification facilitates prognostication and assessment of clinical significance. In most cases, SS is non-progressive, and does not result in liver fibrosis or progressive liver disease. However, recent longitudinal paired biopsy studies have shown that some patients with SS can progress to develop inflammation and fibrosis[6], and up to 20%–30% can progress to NASH[7]. Patients with NASH have a 20%–50% risk of developing progressive inflammation or liver fibrosis[8,9] and have a 2%–20% 5-year cumulative incidence of hepatocellular carcinoma[10]. In addition, NAFLD is an independent cardiovascular disease risk factor with a 70% overall mortality increase, driven by a about 300% increase in cardiovascular disease mortality[11].
PATHOPHYSIOLOGY OF NAFLD
The underlying pathophysiology of NAFLD is the accumulation of hepatic free fatty acids and triglycerides[12]. The pathogenesis of progression from simple fatty liver to NASH is not fully understood. The widely popular “two-hit hypothesis,” suggests a “first hit” involves lipid accumulation in the hepatocytes, which increases the risk for a “second hit,” comprising several factors, which result in hepatic injury, inflammation, and fibrosis[13]. The “multiple hit” hypothesis considers multiple insults, such as insulin resistance, hormones secreted from the adipose tissue, gut microbiota, genetic, epigenetic factors and nutritional factors, many of them acting together in genetically predisposed subjects to induce NAFLD[14,15].
Irrespective of the underlying pathophysiological process, adequate characterization of the NAFLD spectrum for prognostication necessitates the evaluation of three disease components. (1) Hepatic steatosis: The diagnosis and quantification of hepatic fat is the threshold criterion for the diagnosis of NAFLD. Steatosis has also been recognized as a risk factor for diabetes and other cardiovascular risk factors[14] (Figure 1); (2) Inflammation and cellular injury: steatohepatitis is distinguished from steatosis by the presence of inflammation in conjunction with a particular form of hepatocyte injury termed hepatocyte ballooning, which distinguishes the progressive form of NAFLD from the non-progressive forms[16]. Other histologic features of NASH are variably present and include necrosis, glycogen nuclei, Mallory bodies and fibrosis[17]; and (3) Fibrosis: Clinical outcomes have been shown to be correlated with fibrosis, and hence identification and quantification of fibrosis is crucial for effective risk stratification and disease management[18].
Figure 1.

Pathological changes of liver simple steatosis and cirrhosis. A: 45-year-old man with simple steatosis. The liver biopsy shows marked macrovesicular steatosis without inflammation or fibrosis (H and E x4); B: 48-year-old man with cirrhosis due to non-alcoholic fatty liver disease. In addition to marked macrovesicular steatosis, there is loss of normal hepatic architecture and replacement by regenerative nodules surrounded by bands of fibrous tissue, a characteristic feature of cirrhosis (H and E x4).
ROLE OF LIVER BIOPSY
Adequate NAFLD risk stratification and management requires assessment and preferably quantification of hepatic parenchymal fat, inflammation, and fibrosis. The current gold standard remains liver biopsy. Liver biopsy specimen evaluation in NAFLD patients can presently be accomplished using standardized pathologic staging systems, including the Kleiner modification of the Brunt scoring system or the NASH-CRN (Nonalcoholic Steatohepatitis Clinical Research Network) scoring system[19]. For example, the Brunt criteria include evaluation of fat, fibrosis, and necroinflammation, and according to this system, NASH is diagnosed by the presence of fibrosis (grade 1 or more) or necroinflammation (grade 2 or more)[20].
Patients with a higher likelihood of NASH based on clinical criteria will usually be referred for liver biopsy. Limitations of liver biopsy include sampling error, interobserver variability, patient anxiety, and procedure-related morbidity and mortality[21]. Ultimately, the high prevalence of NAFLD implies that liver biopsy is not a viable tool for widespread NAFLD risk stratification.
NON-INVASIVE METHODS FOR NAFLD EVALUATION
The limitations of liver biopsy have driven a search for non-invasive NAFLD screening and risk stratification methods. Since advanced fibrosis has been proven to be prognostic of poor outcomes in NAFLD, multiple surrogate fibrosis markers have been studied, including clinical predictors, serum biomarkers, and imaging methods[22]. One of these methods, the NAFLD fibrosis score, is used to assess advanced fibrosis risk. In this method, clinical parameters such as age, body mass index, albumin, AST/ALT ratio, etc., are used to calculate a score. A score of > 0.676 has an 82% positive predictive value in diagnosing advanced liver fibrosis (stage ≥ 3 in a 5-stage fibrosis scoring system) in patients with histology-proven NAFLD[19]. Serum biomarkers such as aspartate aminotransferase (AST) and alanine aminotransferase (ALT) have been shown to be elevated in patients with NAFLD/NASH, although normal aminotransferase levels do not exclude the diagnosis of SS or NASH[23]; patients with advanced NAFLD have been reported to have normal ALT levels[3].
A variety of imaging modalities are increasingly used for NAFLD evaluation and include conventional imaging techniques as well as newer technologies. Conventional imaging techniques consist of B-mode ultrasonography (US), computed tomography (CT), and magnetic resonance (MR) imaging. Findings in NAFLD patients with these techniques are based on lipid accumulation. However, evaluation of inflammation and degrees of fibrosis less than cirrhosis are not possible with conventional imaging techniques. Newer imaging technologies are being increasingly used in combination with conventional technologies and include ultrasound elastography (USE), quantitative ultrasound-based techniques, magnetic resonance elastography (MRE), and magnetic resonance-based fat quantitation techniques[24].
IMAGING ASSESSMENT OF NAFLD
Imaging evaluation of the liver has several advantages over liver biopsy and serum biomarkers in the evaluation of NAFLD, including: (1) non-invasiveness; (2) evaluation a greater volume of liver parenchyma than biopsy, which reduces sampling error in heterogeneously distributed diffuse liver disease processes; and (3) less variability and more quantitative than histopathologic liver biopsy specimen evaluation with some techniques[25].
Ultrasonography
Conventional US is often the first imaging modality used to evaluate fatty liver clinically[26], especially for screening of suspected NAFLD, due to its lack of invasiveness, wide availability, and relatively low cost[27]. NAFLD sonographic features include increased echogenicity, hepatomegaly, and intra-hepatic vascular blurring[28]. Fatty liver has higher echogenicity than renal cortex and splenic parenchyma owing to intracellular fat vacuole accumulation[29], Figure 2 with increased acoustic wave reflection. Steatosis is reported to be detectable by US when more than 20% of hepatocytes contain histologically visible fat droplets, with a reported sensitivity of 79.7% and specificity of 86.2%[30].
Figure 2.
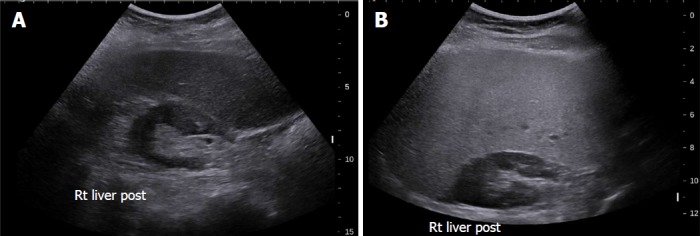
Grey-scale ultrasound in non-alcoholic fatty liver disease. A: 47-year-old female with increased echogenicity of the liver relative to the right kidney, a classic sonographic finding of hepatic steatosis. The patient had elevated serum liver enzymes and underwent a liver biopsy for NASH evaluation; B: 51-year-old female who underwent liver biopsy as part of clinical follow-up. On evaluation of liver pathology, there was no steatosis. Ultrasound image shows normal echogenicity of the liver parenchyma, which is only slightly hyperechoic relative to the renal parenchyma.
There are several limitations of conventional US for NAFLD evaluation: (1) It is qualitative and therefore subjective. The value of conventional US to evaluate NAFLD is limited by the subjective nature of the criteria used to differentiate fatty from normal liver and a lack of sonographic criteria for different degrees of steatosis; (2) Sensitivity is limited when there are few steatotic hepatocytes[30]; (3) The sensitivity and specificity of B mode sonography decreases as BMI (body mass index) increases, varying between 49%-100% and 75%-95%[31]; and (4) Conventional sonography cannot differentiate steatosis and steatohepatitis or stage fibrosis[32,33].
Quantitative ultrasound (QUS) parameters, including attenuation coefficient and backscatter coefficient (BSC), have been developed for liver fat quantification. Attenuation coefficient measures ultrasound energy loss in tissue and provides a quantitative parameter analogous to the qualitative loss of view of deeper structures observed in severe fatty liver[34]. BSC measures the returned ultrasound energy from tissue and provides a quantitative parameter analogous to echogenicity[35]. One study compared the diagnostic performances of attenuation coefficient, BSC, and MRI proton density fat fraction (MRI-PDFF) to differentiate three histological steatosis grades (grade 1, 2, and 3), and revealed AUROCs (area under receiver operating characteristic) ranges of 0.779–0.804, 0.811–0.860, and 0.929–0.962, respectively[36]. In another study, BSC showed excellent diagnostic performance for quantification of hepatic steatosis compared to MRI-PDFF, with AUROCs ranging from 0.90-0.97 at various degrees of hepatic steatosis (MRI-PDFF ≥ 4%, 5%, 6%, and 8%)[35]. Although QUS parameters have shown potential for accurate hepatic steatosis quantitation, assessment of variation across different scanner manufacturers and operators is warranted to further investigate accuracy, reproducibility, and repeatability[36].
Ultrasound elastography (USE) quantitatively evaluates liver stiffness to make noninvasive evaluation of liver fibrosis and NASH clinically possible. The rationale is that fibrosis acts as a parenchymal scaffold that imparts rigidity. Estimated tissue stiffness therefore provides information on the presence and degree of fibrosis. Current state-of-the-art quantitative elastographic methods do not measure stiffness directly; rather, they assess the propagation of shear waves through tissue from which that tissue’s stiffness can be inferred.
USE can be broadly categorized into two methods; (1) Transient elastography (a non-imaging ultrasound-based technique); and (2) imaging-based elastography techniques. Two broad categories of imaging-based sonoelastography are currently in clinical use: (1) strain elastography (SE), which is dependent on operator or physiologic forces to produce tissue deformation; and (2) SWE (shear wave elastography), which is dependent on acoustic radiation force induced tissue displacement[37-43] (Table 1).
Table 1.
Summary table for the value of conventional and elastographic imaging modalities in non-alcoholic fatty liver disease stratification
| Modality | Steatosis assessment | Fibrosis assessment | SS / NASH differentiation |
| Conventional imaging | |||
| US | Not quantitative1[30]: Sensitivity 79.7%, Specificity 86.2% | No for fibrosis, but can detect cirrhosis with high sensitivity | No |
| CT | Quantitative2[38]: Sensitivity 82%, Specificity 100% | Semi-quantitative for fibrosis, but can detect cirrhosis with high sensitivity[39] | No |
| MRI | Quantitative3: Sensitivity 76.7%-90.0%, Specificity 87.1%-91%[40,41] | No for fibrosis, but can detect cirrhosis with high sensitivity | No |
| Elastographic imaging | |||
| TE / CAP | Sensitivity 82%, Specificity 91%4[42] | Advanced Fibrosis[43]: Sensitivity 91%, Specificity 75% | No |
| USE | - | Advanced Fibrosis[44]: Sensitivity 100%, Specificity 91% | No |
| MRE | Sensitivity 90%, Specificity 93.3%5[42] | Advanced Fibrosis[45]: Sensitivity100%, Specificity 92% | Yes5[46]: Sensitivity 94%, Specificity 73% |
1Gray-scale US detecting steatosis (more than 20% of hepatocytes involved in fat infiltration); 2Non-contrast CT detecting steatosis;
MRI detecting liver histological steatosis; 4Evaluated by CAP based on TE; 5MRE discriminating steatosis from NASH using a threshold of 2.74 kPa. SS: Simple steatosis; NASH: Non-alcoholic steatohepatitis; US: Ultrasonography; CT: Computed tomography; MRI: Magnetic resonance imaging; TE: Transient elastography; CAP: Controlled attenuation parameter; USE: Ultrasound elastography; MRE: Magnetic resonance elastography.
Fibroscan employs ultrasound transient elastography (TE) to measure hepatic elasticity by quantifying the shear wave speed with pulse-echo ultrasound from low frequency vibrations that are transmitted into the liver[44-46]. It is able to detect liver cirrhosis with high accuracy, and liver stiffness measurements correlate with liver fibrosis stages[47]. In a NAFLD study with 246 subjects, the AUROCs for the detection of F ≥ 2 and F ≥ 3 were 0.84 and 0.93, respectively, and the sensitivity and specificity for F ≥ 3 were 91% and 75% at a cutoff value of 7.9 kPa[48]. A lower TE value appears to reliably exclude advanced fibrosis[49]. Because transient elastography requires transmission of a mechanical wave that originates at the skin, obesity is a significant cause of technical failure and unreliable measurements. To address this problem, the Fibroscan XL probe was developed for obese patients. Controlled attenuation parameter (CAP) is another technique implemented on the Fibroscan device. The reduction in ultrasound amplitude can be estimated as the sound wave traverses liver tissues using the same radiofrequency[50]. In a study of 183 patients, CAP showed good capability in discriminating NASH from simple steatosis, with an AUROC of 0.812 (95%CI: 0.724-0.880)[51].
Two-dimensional SWE (2D-SWE) is an ultrasound-based technique that provides visualization of viscoelastic properties of soft tissue in real time[52]. These techniques employ acoustic radiation force impulses to induce tissue movements at a microscopic level, which in turn produces tissue shear waves. Shear wave speed is algebraically related to tissue stiffness under simple assumptions, expressed as Young’s modulus[53]. Unfortunately, vendors of ultrasound elastography equipment use technical terminology inconsistently, which can cause confusion. Researchers have attempted to use this technique for evaluating liver fat content, however, a recent study showed that the SWE value was essentially independent of hepatic liver fat content and was not comparable with the subjective evaluation of liver echogenicity in terms of hepatic steatosis evaluation[54].
Acoustic radiation force impulse (ARFI) imaging is a technique of point shear wave elastography, which refers to the use of acoustic energy to create shear waves in tissue and quantitatively measures the shear wave velocity as a marker of elasticity. It has been shown that ARFI-induced liver shear wave velocity increases with increasing hepatic fibrosis. A study of 54 patients with NAFLD showed that, at a cutoff of shear wave speed (SWS) of 1.77 m/s, AUROC, sensitivity, and specificity for the diagnosis of stage ≥ 3 fibrosis have been reported to be as high as 0.973, 100%, and 91%, respectively[44]. The relationship between shear wave speed and steatosis is unclear. In one study, SWS was reduced in NAFLD patients, and SWS was lower in patients with simple steatosis than in healthy volunteers. If true, this would make it difficult to distinguish between simple steatosis and NASH with mild fibrosis[49]. However, in other studies, steatosis had no effect on SWS elasticity estimates[48].
Inflammation is known to increase shear wave velocity, confounding fibrosis staging. Nonetheless, the information obtained may permit diagnosis of NASH[55] (Figure 3).
Figure 3.

Share wave elastography in non-alcoholic fatty liver disease. A: 54-year old female who underwent liver biopsy for NASH evaluation. The biopsy demonstrated steatosis only with no inflammation or fibrosis. SWE median value of 7.05 kPa; B: SWE in a 52-year old female that underwent liver biopsy for the evaluation of NASH. A median SWE value of 11.5 kPa was significantly higher than normal liver with steatosis only. On biopsy, the subject had fibrosis stage 0 according to the METAVIR system and fibrosis stage 1a as per the NAS CRN criteria. The non-alcoholic fatty liver disease activity score in this patient was 6, consistent with NASH. NASH: Non-alcoholic steatohepatitis; SWE: Share wave elastography.
A large body habitus with BMI > 28 kg/m2 also predisposes to failure of shear wave measurements in NAFLD. In one study, successful SWE measurements were captured in only 75% of obese patients (BMI ≥ 28 kg/m2) using a standard probe (78). To improve diagnostic performance, combined ultrasound elastographic methods have been used for liver fibrosis assessment. For example, shear wave elastography and FibroS can were both used in patients with chronic hepatitis C, resulting in high performance in fibrosis staging when used in combination[56].
In summary, among the different ultrasound techniques for differentiating NASH and simple steatosis, TE is studied much more extensively than SWE, but both appear to have similar accuracy[57].
CT
Unenhanced CT is more specific than US for NAFLD detection[58]. The mechanism of unenhanced CT to assess NAFLD utilizes attenuation values to evaluate the liver triglyceride content. Hepatic steatosis manifests as reduced attenuation in the liver parenchyma[29], which correlates with the degree of intrahepatic fat accumulation[59]. CT parameters to evaluate fatty liver include (1) the absolute attenuation value (HU, Hounsfield units); (2) the attenuation value difference between the liver and spleen; and (3) ratio of the liver to the splenic attenuation values.
The normal attenuation value of the unenhanced liver parenchyma is 50-65 HU, which is typically 8-10 HU higher than the spleen[26]. The sensitivity and specificity of unenhanced CT to assess ≥ 30% macrovesicular steatosis has been reported to be 100% (95%CI: 70-100) and 95% (95%CI: 90-98), respectively, at a cutoff of 58 HU and 73% (95%CI: 43-91) and 100% (95%CI: 97-100), respectively, at a cutoff of 42 HU[38]. A recent longitudinal study following NAFLD patients using CT showed no progression of moderate-to-severe hepatic steatosis to symptomatic fatty liver disease over a 5-10-year time period[60]. This may be ascribed to the variations of liver fat content changes over time. BMI changes were identified as an influencing factor, which was negatively correlated with changes in attenuation[61].
Using these normal values on unenhanced CT, various combinations of liver parenchyma versus spleen parenchyma attenuation values have been studied to evaluate fat accumulation in the liver[38]. The normal difference of hepatic and splenic attenuation on unenhanced CT (CTL-S) ranges from 1-18 HU. An unenhanced CTL-S of less than 1 HU can diagnose ≥ 30% hepatic steatosis, with a sensitivity of 67%[62]. The liver/spleen attenuation ratio is another helpful parameter, which has an acceptable diagnostic performance for steatosis detection[63] (Figure 4). Unenhanced CT assessment of hepatic steatosis can be confounded by deposition of materials other than fat, including iron, copper, glycogen, and amiodarone[64].
Figure 4.
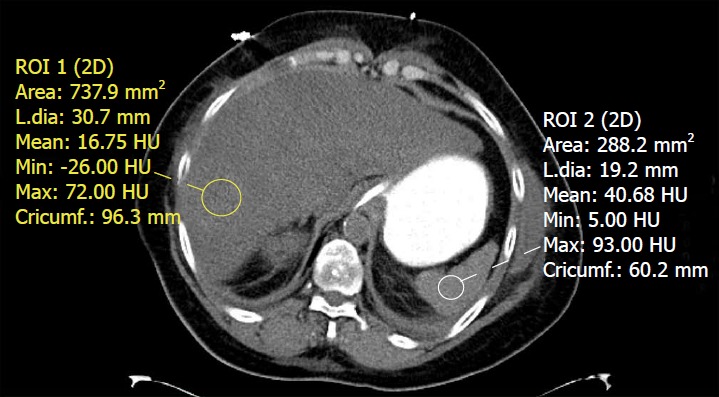
Unenhanced computed tomography of the abdomen in a patient with fatty liver disease. Regions of interest placed within the liver and spleen demonstrate a hepatic attenuation of 16.75 Hounsfield units (less than 40) and a splenic attenuation of 40.68 Hounsfield units. This meets the definition of fatty liver on CT by absolute value, liver/spleen attenuation difference, and liver/spleen attenuation ratio criteria.
CT has limited diagnostic performance for quantitative assessment of mild steatosis; it is sensitive for detecting moderate to advanced steatosis. CT can evaluate for pre-cirrhotic liver fibrosis, with parameters such as the caudate-to-right-lobe ratio and decreased diameter of the hepatic veins. The combination of both of these parameters showed good diagnostic performance for pre-cirrhotic liver fibrosis (sensitivity 83%, specificity 76%) and liver cirrhosis (sensitivity 88%, specificity 82%)[39].
Voxel-based CT attenuation values are subject to be influenced by the contents in the dedicated voxel, so CT values may be influenced by other materials in the liver, such as iron or glycogen, even having the same fat content[65]. Other sources of variations in attenuation values include CT scan settings (voltage, tube current, pitch, etc.) and patient parameters (BMI, iodinated contrast agents, etc.), all of which limit the reliability of unenhanced CT for quantitative measurement[54,66,67].
Contrast-enhanced CT: Both hepatic and splenic attenuation can be influenced by altered perfusion, acquisition timing, contrast type, dosage, and injection rate. On contrast-enhanced CT, a difference of liver/spleen attenuation of at least 20 HU between 80-100 s after intravenous contrast injection or at least 18.5 HU between 100-120 s after contrast administration (Figure 5) have sensitivity ranging from 54% to 93% and specificity ranging from 87%-93% for hepatic steatosis[68]. These criteria are confounded by variability in contrast-enhanced CT protocols and timing differences related to peripheral injection site variation[69], consequently reliability of the technique is limited. In general, the diagnosis of hepatic steatosis should be rendered only with caution or if the findings are unequivocal on contrast-enhanced CT.
Figure 5.
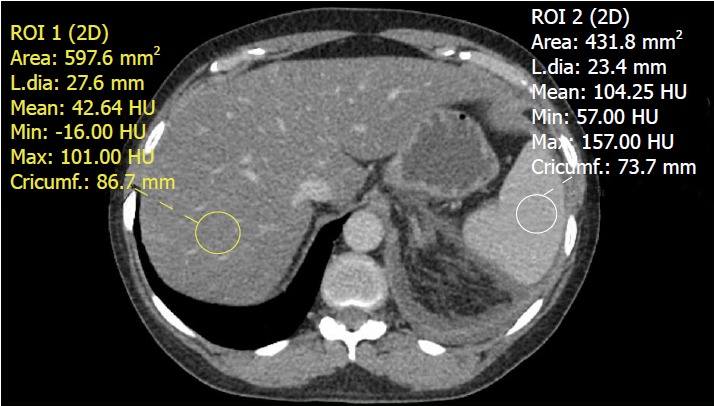
Contrast-enhanced computed tomography of the abdomen demonstrating a fatty liver. The liver has an attenuation value of 42.64 Hounsfield units while the spleen has an attenuation value of 104.25 Hounsfield units. An attenuation difference of 62 HU is highly suggestive of fatty liver disease.
Dual-energy CT: Recent advances in dual-energy CT (DECT) have introduced the ability to perform material decomposition, which has been shown to more accurately quantify hepatic steatosis and potentially permit fibrosis staging[70]. In DECT, the liver is imaged at two different energy levels (typically 80 kVp and 140 kVp). Attenuation differences of tissue at different energies levels are a function of tissue composition, allowing for post-processing of images into “material decomposition images.” Material separation enables the generation of iodine, water, and fat-weighted images. DECT has the potential to quantitate liver fat content independent of ROI (region of interest) placement[71] (Figure 6). In a recent study of 50 patients, DECT measurement of fat content showed good correlation with magnetic resonance spectroscopy (MRS), indicating its potential to quantify steatosis[54].
Figure 6.
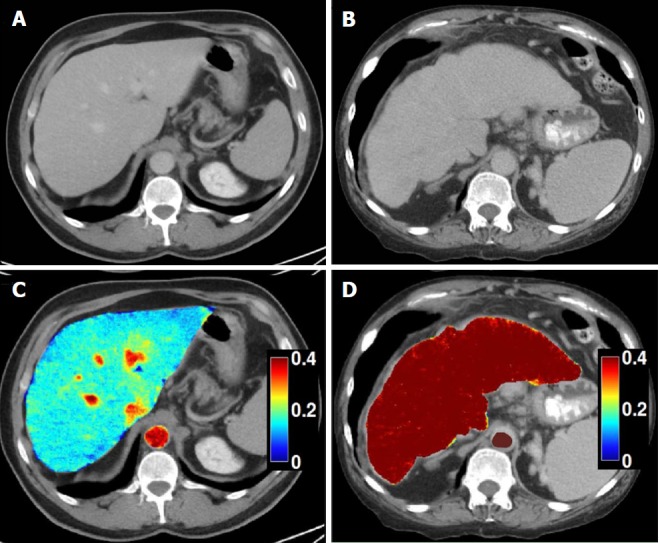
Dual-energy CT images for the assessment of liver fibrosis. A: Delayed phase axial CT images from a patient with mild fibrosis; B: Severe fibrosis; C-D: DECT color overlay contrast agent maps. Iodine concentration within the liver parenchyma in reference to that in the aorta [NIC (normalized iodine concentration) in mg/mL = I Liver / I Aorta] on 5 min delayed acquisitions can be seen on the images. Since contrast media is retained within fibrotic tissues, the NIC on delayed-phase images increases with the severity of liver fibrosis; D: Patients with severe cirrhosis have higher parenchymal contrast media retention on delayed images in relationship to the aorta, as compared to the mild retention in patients with lesser grades of liver fibrosis (C).
Single-energy CT: Unenhanced single-energy CT (SECT) attenuation values has shown good correlation with quantitative MRI in animal NAFLD models[72]. In a human study, SECT attenuation values acquired at 120 kVp had good correlation with MRS (r2 = 0.855) in overall patients, but the correlation was significantly lower with MRS in patients with less than 5.56% fat at MRS (r2 = 0.07), which may be ascribed to the fact that minimal fat in the liver is not CT-detectable[54]. This study also showed that unenhanced SECT (120 kVp) had high performacne for fat quantification compared with DECT (80 and 140 kVp). This was likely bacause DECT was presumably used with contrast enhancement, which accentuated the differences between iodine and the liver but not between fat and water.
MRI
MRI is regarded as the most definitive imaging tool to qualitatively and quantitatively evaluate hepatic steatosis. Both fat and water contribute to the signal observed in the liver on MRI. Differences in the precession of protons in fat and water allow for detection of fat through various MR techniques (Table 1)[36,73]. The sensitivity and specificity of MRI for detecting histologically confirmed steatosis (≥ 5%) are 76.7%-90.0% and 87.1%-91%[40,41]. Frequency-selective MRI, chemical-shift-encoded MRI, and MR spectroscopy are three techniques that exploit fat-water precession differences to assess fatty liver disease[74].
Frequency-selective imaging applies a saturation radiofrequency pulse to the fat or water frequency range to selectively suppress (or excite) fat or water signals. Fat saturation is a common option for many clinical imaging sequences, including most spin-echo and gradient-echo based sequences at 1.5 T and higher. With fat saturation, the images coincide with the water signal alone; without fat saturation, they represent the sum of fat and water signals. Therefore, hepatic fat may be assessed by comparing these two sets of images. In hepatic steatosis, the fat-saturated images show relative signal loss compared to unsaturated images. In normal liver, fat saturation has no effect and the two sets of images have similar signal intensities. This approach is reasonable for qualitative assessment of liver fat, but does not lend itself to accurate or reliable fat quantification because it is not possible to achieve perfect fat suppression (or water excitation), and there is usually unsuppressed fat signal.
Dixon methods
Chemical-shift-encoded imaging methods, also termed Dixon methods, use the echo time-dependent phase-interference effect between fat and water gradient-echo signals to accurately detect and quantify fat content[63]. Because fat and water molecules process at different frequencies, they undergo phase interference at predictable intervals. Fat and water signals cancel at out-of-phase (OP) and add at in-phase (IP) echo times. Due to this phenomenon, hepatic fat may be assessed by comparing sequential OP and IP images. In fatty liver disease, the OP images show relative signal loss due to signal cancellation (Figure 7). In normal liver, the OP and IP images have similar intensities[75]. The OP pulse sequence should be obtained prior to the IP sequence to ensure that perceived signal loss is due to fat deposition and not T2* decay, which may occur in the setting of hepatic parenchymal iron deposition. Fat-only and water-only images can be computed using advanced chemical-shift-encoded imaging data. These techniques allow for reliable and reproducible detection of liver fat[76] but are unsuitable for fat quantification because of the presence of confounding factors.
Figure 7.

Hepatic steatosis on magnetic resonance imaging. A, B: In phase (A) and out of phase (B) gradient echo T1-weighted images of the abdomen demonstrate signal dropout on the out of phase image due to the presence of microscopic (intracellular) fat deposition in the liver; C: A fat only image via the Dixon method demonstrates diffuse fat accumulation as evidenced by increased T1 signal within the liver.
Dixon pulse sequences are offered as a standard fat-suppression technique by nearly every major vendor. Currently, GE (Milwaukee, WI) offers a three-point Dixon technique called IDEAL (Iterative Decomposition of water and fat with Echo Asymmetry and Least-squares estimation), which is a single acquisition technique that results in inherent registration between in-phase and out-of-phase sequences, allowing for reduced scan times and increased reproducibility[77]. The robust fat suppression of IDEAL also allows for imaging of challenging body parts, which is why it is widely utilized in musculoskeletal radiology. Another GE product, named Flex, is a two-point Dixon technique that, while providing less robust fat suppression than its IDEAL counterpart, offers faster acquisition for use in dynamic contrast-enhanced imaging and patients prone to motion artifact. Siemens (Erlangen, Germany) has two and three-point techniques under the generic name DIXON, which utilize multi-echo fat and water separation for detection of small concentrations of fat with increased contrast resolution. Philips (Best, the Netherlands) offers multi-point Dixon (mDixon) in a single breath hold to decrease acquisition time and maximize in-plane and through-plane resolution while offering flexibility in echo time settings. Hitachi (Tokyo, Japan) offers a two-point Dixon sequence called FatSep. Advantages of this technique include uniform fat suppression over a large field-of-view, particularly in the presence of a metal implant, as well as customizable levels of fat suppression (light, medium, or heavy). Toshiba (Tochigi, Japan) also has a 2-point Dixon technique called WFOP (Water-Fat Opposed Phase). Regardless of the implementation details, all of the current Dixon-type sequences produce four sets of images, including water only, fat only, in-phase, and out-of-phase[78] (Figure 8).
Figure 8.
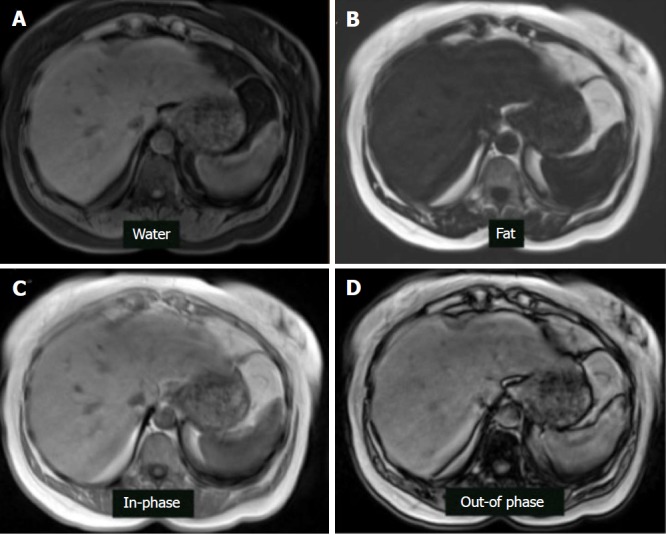
Magnetic resonance imaging dixon technique in the patient with hepatic steatosis. A: Water only sequence; B: Fat only sequence; C: In-phase sequence; D: Out-of-phase sequence.
Magnetic resonance spectroscopy (MRS) evaluates proton signals as a function of their resonant frequency, which shows multiple peaks at different locations within a specified volume of the liver[71]. The MR spectrum describes the intensity of MR signal as a function of precession frequency, with fat and water producing the most visible peaks. However, water occurs as a single peak and fat shows as multiple peaks due to its multiple chemical components[29]. Thus, in fatty liver disease, both water and fat spectral peaks are present. In normal (non-fatty) liver, only the water peak is seen. To be performed correctly, confounding factors need to be addressed including T1 bias (addressed by use of long repetition time ≥ 3000 ms), T2 relaxation (addressed by collecting spectra at multiple echo times and correcting for T2 decay), and J-coupling (minimized by using appropriate spectroscopic sequences and using the shortest possible mixing time).
Current state-of-the-art MR techniques for quantifying hepatic steatosis include confounder-corrected chemical-shift-encoded MRI, which can estimate the PDFF. Unlike US and CT, which use surrogate measures of fat in the form of altered echogenicity and attenuation, PDFF measures the fraction of MRI-visible protons bound to fat divided by all MRI-visible protons in the liver (fat and water)[79]. Using this technique, the liver signal on MRI is divided into water and fat signal components by acquiring gradient echoes at appropriately spaced echo times, so as to quantify the percentage of liver fat[80]. Images are acquired with a low flip angle to minimize T1 bias and at multiple echo times to measure and correct for T2* decay. The signal model mathematically incorporates a multi-peak fat spectrum to address the multi-frequency interference effects of protons in fat[81]. In a study of 50 patients, it was found that complex three-echo chemical-shift-encoded MRI is equivalent to MRS for quantifying liver fat, but only after correction for T2* decay and T1 recovery and spectral fat modeling[82]. MRI-PDFF has demonstrated a high diagnostic accuracy (AUROC = 0.989, 95%CI: 0.968-1.000) for detecting histological steatosis grade 1 or higher, and can be measured reproducibly across field strengths and scanner manufacturers[83].
Magnetic resonance elastography (MRE) uses a modified phase-contrast MRI sequence and an external mechanical actuator to induce and non-invasively visualize propagating tissue shear waves[84]. It estimates the degree of fibrosis throughout the liver by analyzing the resulting wavefield using a so-called inversion algorithm from which the magnitude of the complex shear modulus (often described as the “shear stiffness” for simplicity) is computed[31]. Similar to ultrasound elastography, MRE-estimated stiffness increases along with fibrosis stage. MRE can differentiate fibrosis between F ≥ 2 and F1 (sensitivity 89.7%, specificity 87.1%) at a stiffness cutoff value of 3.05 kPa, and it can also discriminate severe fibrosis (F3) from liver cirrhosis (sensitivity 100%; specificity 92.2%) with a cutoff value of 5.32 kPa[45]. In addition to staging advanced fibrosis, MRE has also shown high accuracy for discriminating SS from NASH in a retrospective study in a cohort of patients with a relatively high frequency of advanced disease (cutoff value 2.74 kPa, AUROC 0.93, sensitivity of 94%, and specificity 73%). The performance of MRE to diagnose NASH in the absence of significant fibrosis is unknown[46] but is thought to be limited. These studies indicate that MRE-measured hepatic stiffness has the potential to identify NASH before fibrosis onset. Finally, MRE shows superior diagnostic performance than TE for liver fibrosis evaluation, but low availability and high cost limit its widespread clinical adoption[29,42].
IMAGING ASSESSMENT OF NAFLD IN PEDIATRIC PATIENTS
The estimated prevalence of NAFLD in overall children is 10%, but increases to 40%-70% in the obese pediatric population[85]. The value of MRE and SWE in the pediatric population has been compared with that in adult patients. MRE has shown comparable sensitivity and specificity to detect any stage of fibrosis (≥ F1) from no fibrosis, and its optimal threshold to differentiate ≥ F3 fibrosis is reported 3.03-3.33 kPa, which were lower than in adults with NAFLD (3.45-4.8 kPa) (Figure 9)[37,86,87]. SWE is also an accurate technique to detect significant liver fibrosis (≥ F2) in pediatric patients with NAFLD (AUC = 0.97, 95%CI: 0.95-0.99) and for mild liver fibrosis (≥ F1, AUC = 0.92, 95%CI: 0.86-0.98)[88]. Given the variated thresholds in MRE and SWE, further investigation is warranted to validate and standardize optimal cutoffs for fibrosis staging. Additionally, current imaging techniques still have limitations to accurately discriminate pediatric early stage fibrosis, which is important to be monitored for early treatments.
Figure 9.

Examples of multiparametric magnetic resonance imaging measurements in pediatric patients[87]. A-C: MRI images in a healthy child without evidence of liver disease. A: Conventional T2-weighted fast spin echo (A); B: MRE with normal hepatic shear stiffness of 2.22 kPa (B), and corrected T1 time of 879 ms (C); D, F: Corresponding images in a child with biopsy-confirmed primary sclerosing cholangitis. D: The T2-weighted fast spin echo image shows heterogeneously increased liver signal due to fibrosis that can be quantified using texture mapping; E: MRE image shows an increased hepatic shear stiffness of 3.96 kPa; F: The corrected T1 time was increased to 1048 ms, likely due to a combination of fibrosis and inflammation.
CONCLUSION
Patients with NAFLD are at risk of steatohepatitis and progressive liver fibrosis culminating in cirrhosis, typically over a period of decades. Early diagnosis and risk stratification are essential for effective management. Current imaging methods such as ultrasound, CT, and MRI have demonstrated their values to serve as noninvasive imaging biomarkers to evaluate NAFLD progression, but they are still relatively limited in the detection of inflammation (NASH), which is more important than steatosis in terms of its high risk for fibrosis, cirrhosis, and HCC. Detection of NASH by imaging remains the future direction in NAFLD.
ACKNOWLEDGMENTS
The authors thank Dr. Dushyant Sahani and Dr. Manuel Patino for providing us with Figure 6.
Footnotes
Conflict-of-interest statement: All authors have no conflicts of interest to report.
Manuscript source: Unsolicited manuscript
Peer-review started: May 21, 2018
First decision: June 5, 2018
Article in press: June 28, 2018
Specialty type: Gastroenterology and Hepatology
Country of origin: United States
Peer-review report classification
Grade A (Excellent): A
Grade B (Very good): B
Grade C (Good): 0
Grade D (Fair): 0
Grade E (Poor): 0
P- Reviewer: Marzuillo P, Grgurevic I S- Editor: Ma YJ L- Editor: A E- Editor: Tan WW
Contributor Information
Qian Li, Department of Radiology, Massachusetts General Hospital, Harvard Medical School, Boston, MA 02114, United States.
Manish Dhyani, Department of Radiology, Massachusetts General Hospital, Harvard Medical School, Boston, MA 02114, United States; Department of Radiology, Lahey Hospital and Medical Center, 41 Burlington Mall Road, Burlington, MA 01805, United States. dhyani.manish@mgh.harvard.edu.
Joseph R Grajo, Department of Radiology, Division of Abdominal Imaging, University of Florida College of Medicine, Gainesville, FL 32610, United States.
Claude Sirlin, Altman Clinical Translational Research Institute, University of California, San Diego, CA 92103, United States.
Anthony E Samir, Department of Radiology, Massachusetts General Hospital, Harvard Medical School, Boston, MA 02114, United States.
References
- 1.Williams CD, Stengel J, Asike MI, Torres DM, Shaw J, Contreras M, Landt CL, Harrison SA. Prevalence of nonalcoholic fatty liver disease and nonalcoholic steatohepatitis among a largely middle-aged population utilizing ultrasound and liver biopsy: a prospective study. Gastroenterology. 2011;140:124–131. doi: 10.1053/j.gastro.2010.09.038. [DOI] [PubMed] [Google Scholar]
- 2.Chalasani N, Younossi Z, Lavine JE, Diehl AM, Brunt EM, Cusi K, Charlton M, Sanyal AJ; American Gastroenterological Association; American Association for the Study of Liver Diseases; American College of Gastroenterologyh. The diagnosis and management of non-alcoholic fatty liver disease: practice guideline by the American Gastroenterological Association, American Association for the Study of Liver Diseases, and American College of Gastroenterology. Gastroenterology. 2012;142:1592–1609. doi: 10.1053/j.gastro.2012.04.001. [DOI] [PubMed] [Google Scholar]
- 3.Rinella ME. Nonalcoholic fatty liver disease: a systematic review. JAMA. 2015;313:2263–2273. doi: 10.1001/jama.2015.5370. [DOI] [PubMed] [Google Scholar]
- 4.Idowu MO, Chhatrala R, Siddiqui MB, Driscoll C, Stravitz RT, Sanyal AJ, Bhati C, Sargeant C, Luketic VA, Sterling RK, et al. De novo hepatic steatosis drives atherogenic risk in liver transplantation recipients. Liver Transpl. 2015;21:1395–1402. doi: 10.1002/lt.24223. [DOI] [PubMed] [Google Scholar]
- 5.Hannah WN Jr, Harrison SA. Nonalcoholic fatty liver disease and elastography: Incremental advances but work still to be done. Hepatology. 2016;63:1762–1764. doi: 10.1002/hep.28504. [DOI] [PubMed] [Google Scholar]
- 6.McPherson S, Hardy T, Henderson E, Burt AD, Day CP, Anstee QM. Evidence of NAFLD progression from steatosis to fibrosing-steatohepatitis using paired biopsies: implications for prognosis and clinical management. J Hepatol. 2015;62:1148–1155. doi: 10.1016/j.jhep.2014.11.034. [DOI] [PubMed] [Google Scholar]
- 7.Wong VW, Wong GL, Choi PC, Chan AW, Li MK, Chan HY, Chim AM, Yu J, Sung JJ, Chan HL. Disease progression of non-alcoholic fatty liver disease: a prospective study with paired liver biopsies at 3 years. Gut. 2010;59:969–974. doi: 10.1136/gut.2009.205088. [DOI] [PubMed] [Google Scholar]
- 8.Harrison SA, Torgerson S, Hayashi PH. The natural history of nonalcoholic fatty liver disease: a clinical histopathological study. Am J Gastroenterol. 2003;98:2042–2047. doi: 10.1111/j.1572-0241.2003.07659.x. [DOI] [PubMed] [Google Scholar]
- 9.Sorrentino P, Tarantino G, Conca P, Perrella A, Terracciano ML, Vecchione R, Gargiulo G, Gennarelli N, Lobello R. Silent non-alcoholic fatty liver disease-a clinical-histological study. J Hepatol. 2004;41:751–757. doi: 10.1016/j.jhep.2004.07.010. [DOI] [PubMed] [Google Scholar]
- 10.White DL, Kanwal F, El-Serag HB. Association between nonalcoholic fatty liver disease and risk for hepatocellular cancer, based on systematic review. Clin Gastroenterol Hepatol. 2012;10:1342–1359.e2. doi: 10.1016/j.cgh.2012.10.001. [DOI] [PMC free article] [PubMed] [Google Scholar]
- 11.Athyros VG, Tziomalos K, Katsiki N, Doumas M, Karagiannis A, Mikhailidis DP. Cardiovascular risk across the histological spectrum and the clinical manifestations of non-alcoholic fatty liver disease: An update. World J Gastroenterol. 2015;21:6820–6834. doi: 10.3748/wjg.v21.i22.6820. [DOI] [PMC free article] [PubMed] [Google Scholar]
- 12.Yeh MM, Brunt EM. Pathological features of fatty liver disease. Gastroenterology. 2014;147:754–764. doi: 10.1053/j.gastro.2014.07.056. [DOI] [PubMed] [Google Scholar]
- 13.Schreuder TC, Verwer BJ, van Nieuwkerk CM, Mulder CJ. Nonalcoholic fatty liver disease: an overview of current insights in pathogenesis, diagnosis and treatment. World J Gastroenterol. 2008;14:2474–2486. doi: 10.3748/wjg.14.2474. [DOI] [PMC free article] [PubMed] [Google Scholar]
- 14.Arulanandan A, Ang B, Bettencourt R, Hooker J, Behling C, Lin GY, Valasek MA, Ix JH, Schnabl B, Sirlin CB, et al. Association Between Quantity of Liver Fat and Cardiovascular Risk in Patients With Nonalcoholic Fatty Liver Disease Independent of Nonalcoholic Steatohepatitis. Clin Gastroenterol Hepatol. 2015;13:1513–20.e1. doi: 10.1016/j.cgh.2015.01.027. [DOI] [PubMed] [Google Scholar]
- 15.Marzuillo P, Grandone A, Perrone L, Miraglia Del Giudice E. Understanding the pathophysiological mechanisms in the pediatric non-alcoholic fatty liver disease: The role of genetics. World J Hepatol. 2015;7:1439–1443. doi: 10.4254/wjh.v7.i11.1439. [DOI] [PMC free article] [PubMed] [Google Scholar]
- 16.Lackner C, Gogg-Kamerer M, Zatloukal K, Stumptner C, Brunt EM, Denk H. Ballooned hepatocytes in steatohepatitis: the value of keratin immunohistochemistry for diagnosis. J Hepatol. 2008;48:821–828. doi: 10.1016/j.jhep.2008.01.026. [DOI] [PubMed] [Google Scholar]
- 17.Willebrords J, Pereira IV, Maes M, Crespo Yanguas S, Colle I, Van Den Bossche B, Da Silva TC, de Oliveira CP, Andraus W, Alves VA, et al. Strategies, models and biomarkers in experimental non-alcoholic fatty liver disease research. Prog Lipid Res. 2015;59:106–125. doi: 10.1016/j.plipres.2015.05.002. [DOI] [PMC free article] [PubMed] [Google Scholar]
- 18.Pellicoro A, Ramachandran P, Iredale JP, Fallowfield JA. Liver fibrosis and repair: immune regulation of wound healing in a solid organ. Nat Rev Immunol. 2014;14:181–194. doi: 10.1038/nri3623. [DOI] [PubMed] [Google Scholar]
- 19.Angulo P, Hui JM, Marchesini G, Bugianesi E, George J, Farrell GC, Enders F, Saksena S, Burt AD, Bida JP, et al. The NAFLD fibrosis score: a noninvasive system that identifies liver fibrosis in patients with NAFLD. Hepatology. 2007;45:846–854. doi: 10.1002/hep.21496. [DOI] [PubMed] [Google Scholar]
- 20.Musso G, Gambino R, Cassader M, Pagano G. Meta-analysis: natural history of non-alcoholic fatty liver disease (NAFLD) and diagnostic accuracy of non-invasive tests for liver disease severity. Ann Med. 2011;43:617–649. doi: 10.3109/07853890.2010.518623. [DOI] [PubMed] [Google Scholar]
- 21.Sumida Y, Nakajima A, Itoh Y. Limitations of liver biopsy and non-invasive diagnostic tests for the diagnosis of nonalcoholic fatty liver disease/nonalcoholic steatohepatitis. World J Gastroenterol. 2014;20:475–485. doi: 10.3748/wjg.v20.i2.475. [DOI] [PMC free article] [PubMed] [Google Scholar]
- 22.Stål P. Liver fibrosis in non-alcoholic fatty liver disease - diagnostic challenge with prognostic significance. World J Gastroenterol. 2015;21:11077–11087. doi: 10.3748/wjg.v21.i39.11077. [DOI] [PMC free article] [PubMed] [Google Scholar]
- 23.Ballestri S, Nascimbeni F, Romagnoli D, Lonardo A. The independent predictors of non-alcoholic steatohepatitis and its individual histological features.: Insulin resistance, serum uric acid, metabolic syndrome, alanine aminotransferase and serum total cholesterol are a clue to pathogenesis and candidate targets for treatment. Hepatol Res. 2016;46:1074–1087. doi: 10.1111/hepr.12656. [DOI] [PubMed] [Google Scholar]
- 24.Fargion S, Porzio M, Fracanzani AL. Nonalcoholic fatty liver disease and vascular disease: state-of-the-art. World J Gastroenterol. 2014;20:13306–13324. doi: 10.3748/wjg.v20.i37.13306. [DOI] [PMC free article] [PubMed] [Google Scholar]
- 25.Marzuillo P, Grandone A, Perrone L, Miraglia Del Giudice E. Controversy in the diagnosis of pediatric non-alcoholic fatty liver disease. World J Gastroenterol. 2015;21:6444–6450. doi: 10.3748/wjg.v21.i21.6444. [DOI] [PMC free article] [PubMed] [Google Scholar]
- 26.Chen CL, Cheng YF, Yu CY, Ou HY, Tsang LL, Huang TL, Chen TY, Concejero A, Wang CC, Wang SH, et al. Living donor liver transplantation: the Asian perspective. Transplantation. 2014;97 Suppl 8:S3. doi: 10.1097/TP.0000000000000060. [DOI] [PubMed] [Google Scholar]
- 27.Singh D, Das CJ, Baruah MP. Imaging of non alcoholic fatty liver disease: A road less travelled. Indian J Endocrinol Metab. 2013;17:990–995. doi: 10.4103/2230-8210.122606. [DOI] [PMC free article] [PubMed] [Google Scholar]
- 28.Obika M, Noguchi H. Diagnosis and evaluation of nonalcoholic fatty liver disease. Exp Diabetes Res. 2012;2012:145754. doi: 10.1155/2012/145754. [DOI] [PMC free article] [PubMed] [Google Scholar]
- 29.Lee SS, Park SH. Radiologic evaluation of nonalcoholic fatty liver disease. World J Gastroenterol. 2014;20:7392–7402. doi: 10.3748/wjg.v20.i23.7392. [DOI] [PMC free article] [PubMed] [Google Scholar]
- 30.Shannon A, Alkhouri N, Carter-Kent C, Monti L, Devito R, Lopez R, Feldstein AE, Nobili V. Ultrasonographic quantitative estimation of hepatic steatosis in children With NAFLD. J Pediatr Gastroenterol Nutr. 2011;53:190–195. doi: 10.1097/MPG.0b013e31821b4b61. [DOI] [PMC free article] [PubMed] [Google Scholar]
- 31.Fitzpatrick E, Dhawan A. Noninvasive biomarkers in non-alcoholic fatty liver disease: current status and a glimpse of the future. World J Gastroenterol. 2014;20:10851–10863. doi: 10.3748/wjg.v20.i31.10851. [DOI] [PMC free article] [PubMed] [Google Scholar]
- 32.Charatcharoenwitthaya P, Lindor KD. Role of radiologic modalities in the management of non-alcoholic steatohepatitis. Clin Liver Dis. 2007;11:37–54, viii. doi: 10.1016/j.cld.2007.02.014. [DOI] [PubMed] [Google Scholar]
- 33.Barr RG, Ferraioli G, Palmeri ML, Goodman ZD, Garcia-Tsao G, Rubin J, Garra B, Myers RP, Wilson SR, Rubens D, et al. Elastography Assessment of Liver Fibrosis: Society of Radiologists in Ultrasound Consensus Conference Statement. Ultrasound Q. 2016;32:94–107. doi: 10.1097/RUQ.0000000000000209. [DOI] [PubMed] [Google Scholar]
- 34.Barr RG, Ferraioli G, Palmeri ML, Goodman ZD, Garcia-Tsao G, Rubin J, Garra B, Myers RP, Wilson SR, Rubens D, et al. Elastography Assessment of Liver Fibrosis: Society of Radiologists in Ultrasound Consensus Conference Statement. Radiology. 2015;276:845–861. doi: 10.1148/radiol.2015150619. [DOI] [PubMed] [Google Scholar]
- 35.Lin SC, Heba E, Wolfson T, Ang B, Gamst A, Han A, Erdman JW Jr, O’Brien WD Jr, Andre MP, Sirlin CB, Loomba R. Noninvasive Diagnosis of Nonalcoholic Fatty Liver Disease and Quantification of Liver Fat Using a New Quantitative Ultrasound Technique. Clin Gastroenterol Hepatol. 2015;13:1337–1345.e6. doi: 10.1016/j.cgh.2014.11.027. [DOI] [PMC free article] [PubMed] [Google Scholar]
- 36.Paige JS, Bernstein GS, Heba E, Costa EAC, Fereirra M, Wolfson T, Gamst AC, Valasek MA, Lin GY, Han A, et al. A Pilot Comparative Study of Quantitative Ultrasound, Conventional Ultrasound, and MRI for Predicting Histology-Determined Steatosis Grade in Adult Nonalcoholic Fatty Liver Disease. AJR Am J Roentgenol. 2017;208:W168–W177. doi: 10.2214/AJR.16.16726. [DOI] [PMC free article] [PubMed] [Google Scholar]
- 37.Singh S, Venkatesh SK, Loomba R, Wang Z, Sirlin C, Chen J, Yin M, Miller FH, Low RN, Hassanein T, et al. Magnetic resonance elastography for staging liver fibrosis in non-alcoholic fatty liver disease: a diagnostic accuracy systematic review and individual participant data pooled analysis. Eur Radiol. 2016;26:1431–1440. doi: 10.1007/s00330-015-3949-z. [DOI] [PMC free article] [PubMed] [Google Scholar]
- 38.Park SH, Kim PN, Kim KW, Lee SW, Yoon SE, Park SW, Ha HK, Lee MG, Hwang S, Lee SG, et al. Macrovesicular hepatic steatosis in living liver donors: use of CT for quantitative and qualitative assessment. Radiology. 2006;239:105–112. doi: 10.1148/radiol.2391050361. [DOI] [PubMed] [Google Scholar]
- 39.Huber A, Ebner L, Heverhagen JT, Christe A. State-of-the-art imaging of liver fibrosis and cirrhosis: A comprehensive review of current applications and future perspectives. Eur J Radiol Open. 2015;2:90–100. doi: 10.1016/j.ejro.2015.05.002. [DOI] [PMC free article] [PubMed] [Google Scholar]
- 40.Lee SS, Park SH, Kim HJ, Kim SY, Kim MY, Kim DY, Suh DJ, Kim KM, Bae MH, Lee JY, et al. Non-invasive assessment of hepatic steatosis: prospective comparison of the accuracy of imaging examinations. J Hepatol. 2010;52:579–585. doi: 10.1016/j.jhep.2010.01.008. [DOI] [PubMed] [Google Scholar]
- 41.van Werven JR, Marsman HA, Nederveen AJ, Smits NJ, ten Kate FJ, van Gulik TM, Stoker J. Assessment of hepatic steatosis in patients undergoing liver resection: comparison of US, CT, T1-weighted dual-echo MR imaging, and point-resolved 1H MR spectroscopy. Radiology. 2010;256:159–168. doi: 10.1148/radiol.10091790. [DOI] [PubMed] [Google Scholar]
- 42.Imajo K, Kessoku T, Honda Y, Tomeno W, Ogawa Y, Mawatari H, Fujita K, Yoneda M, Taguri M, Hyogo H, et al. Magnetic Resonance Imaging More Accurately Classifies Steatosis and Fibrosis in Patients With Nonalcoholic Fatty Liver Disease Than Transient Elastography. Gastroenterology. 2016;150:626–637.e7. doi: 10.1053/j.gastro.2015.11.048. [DOI] [PubMed] [Google Scholar]
- 43.Wong VW, Vergniol J, Wong GL, Foucher J, Chan HL, Le Bail B, Choi PC, Kowo M, Chan AW, Merrouche W, et al. Diagnosis of fibrosis and cirrhosis using liver stiffness measurement in nonalcoholic fatty liver disease. Hepatology. 2010;51:454–462. doi: 10.1002/hep.23312. [DOI] [PubMed] [Google Scholar]
- 44.Yoneda M, Suzuki K, Kato S, Fujita K, Nozaki Y, Hosono K, Saito S, Nakajima A. Nonalcoholic fatty liver disease: US-based acoustic radiation force impulse elastography. Radiology. 2010;256:640–647. doi: 10.1148/radiol.10091662. [DOI] [PubMed] [Google Scholar]
- 45.Kim BH, Lee JM, Lee YJ, Lee KB, Suh KS, Han JK, Choi BI. MR elastography for noninvasive assessment of hepatic fibrosis: experience from a tertiary center in Asia. J Magn Reson Imaging. 2011;34:1110–1116. doi: 10.1002/jmri.22723. [DOI] [PubMed] [Google Scholar]
- 46.Chen J, Talwalkar JA, Yin M, Glaser KJ, Sanderson SO, Ehman RL. Early detection of nonalcoholic steatohepatitis in patients with nonalcoholic fatty liver disease by using MR elastography. Radiology. 2011;259:749–756. doi: 10.1148/radiol.11101942. [DOI] [PMC free article] [PubMed] [Google Scholar]
- 47.Foucher J, Chanteloup E, Vergniol J, Castéra L, Le Bail B, Adhoute X, Bertet J, Couzigou P, de Lédinghen V. Diagnosis of cirrhosis by transient elastography (FibroScan): a prospective study. Gut. 2006;55:403–408. doi: 10.1136/gut.2005.069153. [DOI] [PMC free article] [PubMed] [Google Scholar]
- 48.Friedrich-Rust M, Wunder K, Kriener S, Sotoudeh F, Richter S, Bojunga J, Herrmann E, Poynard T, Dietrich CF, Vermehren J, et al. Liver fibrosis in viral hepatitis: noninvasive assessment with acoustic radiation force impulse imaging versus transient elastography. Radiology. 2009;252:595–604. doi: 10.1148/radiol.2523081928. [DOI] [PubMed] [Google Scholar]
- 49.Dyson JK, McPherson S, Anstee QM. Republished: Non-alcoholic fatty liver disease: non-invasive investigation and risk stratification. Postgrad Med J. 2014;90:254–266. doi: 10.1136/postgradmedj-2013-201620rep. [DOI] [PubMed] [Google Scholar]
- 50.Chan WK, Nik Mustapha NR, Mahadeva S. Controlled attenuation parameter for the detection and quantification of hepatic steatosis in nonalcoholic fatty liver disease. J Gastroenterol Hepatol. 2014;29:1470–1476. doi: 10.1111/jgh.12557. [DOI] [PubMed] [Google Scholar]
- 51.Lee HW, Park SY, Kim SU, Jang JY, Park H, Kim JK, Lee CK, Chon YE, Han KH. Discrimination of Nonalcoholic Steatohepatitis Using Transient Elastography in Patients with Nonalcoholic Fatty Liver Disease. PLoS One. 2016;11:e0157358. doi: 10.1371/journal.pone.0157358. [DOI] [PMC free article] [PubMed] [Google Scholar]
- 52.Bercoff J, Tanter M, Fink M. Supersonic shear imaging: a new technique for soft tissue elasticity mapping. IEEE Trans Ultrason Ferroelectr Freq Control. 2004;51:396–409. doi: 10.1109/tuffc.2004.1295425. [DOI] [PubMed] [Google Scholar]
- 53.Bota S, Sporea I, Peck-Radosavljevic M, Sirli R, Tanaka H, Iijima H, Saito H, Ebinuma H, Lupsor M, Badea R, et al. The influence of aminotransferase levels on liver stiffness assessed by Acoustic Radiation Force Impulse Elastography: a retrospective multicentre study. Dig Liver Dis. 2013;45:762–768. doi: 10.1016/j.dld.2013.02.008. [DOI] [PubMed] [Google Scholar]
- 54.Kramer H, Pickhardt PJ, Kliewer MA, Hernando D, Chen GH, Zagzebski JA, Reeder SB. Accuracy of Liver Fat Quantification With Advanced CT, MRI, and Ultrasound Techniques: Prospective Comparison With MR Spectroscopy. AJR Am J Roentgenol. 2017;208:92–100. doi: 10.2214/AJR.16.16565. [DOI] [PMC free article] [PubMed] [Google Scholar]
- 55.Deffieux T, Gennisson JL, Bousquet L, Corouge M, Cosconea S, Amroun D, Tripon S, Terris B, Mallet V, Sogni P, et al. Investigating liver stiffness and viscosity for fibrosis, steatosis and activity staging using shear wave elastography. J Hepatol. 2015;62:317–324. doi: 10.1016/j.jhep.2014.09.020. [DOI] [PubMed] [Google Scholar]
- 56.Sporea I, Şirli R, Popescu A, Bota S, Badea R, Lupşor M, Focşa M, Dănilă M. Is it better to use two elastographic methods for liver fibrosis assessment? World J Gastroenterol. 2011;17:3824–3829. doi: 10.3748/wjg.v17.i33.3824. [DOI] [PMC free article] [PubMed] [Google Scholar]
- 57.Papagianni M, Sofogianni A, Tziomalos K. Non-invasive methods for the diagnosis of nonalcoholic fatty liver disease. World J Hepatol. 2015;7:638–648. doi: 10.4254/wjh.v7.i4.638. [DOI] [PMC free article] [PubMed] [Google Scholar]
- 58.Alberti KG, Eckel RH, Grundy SM, Zimmet PZ, Cleeman JI, Donato KA, Fruchart JC, James WP, Loria CM, Smith SC Jr; International Diabetes Federation Task Force on Epidemiology and Prevention; Hational Heart, Lung, and Blood Institute; American Heart Association; World Heart Federation; International Atherosclerosis Society; International Association for the Study of Obesity. Harmonizing the metabolic syndrome: a joint interim statement of the International Diabetes Federation Task Force on Epidemiology and Prevention; National Heart, Lung, and Blood Institute; American Heart Association; World Heart Federation; International Atherosclerosis Society; and International Association for the Study of Obesity. Circulation. 2009;120:1640–1645. doi: 10.1161/CIRCULATIONAHA.109.192644. [DOI] [PubMed] [Google Scholar]
- 59.Kodama Y, Ng CS, Wu TT, Ayers GD, Curley SA, Abdalla EK, Vauthey JN, Charnsangavej C. Comparison of CT methods for determining the fat content of the liver. AJR Am J Roentgenol. 2007;188:1307–1312. doi: 10.2214/AJR.06.0992. [DOI] [PubMed] [Google Scholar]
- 60.Pickhardt PJ, Hahn L, Muñoz del Rio A, Park SH, Reeder SB, Said A. Natural history of hepatic steatosis: observed outcomes for subsequent liver and cardiovascular complications. AJR Am J Roentgenol. 2014;202:752–758. doi: 10.2214/AJR.13.11367. [DOI] [PubMed] [Google Scholar]
- 61.Hahn L, Reeder SB, Muñoz del Rio A, Pickhardt PJ. Longitudinal Changes in Liver Fat Content in Asymptomatic Adults: Hepatic Attenuation on Unenhanced CT as an Imaging Biomarker for Steatosis. AJR Am J Roentgenol. 2015;205:1167–1172. doi: 10.2214/AJR.15.14724. [DOI] [PMC free article] [PubMed] [Google Scholar]
- 62.Park YS, Park SH, Lee SS, Kim DY, Shin YM, Lee W, Lee SG, Yu ES. Biopsy-proven nonsteatotic liver in adults: estimation of reference range for difference in attenuation between the liver and the spleen at nonenhanced CT. Radiology. 2011;258:760–766. doi: 10.1148/radiol.10101233. [DOI] [PubMed] [Google Scholar]
- 63.Qayyum A, Goh JS, Kakar S, Yeh BM, Merriman RB, Coakley FV. Accuracy of liver fat quantification at MR imaging: comparison of out-of-phase gradient-echo and fat-saturated fast spin-echo techniques--initial experience. Radiology. 2005;237:507–511. doi: 10.1148/radiol.2372040539. [DOI] [PubMed] [Google Scholar]
- 64.Fritz GA, Schoellnast H, Deutschmann HA, Wiltgen M, Brader P, Berghold A, Groell R. Density histogram analysis of unenhanced hepatic computed tomography in patients with diffuse liver diseases. J Comput Assist Tomogr. 2006;30:201–205. doi: 10.1097/00004728-200603000-00006. [DOI] [PubMed] [Google Scholar]
- 65.Doppman JL, Cornblath M, Dwyer AJ, Adams AJ, Girton ME, Sidbury J. Computed tomography of the liver and kidneys in glycogen storage disease. J Comput Assist Tomogr. 1982;6:67–71. doi: 10.1097/00004728-198202000-00009. [DOI] [PubMed] [Google Scholar]
- 66.Mendonça PR, Lamb P, Kriston A, Sasaki K, Kudo M, Sahani DV. Contrast-independent liver-fat quantification from spectral CT exams. Med Image Comput Comput Assist Interv. 2013;16:324–331. doi: 10.1007/978-3-642-40811-3_41. [DOI] [PubMed] [Google Scholar]
- 67.Bohte AE, van Werven JR, Bipat S, Stoker J. The diagnostic accuracy of US, CT, MRI and 1H-MRS for the evaluation of hepatic steatosis compared with liver biopsy: a meta-analysis. Eur Radiol. 2011;21:87–97. doi: 10.1007/s00330-010-1905-5. [DOI] [PMC free article] [PubMed] [Google Scholar]
- 68.Rofsky NM, Fleishaker H. CT and MRI of diffuse liver disease. Semin Ultrasound CT MR. 1995;16:16–33. doi: 10.1016/0887-2171(95)90012-8. [DOI] [PubMed] [Google Scholar]
- 69.Kinner S, Reeder SB, Yokoo T. Quantitative Imaging Biomarkers of NAFLD. Dig Dis Sci. 2016;61:1337–1347. doi: 10.1007/s10620-016-4037-1. [DOI] [PMC free article] [PubMed] [Google Scholar]
- 70.Lamb P, Sahani DV, Fuentes-Orrego JM, Patino M, Ghosh A, Mendonça PR. Stratification of patients with liver fibrosis using dual-energy CT. IEEE Trans Med Imaging. 2015;34:807–815. doi: 10.1109/TMI.2014.2353044. [DOI] [PubMed] [Google Scholar]
- 71.Ramalho M, Altun E, Herédia V, Zapparoli M, Semelka R. Liver MR imaging: 1.5T versus 3T. Magn Reson Imaging Clin N Am. 2007;15:321–347, vi. doi: 10.1016/j.mric.2007.06.003. [DOI] [PubMed] [Google Scholar]
- 72.Artz NS, Hines CD, Brunner ST, Agni RM, Kühn JP, Roldan-Alzate A, Chen GH, Reeder SB. Quantification of hepatic steatosis with dual-energy computed tomography: comparison with tissue reference standards and quantitative magnetic resonance imaging in the ob/ob mouse. Invest Radiol. 2012;47:603–610. doi: 10.1097/RLI.0b013e318261fad0. [DOI] [PMC free article] [PubMed] [Google Scholar]
- 73.Yokoo T, Serai SD, Pirasteh A, Bashir MR, Hamilton G, Hernando D, Hu HH, Hetterich H, Kühn JP, Kukuk GM, et al. Linearity, Bias, and Precision of Hepatic Proton Density Fat Fraction Measurements by Using MR Imaging: A Meta-Analysis. Radiology. 2018;286:486–498. doi: 10.1148/radiol.2017170550. [DOI] [PMC free article] [PubMed] [Google Scholar]
- 74.Bley TA, Wieben O, François CJ, Brittain JH, Reeder SB. Fat and water magnetic resonance imaging. J Magn Reson Imaging. 2010;31:4–18. doi: 10.1002/jmri.21895. [DOI] [PubMed] [Google Scholar]
- 75.Pilleul F, Chave G, Dumortier J, Scoazec JY, Valette PJ. Fatty infiltration of the liver. Detection and grading using dual T1 gradient echo sequences on clinical MR system. Gastroenterol Clin Biol. 2005;29:1143–1147. doi: 10.1016/s0399-8320(05)82179-7. [DOI] [PubMed] [Google Scholar]
- 76.Fischer MA, Raptis DA, Montani M, Graf R, Clavien PA, Nanz D, Alkadhi H, Scheffel H. Liver fat quantification by dual-echo MR imaging outperforms traditional histopathological analysis. Acad Radiol. 2012;19:1208–1214. doi: 10.1016/j.acra.2012.05.009. [DOI] [PubMed] [Google Scholar]
- 77.Reeder SB, Pineda AR, Wen Z, Shimakawa A, Yu H, Brittain JH, Gold GE, Beaulieu CH, Pelc NJ. Iterative decomposition of water and fat with echo asymmetry and least-squares estimation (IDEAL): application with fast spin-echo imaging. Magn Reson Med. 2005;54:636–644. doi: 10.1002/mrm.20624. [DOI] [PubMed] [Google Scholar]
- 78.Ma J. Dixon techniques for water and fat imaging. J Magn Reson Imaging. 2008;28:543–558. doi: 10.1002/jmri.21492. [DOI] [PubMed] [Google Scholar]
- 79.Dulai PS, Sirlin CB, Loomba R. MRI and MRE for non-invasive quantitative assessment of hepatic steatosis and fibrosis in NAFLD and NASH: Clinical trials to clinical practice. J Hepatol. 2016;65:1006–1016. doi: 10.1016/j.jhep.2016.06.005. [DOI] [PMC free article] [PubMed] [Google Scholar]
- 80.Yokoo T, Shiehmorteza M, Hamilton G, Wolfson T, Schroeder ME, Middleton MS, Bydder M, Gamst AC, Kono Y, Kuo A, et al. Estimation of hepatic proton-density fat fraction by using MR imaging at 3.0 T. Radiology. 2011;258:749–759. doi: 10.1148/radiol.10100659. [DOI] [PMC free article] [PubMed] [Google Scholar]
- 81.Kühn JP, Hernando D, Muñoz del Rio A, Evert M, Kannengiesser S, Völzke H, Mensel B, Puls R, Hosten N, Reeder SB. Effect of multipeak spectral modeling of fat for liver iron and fat quantification: correlation of biopsy with MR imaging results. Radiology. 2012;265:133–142. doi: 10.1148/radiol.12112520. [DOI] [PMC free article] [PubMed] [Google Scholar]
- 82.Kühn JP, Hernando D, Mensel B, Krüger PC, Ittermann T, Mayerle J, Hosten N, Reeder SB. Quantitative chemical shift-encoded MRI is an accurate method to quantify hepatic steatosis. J Magn Reson Imaging. 2014;39:1494–1501. doi: 10.1002/jmri.24289. [DOI] [PMC free article] [PubMed] [Google Scholar]
- 83.Tang A, Tan J, Sun M, Hamilton G, Bydder M, Wolfson T, Gamst AC, Middleton M, Brunt EM, Loomba R, et al. Nonalcoholic fatty liver disease: MR imaging of liver proton density fat fraction to assess hepatic steatosis. Radiology. 2013;267:422–431. doi: 10.1148/radiol.12120896. [DOI] [PMC free article] [PubMed] [Google Scholar]
- 84.Vajro P, Lenta S, Socha P, Dhawan A, McKiernan P, Baumann U, Durmaz O, Lacaille F, McLin V, Nobili V. Diagnosis of nonalcoholic fatty liver disease in children and adolescents: position paper of the ESPGHAN Hepatology Committee. J Pediatr Gastroenterol Nutr. 2012;54:700–713. doi: 10.1097/MPG.0b013e318252a13f. [DOI] [PubMed] [Google Scholar]
- 85.Clemente MG, Mandato C, Poeta M, Vajro P. Pediatric non-alcoholic fatty liver disease: Recent solutions, unresolved issues, and future research directions. World J Gastroenterol. 2016;22:8078–8093. doi: 10.3748/wjg.v22.i36.8078. [DOI] [PMC free article] [PubMed] [Google Scholar]
- 86.Cui J, Heba E, Hernandez C, Haufe W, Hooker J, Andre MP, Valasek MA, Aryafar H, Sirlin CB, Loomba R. Magnetic resonance elastography is superior to acoustic radiation force impulse for the Diagnosis of fibrosis in patients with biopsy-proven nonalcoholic fatty liver disease: A prospective study. Hepatology. 2016;63:453–461. doi: 10.1002/hep.28337. [DOI] [PMC free article] [PubMed] [Google Scholar]
- 87.Xanthakos SA, Trout AT, Dillman JR. Magnetic resonance elastography assessment of fibrosis in children with NAFLD: Promising but not perfect. Hepatology. 2017;66:1373–1376. doi: 10.1002/hep.29393. [DOI] [PMC free article] [PubMed] [Google Scholar]
- 88.Garcovich M, Veraldi S, Di Stasio E, Zocco MA, Monti L, Tomà P, Pompili M, Gasbarrini A, Nobili V. Liver Stiffness in Pediatric Patients with Fatty Liver Disease: Diagnostic Accuracy and Reproducibility of Shear-Wave Elastography. Radiology. 2017;283:820–827. doi: 10.1148/radiol.2016161002. [DOI] [PubMed] [Google Scholar]