Abstract
Somatic mutations in isocitrate dehydrogenase 2 (IDH2) contribute to the pathogenesis of acute myeloid leukemia (AML) through production of the oncometabolite 2-hydroxyglutarate (2HG)1–8. Enasidenib (AG-221) is an allosteric inhibitor that binds to the IDH2 dimer interface and blocks 2HG production by IDH2 mutants9,10. In a phase I/II clinical trial, enasidenib inhibited 2HG production and induced clinical responses in relapsed/refractory IDH2-mutant AML11. Here we describe two patients with IDH2-mutant AML who had a clinical response to enasidenib followed by clinical resistance, disease progression, and recurrent elevation in circulating 2HG. We found that therapeutic resistance was associated with the emergence of second-site IDH2 mutations in trans, such that resistance mutations occurred in the IDH2 allele without the neomorphic R140Q mutation. The in trans mutations occurred at glutamine 316 (Q316E) and isoleucine 319 (I319M), which are at the interface where enasidenib binds the IDH2 dimer. Expression of these mutant disease alleles alone did not induce 2HG production, however expression of Q316E and I319M mutations in concert with IDH2 R140Q in trans allowed for 2HG production that was resistant to inhibition by enasidenib. Biochemical studies predicted that resistance to allosteric IDH inhibitors could also occur via IDH dimer-interface mutations in cis, which was confirmed in a patient with acquired resistance to the IDH1 inhibitor ivosidenib (AG-120). Our observations elucidate a novel mechanism of acquired resistance to a targeted therapy and underscore the importance of 2HG production to the pathogenesis of IDH-mutant malignancies.
Keywords: AG-120, AG-221, cancer metabolism, enasidenib, epigenetic, glioma, IDH1, IDH2, ivosidenib, leukemia, metabolite
Main
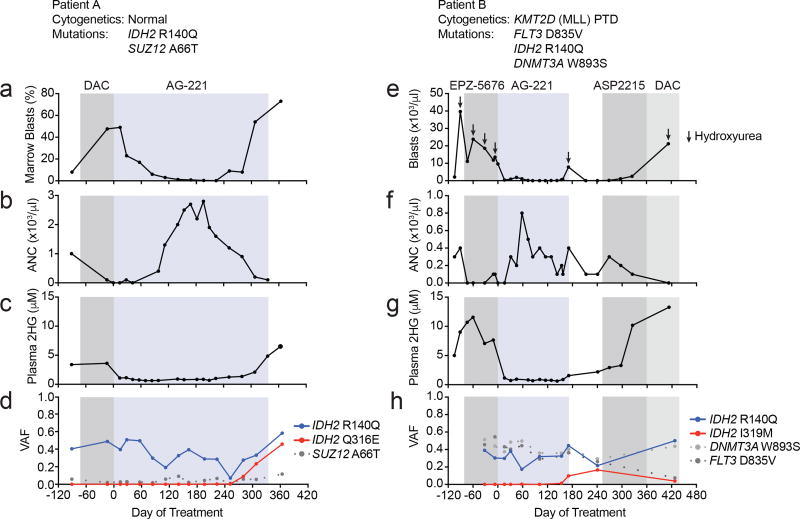
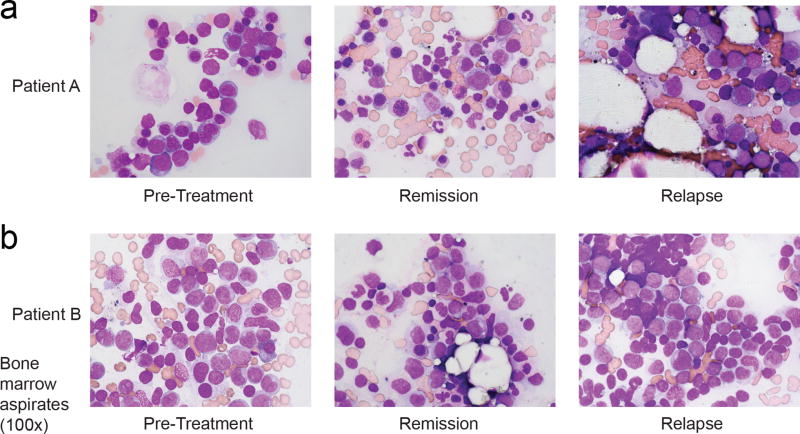
We investigated two patients with IDH2-mutant AML who developed acquired resistance to enasidenib, hypothesizing that we could identify molecular mechanisms of resistance to small molecule IDH inhibition. The first AML patient relapsed after induction with daunorubicin and cytarabine and was refractory to subsequent decitabine as evidenced by an increasing blast count and progressive neutropenia (Fig. 1a, b). The plasma 2HG concentration was elevated at 3.6 µM (Fig. 1c). Next-generation sequencing of bone marrow cells aspirated demonstrated a clonal IDH2 R140Q mutation (Fig. 1d). Enasidenib therapy led to a decline in leukemic blasts in the bone marrow (Fig. 1a and Extended Data Figure 1a), a reduction in plasma 2HG concentration to <1 µM (Fig. 1c), and normalization of the absolute neutrophil count (Fig. 1b). The variant allele frequency (VAF) for IDH2 R140Q remained in the 20–50% range (Fig. 1d), consistent with the observation that enasidenib promotes differentiation of IDH2-mutant blasts8,11,12. After 9 months of therapy the patient developed recurrent neutropenia and reappearance of leukemic blasts consistent with disease progression (Fig. 1a, b and Extended Data Fig. 1a). Importantly, the plasma 2HG concentration had increased despite continuous treatment with enasidenib (Fig. 1c).
Figure 1. Acquired resistance to the mutant IDH2 inhibitor enasidenib (AG-221) associated with emergence of second-site mutations in IDH2.
(a–d) Clinical, laboratory, and pathologic features for Patient A in relation to enasidenib (AG-221) treatment (blue box) and decitabine (DAC; gray box), including bone marrow blast percentage (a), blood absolute neutrophil count (ANC; b), plasma 2HG concentration (c), and variant allele frequency (VAF) for mutations identified by targeted next-generation sequencing of bone marrow cells (d). (e–h) Clinical, laboratory, and pathologic features for Patient B in relation to enasidenib (AG-221) treatment (blue box) and other treatments (gray boxes), including blood absolute blast count (e), blood ANC (f), plasma 2HG concentration (g), and VAF for mutations identified by targeted next-generation sequencing of bone marrow cells (h). Also see Extended Data Figure 1.
The second patient presented with relapsed/refractory AML that was refractory to cytarabine-based induction chemotherapy and subsequent therapy with an investigational DOT1L inhibitor (Fig. 1e). The patient had an elevated blast count, neutropenia, and an increased plasma 2HG concentration of >5 µM (Fig. 1e–g and Extended Data Fig. 1b). Next-generation sequencing of bone marrow cells demonstrated the presence of an IDH2 R140Q mutation (Fig. 1h). Enasidenib therapy induced a significant reduction in the peripheral blast count, an increase in the absolute neutrophil count, and a decrease in the plasma 2HG concentration to <1 µM (Fig. 1e–g and Extended Data Fig. 1b). The VAF for IDH2 R140Q remained in the 15–40% range (Fig. 1h). After 6 months of continuous treatment with enasidenib, the patient developed progressive disease with a rise in leukemic blasts (Fig. 1e and Extended Data Fig. 1b) and increased plasma 2HG (Fig. 1g).
We hypothesized that clinical resistance to enasidenib in the setting of a progressive increase in 2HG levels might be due to acquisition of a new somatic mutation that mediates drug resistance. In both cases, we identified new mutations in the IDH2 gene at the time of acquired resistance, missense mutations in IDH2 that resulted in a substitution of glutamine 316 with glutamate (Q316E) in the first patient and substitution of isoleucine 319 with methionine (I319M) in the second patient (Fig. 1d, h). Droplet digital PCR (ddPCR) (Extended Data Table 1) demonstrated the secondary IDH2 mutations were not detectable prior to treatment with enasidenib. Thus, the IDH2 Q316E and I319M mutations were either acquired during the course of treatment or the mutations originated in a rare subclone that was below the limit of detection of the ddPCR assay.
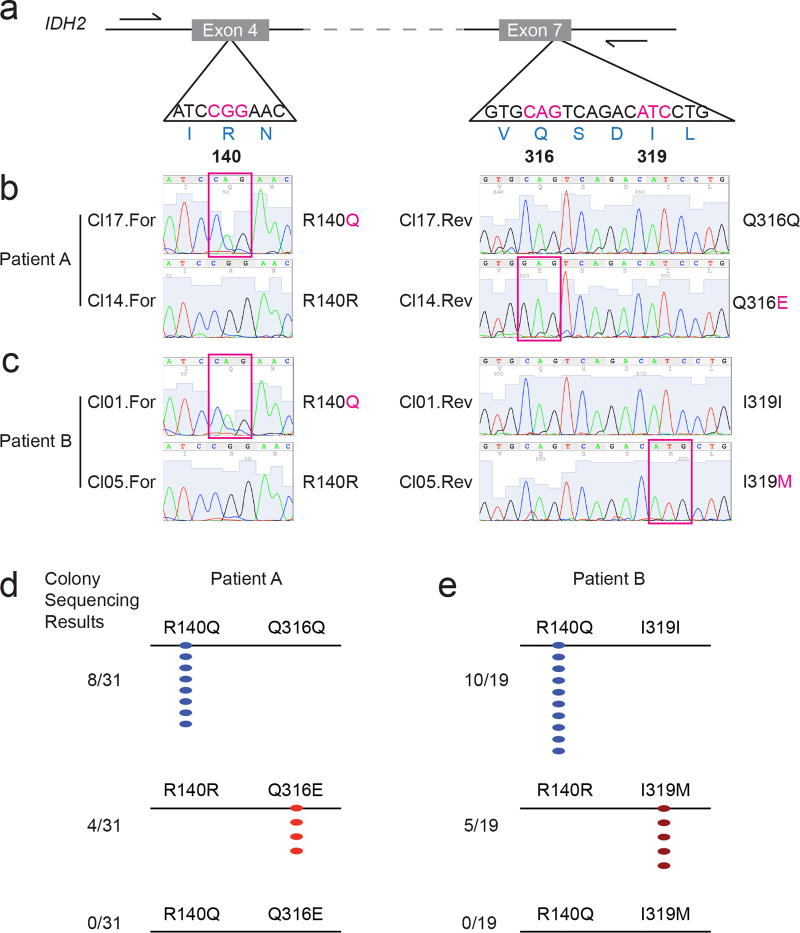
The identification of second-site mutations in IDH2 in the setting of acquired resistance to enasidenib therapy raised the possibility of a resistance mechanism similar to those previously reported for BCR-ABL, EGFR, and other tyrosine kinases13–16. The Q316E and I319M mutations are located in Exon 7 of the IDH2 gene, whereas the neomorphic R140Q mutation is located upstream in Exon 4 (Fig. 2a). To determine the allelic conformation of the different IDH2 mutations, we performed long-range PCR amplification of genomic DNA spanning Exon 4–7 of IDH2 followed by subcloning and sequence analysis of individual clones (Fig. 2a, b, c). In the first patient, all clones with the R140Q mutation were wildtype at position Q316 (i.e. Q316Q) (Fig. 2b, d), whereas all clones with the Q316E mutation were wildtype for R140 (i.e. R140R) (Fig. 2b, d). We observed analogous results for the second patient, such that the I319M and R140Q were observed exclusively in different clones (Fig. 2c, e). These data demonstrate that acquired resistance to enasidenib was associated with emergence of second-site mutations in trans on the IDH2 allele without the neomorphic R140Q mutation.
Figure 2. Second-site mutations in IDH2 occur on the allele without the neomorphic R140Q mutation.
(a) Schematic of the IDH2 locus (ENSG00000182054|CCDS10359), highlighting the nucleotides encoding arginine 140 (R140), glutamine 316 (Q316), and isoleucine 319 (I319). Positions of sequencing primers are indicated by half-arrows. (b, c) Examples of Sanger sequencing in the forward (‘For’) and reverse (‘Rev’) direction from two clones (‘Cl’) for Patient A (b) and Patient B (c). Magenta boxes highlight the somatic mutations. (d, e) Summary of Sanger sequencing results for Patient A (d) and Patient B (e), demonstrating that the R140Q mutations and the Q316E (d) or I319M (e) mutations do not occur on the same allele.
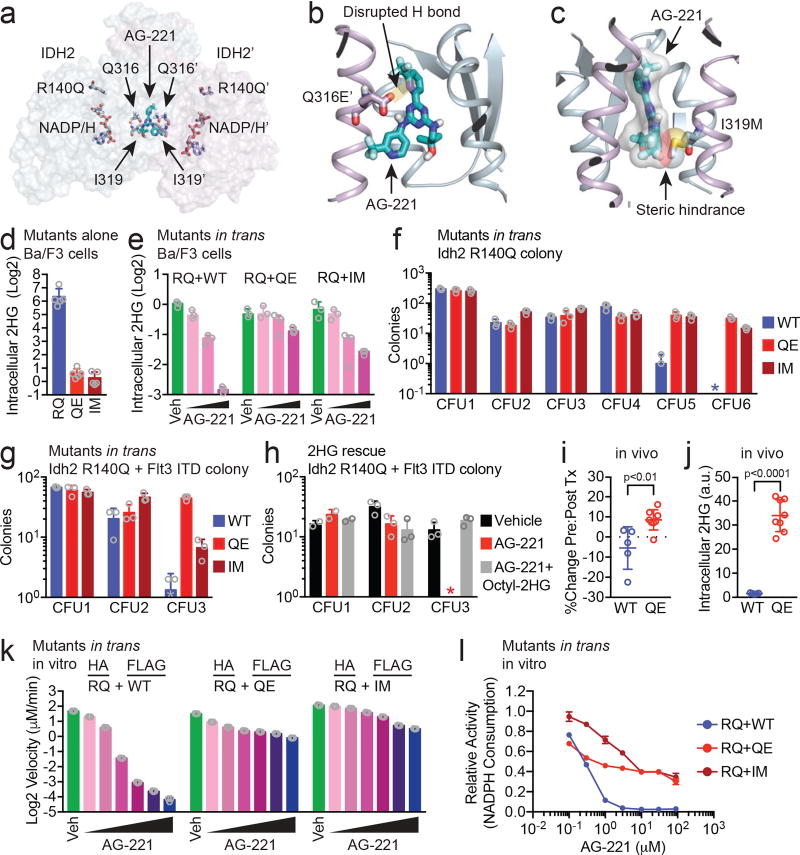
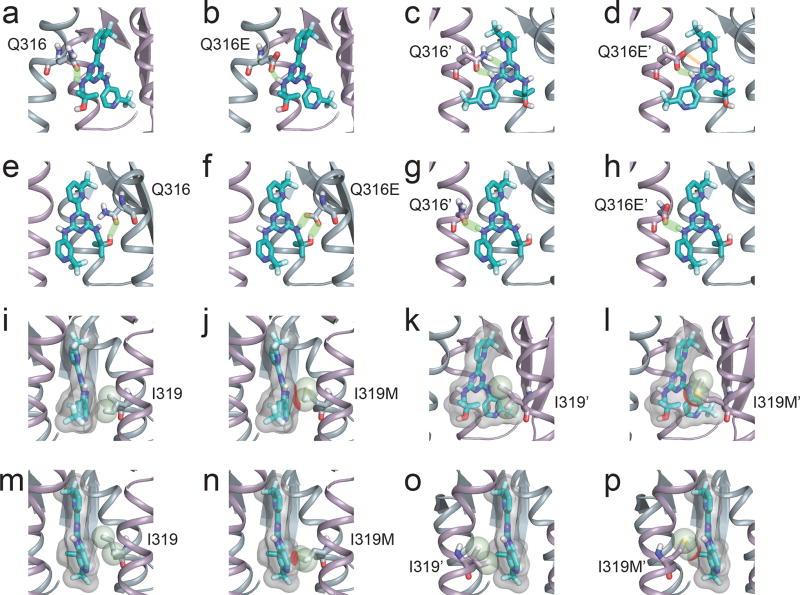
To investigate the potential significance of the Q316E and I319M mutations in IDH2, we mapped the mutations at Q316 and I319 to the recently published structure of an IDH2 dimer bound by enasidenib (Fig. 3a; PDB ID 5I96)9. Q316 and I319 are located in the IDH2 dimer interface and are key residues that interact with enasidenib9 (Extended Data Fig. 2). Structural modeling predicted that the Q316E mutation disrupts hydrogen bonding with enasidenib (Fig. 3b), while the I319M mutation creates steric hindrance that would impede binding of enasidenib (Fig. 3c). Even though the dimer interface is symmetrical and enasidenib is not, identical residues on either side of the interface can make different, but important, interactions with the drug (Fig. 3a and Extended Data Fig. 2), allowing second-site mutations at the interface to function in trans (and potentially also in cis, see below).
Figure 3. Second-site mutations in IDH2 confer resistance to enasidenib in trans.
(a) Structure of the IDH2 dimer highlighting the binding pocket for enasidenib (AG-221; teal) at the dimer interface and the amino acids affected by second-site resistance mutations (Q316, I319; modeled from PDB ID 5I969, see Methods). Second-site mutations are structurally distant from the catalytic active site containing the neomorphic R140Q mutation and NADP/H cofactor. (b) Detailed view of the Q316E’ mutation showing loss of a hydrogen bond (H bond) that normally forms between the amino side chain of Q316’ and a nitrogen in the diaminotriazine ring of AG-221. (c) Detailed view of the I319M mutation demonstrating steric effects from the bulky side chain of methionine predicted to hinder binding by AG-221. (d) Intracellular 2HG levels in Ba/F3 cells that express IDH2 R140Q (RQ), Q316E (QE) or I319M (IM) via retroviral transduction. Values are relative to untransduced parental Ba/F3 cells. Data are mean ± s.e.m. for n=5 cultures. (e) Intracellular 2HG levels in Ba/F3 cells co-expressing IDH2 RQ plus IDH2 wildtype (WT), QE, or IM in trans and treated with vehicle (‘Veh’) or increasing doses of AG-221 (1, 10, or 100 nM). Data are mean ± s.e.m. for triplicate cultures. (f, g) Serial-replating of primary hematopoietic stem/progenitor cells (HSPC) from Idh2 R140Q (f) or Idh2 R140Q/Flt3 ITD (g) mice expressing IDH2 WT, QE, or IM in trans and cultured in methylcellulose containing AG-221 at 50 nM. c.f.u., colony forming unit. * indicates value of 0. Data are mean ± s.e.m. for triplicate cultures. (h) Serial-replating of primary HSPC from Idh2 R140Q/Flt3 ITD mice cultured in methylcellulose containing either vehicle, AG-221 (50 nM), or AG-221 (50 nM) plus cell-permeable 2HG (‘Octyl-2HG’; 0.5 mM). Data are mean ± s.e.m. for duplicate (CFU1) or triplicate (CFU2/3) cultures. * indicates value of 0. (i, j) Mice reconstituted with Idh2 R140Q bone marrow HSPC transduced with IDH2 WT or QE were subjected to 2 (i) or 4 (j) weeks of treatment with enasidenib (40 mg/kg twice daily) and assessed for WT or QE allele frequencies before and after treatment (i) or intracellular 2HG levels in bone marrow mononuclear cells (j). See Methods. Data are mean ± s.e.m. for n=5 WT and n=8 QE mice. p=0.008 (i) or p=4×10⁻⁷ (j) by two-tailed t-test. (k–l) In vitro enzyme assays measuring absolute velocity (k) and relative activity (l) of NADPH-dependent reduction of alpha-ketoglutarate (αKG) by HA-precipitated IDH2 dimers purified from cells co-expressing IDH2 HA-RQ + FLAG-WT, HA-RQ + FLAG-QE, or HA-RQ + FLAG-IM (see Methods). Reactions contained purified enzyme (10 µg/ml), NADPH (0.3 mM), αKG (5 mM), and AG-221 at 0.1, 0.3, 1, 3, 10, and 30 µM (k) or indicated concentrations (l). Data for (k–l) are mean ± 95% c.i. for triplicate reactions. Results are representative of ≥3 (d, e, k–l), 2 (f, g, h), or 1 (i, j) independent experiments. Also see Extended Data Figures 2–4.
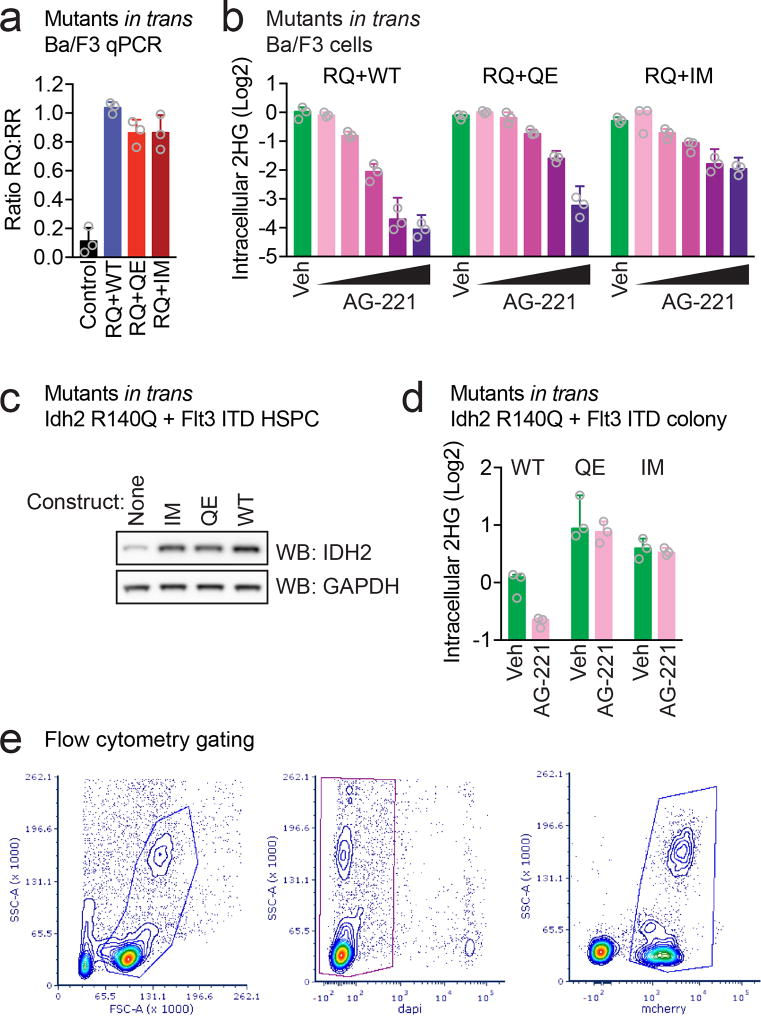
We evaluated the impact of the IDH2 Q316E and I319M mutations on IDH2 enzymatic function alone and in trans with IDH2 R140Q. Expression of IDH2 Q316E or I319M mutations in Ba/F3 hematopoietic cells did not result in increased 2HG production, in contrast to the known effect of the R140Q mutation on neomorphic IDH2 function (Fig. 3d). Enasidenib dose-dependently reduced 2HG levels in Ba/F3 cells which co-expressed IDH2 R140Q and WT in trans, consistent with inhibition of mutant IDH2 enzymatic activity as previously described (Fig. 3e and Extended Data Fig. 3a)9,11,12. By contrast, Ba/F3 cells which expressed IDH2 R140Q concurrently with either IDH2 Q316E or I319M in trans continued to produce high levels of 2HG when exposed to enasidenib (Fig. 3e and Extended Data Fig. 3a), although this could be partially inhibited by higher doses of drug (Extended Data Fig. 3b).
We next tested the impact of the IDH2 Q316E and I319M mutations on the self-renewal of primary murine hematopoietic stem/progenitor cells (HSPC) in which Idh2 R140Q is expressed from the endogenous locus17. Enasidenib inhibited the serial-replating capacity of HSPC that expressed both Idh2 R140Q and WT in trans, consistent with inhibition of mutant IDH2-induced gain of self-renewal (Fig. 3f). However, primary murine HSPC that expressed Idh2 R140Q in conjunction with Q316E or I319M in trans maintained serial replating in the presence of enasidenib (Fig. 3f). Similar findings were observed in a primary murine-derived leukemia model, in which the Idh2 R140Q mutation and the Flt3 internal tandem duplication (ITD) are expressed from their endogenous loci17 (Fig. 3g and Extended Data Fig. 3c, d). Cell-permeable 2HG exposure was sufficient to confer enasidenib-resistant serial-replating to Idh2 R140Q / Flt3 ITD-mutant HSPC (Fig. 3h), supporting the hypothesis that restored 2HG production contributes to the resistance mediated by the IDH2 Q316E and I319M mutations.
We determined the effect of expressing the IDH2 Q316E mutation in trans on response to enasidenib in vivo (Fig. 3i, j). Bone marrow HSPC expressing Idh2 R140Q were transduced with either IDH2 WT or Q316E and used to reconstitute the hematopoietic system of recipient mice. Recipient mice were treated for 2 weeks with enasidenib, and IDH2 WT and Q316E allele frequencies were assessed before and after treatment. Enasidenib treatment reduced the proportion of IDH2 R140Q:WT cells, whereas the frequency of IDH2 R140Q:Q316E cells increased despite enasidenib treatment (Fig. 3i and Extended Data Fig. 3e; p=0.008), consistent with a fitness advantage of IDH2 R140Q:Q316E mutant cells during enasidenib therapy (see Fig. 1d). Likewise, expression of the IDH2 Q316E mutation in trans conferred production of 2HG by Idh2 R140Q-mutant cells in vivo that was resistant to enasidenib treatment (Fig. 3j; p=4×10⁻⁷), consistent with the in vitro studies (Fig. 3e–g).
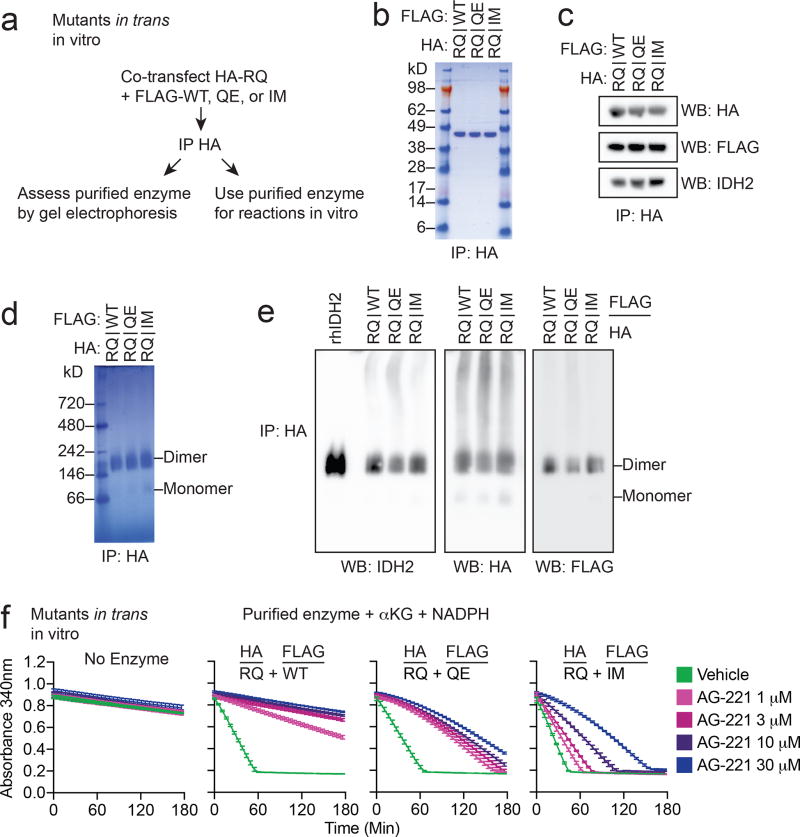
In order to rule out indirect cellular effects whereby the Q316E and I319M mutants might induce IDH2 inhibitor resistance, we purified IDH2 R140Q:WT, R140Q:Q316E, and R140Q:I319M dimers and performed in vitro enzymatic reactions (Fig. 3k, l and Extended Data Fig. 4a, b). We did not observe a difference in the ability of the Q316E and I319M mutants to form dimers compared to IDH2 WT (Extended Data Fig. 4c–e). In vitro enzymatic reactions with purified IDH2 dimers, α-ketoglutarate, and NADPH demonstrated that each complex consumed NADPH and produced 2HG at similar rates, although IDH2 R140Q:I319M dimers catalyzed the reaction somewhat faster (Fig. 3k and Extended Data Fig. 4f). The activity of purified IDH2 R140Q:WT enzyme complexes was inhibited by enasidenib in a dose-dependent manner, whereas purified R140Q:Q316E and R140Q:I319M enzyme dimers retained substantive activity in the presence of enasidenib (Fig. 3k, l and Extended Data Fig. 4f). These data demonstrate that although the IDH2 Q316E and I319M mutations do not affect wildtype IDH2 enzymatic function, they can cooperate with IDH2 R140Q in trans to maintain 2HG production and promote disease progression in the presence of enasidenib.
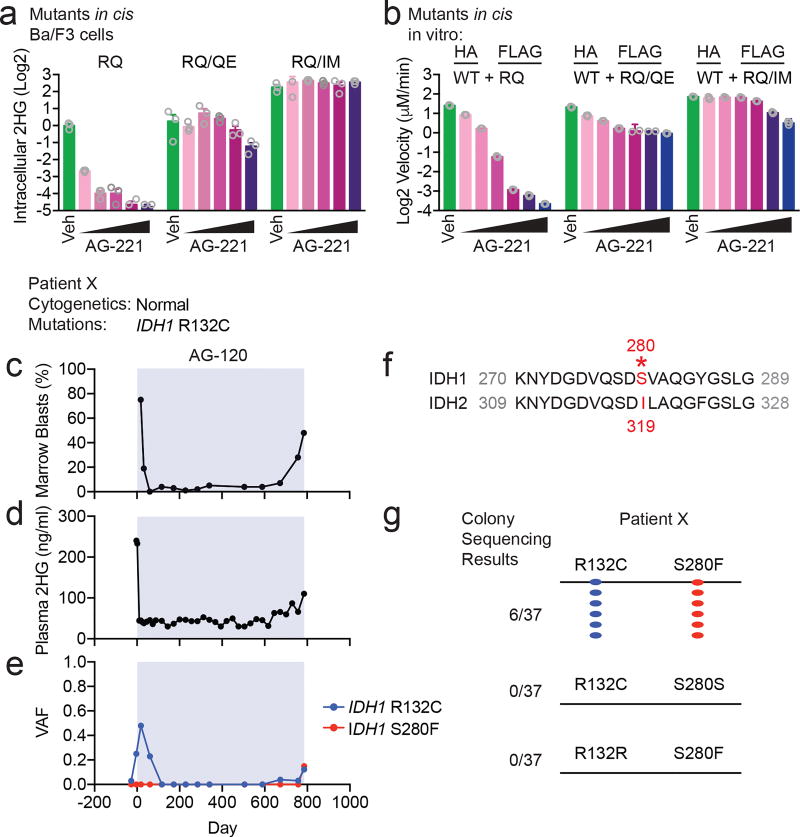
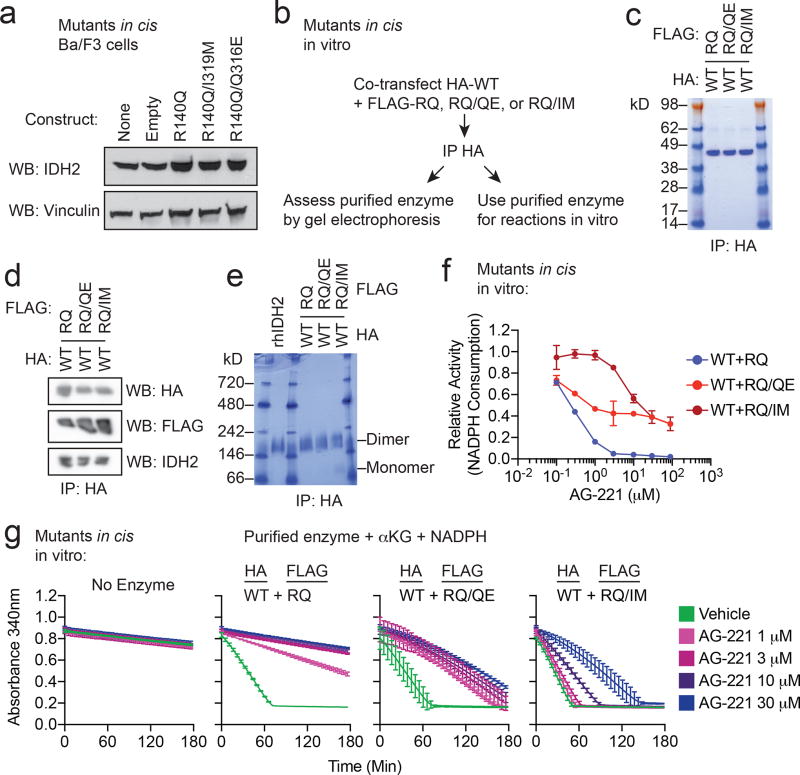
Although we observed the Q316E and I319M mutations in trans to IDH2 R140Q, it is possible that these mutations might also have the capability to induce enasidenib resistance when acquired in cis to R140Q. We therefore tested the possibility that these resistance mutations might confer resistance to enasidenib when present in the same allele as R140Q. Consistent with the effect observed in trans, expression of Q316E or I319M mutations in cis with R140Q in Ba/F3 cells (Fig. 4a and Extended Data Fig. 5a) allowed for 2HG production that was not inhibited by enasidenib. In vitro enzymatic reactions with purified IDH2 dimers comprised of WT:R140Q/Q316E and WT:R140Q/I319M demonstrated that the enzymatic activity of these complexes was resistant to enasidenib (Fig. 4b and Extended Data Fig. 5b–g).
Figure 4. Second-site mutations in cis can confer resistance to IDH inhibitors.
(a) Intracellular 2HG levels in Ba/F3 cells transduced with IDH2 R140Q (RQ), in cis double-mutant IDH2 R140Q/Q316E (RQ/QE) or in cis double-mutant IDH2 R140Q/I319M (RQ/IM) and treated with vehicle (‘Veh’) or increasing doses of AG-221 (10, 50, 100, 500, or 1000 nM). Data are mean ± s.e.m. for triplicate cultures. (b) In vitro enzyme assays measuring absolute velocity of NADPH-dependent reduction of alpha-ketoglutarate (αKG) by HA-precipitated IDH2 WT dimerized with RQ alone or RQ plus in cis second-site mutations (RQ/QE or RQ/IM). See Extended Data Fig. 5. Reactions contained purified enzyme (7.5 µg/ml), NADPH (0.3 mM), αKG (5 mM), and vehicle (‘Veh’) or increasing doses of AG-221 (0.1, 0.3, 1, 3, 10, or 30 µM). Data are mean ± 95% c.i. for triplicate reactions (duplicate reactions for WT:RQ/QE AG-221 3 µM and 30 µM). (c–e) Clinical and laboratory features for Patient × in relation to mutant IDH1 inhibitor ivosidenib (AG-120) treatment (blue box), including bone marrow blast percentage (c), plasma 2HG concentration (d), and variant allele frequency (VAF) for mutations identified by targeted next-generation sequencing of bone marrow cells (e). (f) Alignment of IDH1 and IDH2 protein sequences demonstrating that serine 280 (S280) of IDH1 corresponds to isoleucine 319 (I319) of IDH2. (g) Summary of Sanger sequencing results from Patient × demonstrating that the IDH1 R132C neomorphic mutation and the S280F mutation occur in cis on the same allele.
The experimental findings suggested that second-site mutations of IDH2 in cis also might mediate clinical resistance to enasidenib. Analysis of 14 patients with de novo resistance and 7 additional patients with acquired resistance to enasidenib did not identify any patients with second-site IDH2 mutations in either allele (Extended Data Table 2). Notably, we identified one patient with IDH1 R132C-mutant AML who developed acquired clinical resistance to the mutant IDH1 inhibitor ivosidenib (AG-120) with a recurrent elevation of blood 2HG (Fig. 4c, d). In this patient, we identified a second-site mutation in IDH1 resulting in substitution of serine 280 with phenylalanine (S280F) (Fig. 4e). S280 in IDH1 is paralogous to I319 in IDH2 (Fig. 4f). To determine the allelic conformation of the IDH1 mutations, we performed long-range PCR amplification of genomic DNA encompassing both mutations followed by subcloning and sequence analysis of individual clones. All clones with the R132C mutations also harbored the S280F mutation, demonstrating that the putative S280F resistance mutation was acquired in cis with the neomorphic R132C mutation (Fig. 4g).
In summary, we have identified a novel mechanism of acquired clinical resistance to a molecularly targeted therapy, wherein a second-site mutation on the wildtype allele can cooperate with a heterozygous gain-of-function mutation on the other allele to induce therapeutic resistance. In theory, in trans resistance mutations may occur in other homomultimeric targets such as receptor tyrosine kinases. The possibility that in trans mutations of EGFR cysteine 797 (C797) could contribute to EGFR inhibitor resistance in cell lines has been reported, but it has not been observed to occur in vivo in the clinical context18. It remains unclear whether there may be a selective advantage to acquiring the IDH2 Q316E and I319M mutations in trans versus in cis; however we would predict that in cis mutations may be identified as an alternative mechanism of acquired resistance to mutant IDH2 inhibitors. Consistent with this hypothesis, we identified a patient with acquired resistance to IDH1 inhibition who acquired an analogous IDH1 second-site mutation in cis. The identification of the IDH dimer-interface mutations credentials the importance of IDH as a therapeutic target and underscores the critical role of 2HG in the pathogenesis of IDH-mutant malignancies.
Methods
Clinical specimens
The patients described were enrolled on the phase I/II studies NCT02074839 or NCT0191549811. Enrollment was open to all patients with relapsed or refractory acute myeloid leukemia with a mutation in IDH1 (NCT02074839) or IDH2 (NCT01915498) identified locally and confirmed centrally. Patients were required to be 18 years or older at the time of study entry. Both men and women were enrolled on the studies. Patients were required to have a performance status of 2 or better, adequate organ function as defined in the study protocols. Clinical data, blood, and bone marrow samples from patients with acute myeloid leukemia were obtained after receiving written informed consent from patients. Approval was obtained from the Institutional Review Board at each institution participating in these clinical trials. Additional consent was obtained from participants at Memorial Sloan Kettering Cancer Center with analyses performed on the institutional biobanking protocol approved by the Institutional Review Board. Patient biospecimens were anonymized by creating unique identifiers with no associated PHI and keeping the key on a password-protected server. Data collection and research was performed in compliance with all relevant ethical regulations for human research participants. Absolute neutrophil counts and blast percentages were determined by standard clinical assays. Next-generation sequencing and determination of variant allele frequencies (VAF) were performed as previously described12,19. IDH1-mutant AML samples were assessed by the FoundationOne Heme panel as previously described12,20.
Allele-specific sequencing and PCR assays
Genomic DNA was isolated from bone marrow mononuclear cells using the QIAamp DNA Mini Kit (Qiagen) according to the manufacturer’s instructions. The following primers were used to amplify the IDH2 genomic region spanning Exon 4 and Exon 7: forward primer 5’-ATTCCTGTGCCCTCCTTTCT-3’; reverse primer 5’-CAGAGCCCACACATTTGCAC-3’. The ~2kb PCR products were subcloned into a TA-cloning plasmid, followed by bacterial transformation, selection of individual bacterial colonies, isolation of plasmid DNA, and Sanger sequencing in the forward and reverse direction using the same primers. The IDH1 genomic region was cloned and sequenced in a similar matter with the following primers: forward 5’-ACCAACGACCAAGTCACCAA-3’; reverse 5’-CCCTGGAATGACCCTGTTCC-3’. IDH2 qPCR was performed with the following primers: R140R Forward 5’-AGTCCCAATGGAACTATCCG-3’, R140Q Forward 5’-AGTCCCAATGGAACTATCCA-3’, R140R/Q Reverse 5’-GGGGTGAAGACCATTTTGAA-3’, and with SYBR green reagent (Affymetrix). cDNA was prepared using the Verso cDNA synthesis kit (ThermoFisher). For droplet digital PCR (ddPCR), an assay specific for each mutation was designed and ordered through Biorad. All reactions were performed on a QX200 ddPCR System (Biorad) and evaluated in technical duplicates. Reactions were partitioned into a median of ~16,000 droplets per well using the QX200 droplet generator and run on a 96-well thermal cycler. Plates were then analyzed with the QuantaSoft v1.7 to assess the number of droplets positive for mutant or wildtype DNA.
Cell culture and DNA constructs
Adherent 293T cells (purchased from ATCC) were maintained at low passage number in high glucose DMEM with 10% FBS, glucose 25 mM, glutamine 4 mM, penicillin 100 units/ml, and streptomycin 100 µg/ml and split every 2–3 days before reaching confluence. Suspension Ba/F3 cells (purchased from DSMZ) were maintained in RPMI with 10% FBS, mIL-3 3 ng/ml, penicillin 100 units/ml, and streptomycin 100 µg/ml. Cell lines were authenticated by Short Tandem Repeat (STR) profiling. Cell lines repeatedly tested negative for mycoplasma throughout the experimental period. Primary murine hematopoietic stem/progenitor cells were isolated, transduced, and cultured in methylcellulose as previously described6. Colony forming unit (CFU) assays were performed in M3434 methylcellulose (Stem Cell Technologies) in the presence of DMSO, enasidenib (AG-221; Agios) at 50 nM, or (2R)-octyl-α-hydroxyglutarate (‘Octyl-2HG’; Cayman) at 0.5 mM. Colonies were counted every 7 to 10 days and re-plated. IDH2 DNA constructs with C-terminal HA or FLAG tags were cloned by standard site-directed mutagenesis (Agilent) and Gibson Assembly (New England Biolabs) into pCDNA3.1 (Addgene), MSCV-IRES-GFP (Addgene), or MSCV-IRES-mCherry (Addgene) vectors and verified by Sanger sequencing. For transient transfection experiments, 293T cells were transfected using polyethylenimine21. For retroviral infection experiments, supernatant from 293T cells transfected with helper virus and plasmids was collected after 72 hr, filtered and applied to Ba/F3 parental cells or primary murine HSPC overnight. 48 hr post-infection, GFP+ and/or mCherry+ cells were sorted by flow cytometry. Sorted cells were expanded and used for drug treatment experiments with enasidenib.
Mouse experiments
All animal procedures were conducted in accordance with the Guidelines for the Care and Use of Laboratory Animals and were approved by the Institutional Animal Care and Use Committees (IACUC) at Memorial Sloan Kettering Cancer Center. C57Bl/6 Idh2 R140Q and Idh2 R140Q/Flt3 ITD mice were previously described17. Bone marrow transplant and treatment of mice were performed as previously described17. Briefly, 8–16-week old C57Bl/6 Idh2 R140Q female donor mice were treated with 5-Flurouracil 0.15 mg/g, and bone marrow cells isolated 5 days after treatment. Cells were then infected with retrovirus encoding IDH2 WT or IDH2 Q316E. Positive mCherry cells marking transduction were FACS sorted and injected into lethally irradiated 8–16-week old C57Bl/6 wildtype female recipient mice (950cGy) with 1.5×10⁵ support marrow cells. Engrafted mice were then used as donors for secondary transplants into recipients that were used for treatment studies. Enasidenib was given at a dose of 40 mg/kg twice daily by oral gavage. After 2 weeks of drug treatment, allele burden was assessed through peripheral blood mCherry positivity in red blood cell-lysed samples. After 4 weeks of drug treatment, the mice were sacrificed, and bone marrow was harvested from femur and tibia bones then centrifuged for 1 minute at 6000 rcf in 200 μl of RPMI 10% FBS. Red blood cells were lysed in ACK (Ammonium-Chloride-Potassium) lysis buffer. Cells were counted, pelleted, and frozen prior to 2HG analysis.
Gel electrophoresis and western blotting
For denatured gel electrophoresis, cells were harvested in 1× RIPA buffer (Cell Signaling), sonicated, centrifuged at 21,000 g at 4° C, and supernatants were collected. Cleared cell lysates were quantified by BCA assay (ThermoFisher) and normalized for total protein concentration. Samples were separated by SDS-PAGE, then either stained directly with Coomassie Blue Reagent or transferred to nitrocellulose membranes (Life Technologies), blocked in 5% milk prepared in Tris buffered saline with 0.1% Tween 20 (TBST), incubated with primary antibodies overnight at 4° C then horseradish peroxidase (HRP)-conjugated secondary antibodies (GE Healthcare; anti-mouse, NA931V, sheep, 1:5000; anti-rabbit, NA934V, donkey, 1:5000) for 1 hr the following day. After incubation with ECL (ThermoFisher or GE Healthcare), digital imaging was performed using the Amersham Imager 600 (GE Healthcare) or film imaging was performed using the SRX-101A (Konica Minolta). Primary antibodies used included: anti-FLAG (Sigma, F1804; clone M2; mouse; 1:1000), anti-GAPDH (Cell Signaling Technology, 5174; clone D16H11; rabbit; 1:1000), anti-HA (Cell Signaling Technology, 2367S; clone 6E2; mouse; 1:1000), anti-IDH2 (Abcam, ab55271; no clone name; mouse; 1:1000), and anti-vinculin (Cell Signaling Technology, 4650; no clone name; rabbit; 1:1000). For native gel electrophoresis, cells were harvested in M-PER buffer (ThermoFisher) without sonication, IDH2 enzyme complexes were purified with Pierce Anti-HA Agarose (ThermoFisher), separated by NativePAGE (ThermoFisher), and either stained directly with Coomassie reagent or transferred for Western blotting as described above.
xEnzyme assays
HA-tagged IDH2 enzymes were purified from transfected 293T cells using Pierce Anti-HA Agarose (ThermoFisher) according to the manufacturer’s instructions. HA-tagged enzymes were quantified by denatured gel electrophoresis with Coomassie staining in reference to a defined quantity of recombinant human IDH2 (Abcam, ab198092). Purified enzymes were used at 7.5–10 µg/ml as indicated. NAPDH was used at 0.30 mM and alpha-ketoglutarate was used at 5 mM unless otherwise indicated. The enzyme reaction buffer consisted of HEPES 50 mM, NaCl 150 mM, MgCl2 20 mM, and BSA 0.01%. For NADPH consumption assays, reactions were conducted in UV-transparent 96-well plates (Corning) with reaction volumes of 200 µl. A SpectraMax Plus 384 Microplate Reader (Molecular Devices) was used to monitor the absorbance at 340 nm every 30 seconds throughout the course of the reaction. For each condition, the mean rate of NADPH consumption for triplicate control reactions without enzyme was subtracted from the rate of NADPH consumption for triplicate experimental reactions with enzyme. Reaction velocities were calculated using an extinction coefficient for NADPH at ε340 of 6220 M-1 cm-1 and pathlength of 0.56 cm for a 200 µl reaction volume in a standard 96-well plate.
Metabolite extraction and analysis
Metabolites were extracted with ice-cold 80:20 methanol:water containing 2 µM deuterated 2-hydroxyglutarate (D-2-hydroxyglutaric-2,3,3,4,4-d5 acid; deuterated-2HG) as an internal standard. After overnight incubation at -80° C, cell extract was harvested, sonicated, and centrifuged at 21,000 g for 20 min at 4° C to precipitate protein. Extracts were then dried in an evaporator (Genevac EZ-2 Elite). For GC-MS, metabolites were resuspended by addition of 50 µl of methoxyamine hydrochloride (40 mg/ml in pyridine) and incubated at 30° C for 90 min with agitation. Metabolites were further derivatized by addition of 80 µl of N-methyl-N-(trimethylsilyl) trifluoroacetamide (MSTFA) + 1% 2,2,2-trifluoro-N-methyl-N-(trimethylsilyl)-acetamide, chlorotrimethylsilane (TCMS; Thermo Scientific) and 70 µl of ethyl acetate (Sigma) and incubated at 37° C for 30 min. Samples were diluted 1:2 with 200 µl of ethyl acetate, then analyzed using an Agilent 7890A GC coupled to Agilent 5975C mass selective detector. The GC was operated in splitless mode with constant helium carrier gas flow of 1 ml/min and with a HP-5MS column (Agilent Technologies). The injection volume was 1 µl and the GC oven temperature was ramped from 60° C to 290° C over 25 min. Peaks representing compounds of interest were extracted and integrated using MassHunter vB.08.00 (Agilent Technologies) and then normalized to both the internal standard (deuterated-2HG) peak area and cell number or protein content as applicable. Ions used for quantification of metabolite levels were 2HG m/z 247 (confirmatory ion m/z 349) and deuterated-2HG m/z 252 (confirmatory ion m/z 354). Peaks were manually inspected and verified relative to known spectra for each metabolite. Absolute metabolite quantitation was performed using an external calibration curve with deuterated-2HG internal standard and the resulting concentrations corrected for the total cell volume extracted. For IDH1-mutant AML patients, plasma 2HG concentrations were determined using a qualified liquid chromatography–tandem mass spectrometry (LC-MS/MS) method with a lower limit of quantitation of 30 ng/ml as previously described22.
Structural modeling
The structure of enasidenib (AG-221) bound to IDH2 was obtained from PDB ID 5I96 retrieved from the RCSB9. This structure has a R140Q mutation in both homodimer subunits. Residues I170, L298, S300, V315, Q316, S317, D318, I319, L320, and I170’, V294’, S300’, V315’, Q316’, S317’, D318’, I319’, L320’, and AG-221 had two conformations resolved with different occupancies; here, primed residues denote second dimer subunit. Two models were constructed: one for the high-occupancy conformations of all residues, and another for the low-occupancy conformations of all residues. Point mutants of interest (Q316E, I319M, Q316E`, and I319M`) were introduced in the structures of each of the two models using the “Mutate Residues” functionality in Maestro 11.2 (Schrödinger)23, and side chain orientations were optimized using the “Predict Side Chains” functionality with default setting in Prime v4.8 (Schrödinger)23–25. This resulted in a total of eight single-mutant structures. Inspection of the mutated structures revealed potential differences in interactions between mutant and wildtype that could affect the binding of AG-221. These features were manually highlighted in figures produced using PyMOL v1.8.2.0 (Schrödinger)26.
Statistics and reproducibility
Significance was determined by two-tailed Student’s t-test comparing the indicated condition to the corresponding wildtype or control. Open circles are individual data points. For quantitative measurements, n is provided in the figure legends. All results have been independently replicated at least twice, with the exception of the in vivo experiments shown in Fig. 3i, j. No statistical methods were used to predetermine sample size. The experiments were not randomized, and investigators were not blinded to allocation during experiments and outcome assessment.
Data availability statement
Source data for all figures are provided with the paper. Uncropped versions of blots are provided in Extended Data Figures 6–8. Structural modeling studies referenced accession code Protein Data Bank 5I96. Images, settings, and scripts for the structural modeling are available at doi:10.6084/m9.figshare.5966878. Sequencing data is deposited in the European Nucleotide Archive (https://www.ebi.ac.uk/ena/data/view/PRJEB26337).
Extended Data
Extended Data Figure 1. Acquired clinical resistance to the mutant IDH2 inhibitor enasidenib (AG-221).
(a, b) Hematoxylin and eosin staining of bone marrow cells aspirated from Patient A (a) and Patient B (b) at indicated points in relation to treatment with AG-221. Remission images demonstrate decreased leukemic blasts and increased myeloid differentiation which are reversed at the time of relapse. Images show 100× magnification. Images are representative fields of a single bone marrow aspiration performed at each time point.
Extended Data Figure 2. Structures illustrating potential interactions between IDH2 second-site mutations and enasidenib.
(a–h) Detailed view of the interactions between wildtype IDH2 Q316 (a, e) and Q316’ (c, g) or mutant IDH2 Q316E (b, f) and Q316E’ (d, h) with AG-221 in the predicted dominant conformation (a–d) or a minor conformation (e–h). Hydrogen bonds are depicted in light green. Note the disrupted hydrogen bond (depicted as orange bar) in (d) resulting from the Q316E mutation in the IDH2’ subunit. (i–p) Detailed view of the interactions between wildtype IDH2 I319 (i, m) and I319’ (k, o) or mutant IDH2 I319M (j, n) and I319M’ (l, p) with AG-221 in the predicted dominant conformation (i–l) or a predicted minor conformation (m–p). The solvent excluded surface of AG-221 is shown transparently in gray. The van der Waals radius of the Cδ1 and Cγ2 atoms of I319/I319’ or the Sδ and Cε atoms of I319M/I319M’ are depicted as spheres. Unfavorable steric interactions between AG-221 and these atoms are depicted in red. Throughout the figure, the IDH2 subunit is depicted in blue-gray, the IDH2’ subunit in purple, and AG-221 in teal. Non-polar hydrogens are not shown. White, red, blue, and yellow portions of stick structures indicate hydrogen, oxygen, nitrogen, and sulfur atoms respectively. All models were based on the AG-221:IDH2 structure PDB ID 5I96 retrieved from the RCSB9 (see Methods).
Extended Data Figure 3. Expression and activity of in trans IDH2 second-site mutations in hematopoietic cells.
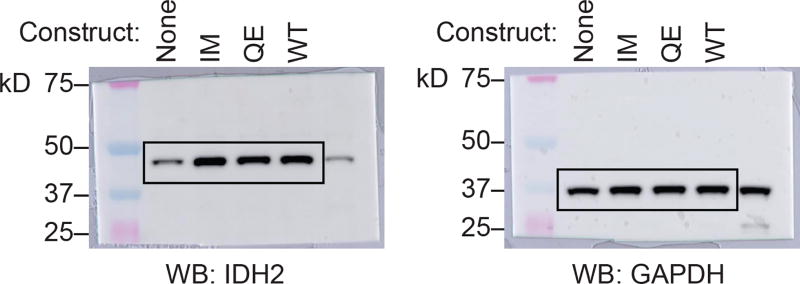
(a) Allele-specific quantitative RT-PCR (qPCR) showing similar expression of constructs in Ba/F3 cells co-transduced with IDH2 R140Q (RQ) plus IDH2 wildtype (WT), Q316E (QE), or I319M (IM) in trans. Control from IDH2 WT human cell line (293T). Data are mean ± s.e.m. for triplicate reactions. (b) Intracellular 2HG levels in Ba/F3 cells co-expressing RQ plus WT, QE, or IM in trans and treated with vehicle (‘Veh’) or increasing doses of AG-221 (1 nM, 10 nM, 100 nM, 1 µM, or 10 µM). Data are mean ± s.e.m. for triplicate cultures. (c) Western blot showing IDH2 protein levels in primary hematopoietic stem/progenitor cells (HSPC) from Idh2 R140Q/Flt3 ITD mice transduced with WT, QE, or IM and untransduced control cells for comparison (‘None’). GAPDH serves as a loading control. The same membrane was stripped and reprobed for Western blots. (d) Intracellular 2HG levels in primary HSPC from Idh2 R140Q/Flt3 ITD mice transduced with WT, QE, or IM and harvested from the first passage of methylcellulose cultures containing AG-221 at 50 nM. Data for are mean ± s.e.m. for triplicate cultures. (e) Flow cytometry gating strategy for Fig. 3i. SSC-A, side scatter area; FSC-A, forward scatter area. DAPI is a viability dye. mCherry identifies retrovirally transduced cells. Results are representative of ≥2 (a–d) or 1 (e) independent experiments. For gel source data, see Extended Data Figure 6.
Extended Data Figure 4. Purification and activity of IDH2 R140Q dimers with IDH2 wildtype, Q316E, or I319M in trans.
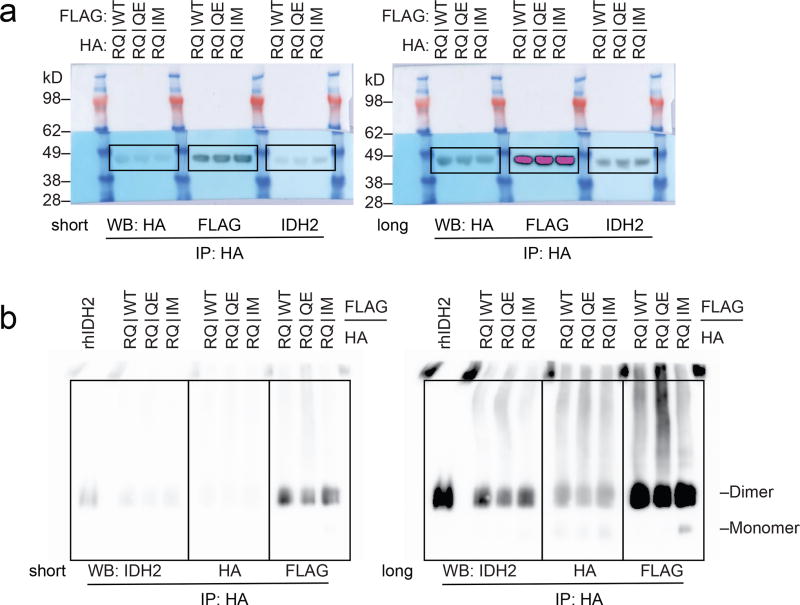
(a) Schematic of experimental approach: 293T cells were co-transfected with HA-tagged IDH2 R140Q (RQ) plus FLAG-tagged wildtype (WT), Q316E (QE) or I319M (IM). After 2 days, cells were lysed and enzyme complexes were purified by HA-immunoprecipitation. Reactions were performed with purified enzyme, NADPH, alpha-ketoglutarate (αKG), and varying doses of AG-221 as detailed in Fig. 3. (b–e) Purity and dimerization of HA-precipitated enzymes were assessed by denatured SDS-PAGE with Coomassie staining (b), denatured SDS-PAGE with Western blotting (c), native PAGE with Coomassie staining (d), or native PAGE with Western blotting for the indicated proteins (e). Separate membranes were used for Western blots. (f) In vitro enzyme assays measuring rate of NADPH consumption of IDH2 dimers purified as in (b–e). Reactions contained purified enzyme (10 µg/ml), NADPH (0.3 mM), alpha-ketoglutarate (αKG; 5 mM), and AG-221 at indicated concentrations. Data are mean ± 95% c.i. for triplicate reactions. Results are representative of ≥3 (b–d, f) or 2 (e) independent experiments. For gel source data, see Extended Data Figure 7.
Extended Data Figure 5. Second-site IDH2 mutations in cis can confer resistance to enasidenib.
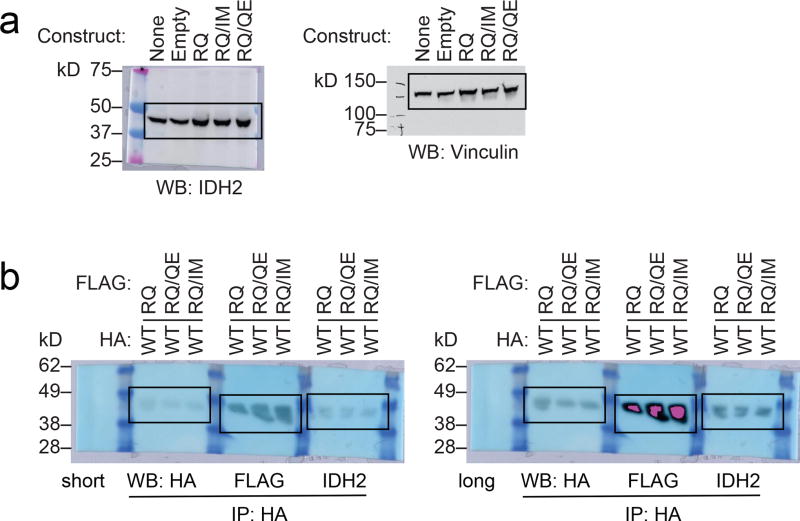
(a) Western blot showing IDH2 expression in Ba/F3 cells transduced with the indicated constructs. Vinculin serves as a loading control. The same membrane was probed for both IDH2 and vinculin. These are the same cells as in Fig. 4a. (b–g) Purification and enzymatic activity of IDH2 WT:R140Q dimers with or without in cis second-site mutations. (b) Schematic of experimental approach: 293T cells were co-transfected with HA-tagged IDH2 wildtype (WT) plus FLAG-tagged IDH2 R140Q (RQ), in cis double-mutant IDH2 R140Q/Q316E (RQ/QE) or in cis double-mutant IDH2 R140Q/I319M (RQ/IM). After 2 days, cells were lysed and IDH2 enzyme complexes were purified by HA-immunoprecipitation. (c–e) Purity and dimerization of HA-precipitated enzymes were assessed by denatured SDS-PAGE with Coomassie staining (c), denatured SDS-PAGE with Western blotting with the indicated antibodies (d), or native PAGE with Coomassie staining (e). Separate membranes were used for Western blots. (f, g) In vitro enzyme assays measuring relative activity (f) and rate of NADPH consumption (g) by HA-precipitated IDH2 dimers. Reactions contained purified enzyme (7.5 µg/ml), NADPH (0.3 mM), alpha-ketoglutarate (αKG; 5 mM), and vehicle or increasing doses of AG-221 (0.1, 0.3, 1, 3, 10, or 30 µM). Data are mean ± 95% c.i. for triplicate reactions (duplicate reactions for WT:RQ/QE AG-221 3 µM and 30 µM). Results are representative of ≥3 independent experiments. For gel source data, see Extended Data Figure 8.
Extended Data Figure 6. Full blots for Extended Data Figure 3c.
k.D., kiloDalton.
Extended Data Figure 7. Full blots for Extended Data Figure 4.
(a) Full blots for Extended Data Figure 4c. (b) Full blots for Extended Data Figure 4e. k.D., kiloDalton.
Extended Data Figure 8. Full blots for Extended Data Figure 5.
(a) Full blots for Extended Data Figure 5a. (b) Full blots for Extended Data Figure 5d. k.D., kiloDalton.
Extended Data Table 1.
Droplet digital PCR for IDH2 mutations in pre- and post-treatment samples.
| Patient A | |||||
|---|---|---|---|---|---|
| Assay | Sample | Day | Droplet Count Mutant |
Droplet Count WT |
Ratio ([Mut]/[WT]) |
| IDH2_Q316E | BM pre | −91 | 0 | 5081 | 0.00 |
| IDH2_Q316E | BM pre | −14 | 0 | 2666 | 0.00 |
| IDH2_Q316E | BM post | 364 | 1089 | 1309 | 0.83 |
| IDH2_R140Q | BM pre | −91 | 2413 | 3242 | 0.74 |
| IDH2_R140Q | BM pre | −14 | 1254 | 1396 | 0.90 |
| IDH2_R140Q | BM post | 364 | 1232 | 1365 | 0.90 |
| Patient B | |||||
|---|---|---|---|---|---|
| Assay | Sample | Day | Droplet Count Mutant |
Droplet Count WT |
Ratio ([Mut]/[WT]) |
| IDH2_I319E | BM pre | −32 | 0 | 8767 | 0.00 |
| IDH2_I319E | PB pre | −11 | 0 | 11695 | 0.00 |
| IDH2_I319E | BM post | 465 | 800 | 3684 | 0.22 |
| IDH2_R140Q | BM pre | −32 | 5086 | 5718 | 0.89 |
| IDH2_R140Q | PB pre | −11 | 6270 | 6389 | 0.98 |
| IDH2_R140Q | BM post | 465 | 2337 | 2570 | 0.91 |
Extended Data Table 2.
Frequency of second-site IDH2 mutations in AML patients treated with AG-221.
| Category | N (%) | Second-site IDH2 mutation (in subset) |
|---|---|---|
|
| ||
| Total treated on AG-221 protocol at MSKCC and assessed by next-gen sequencing | 59 (100%) | 0/59 (0%)* |
|
| ||
| De novo drug resistance | 14/59 (24%) | 0/14 (0%) |
|
| ||
| Acquired clinical resistance | 9/59 (15%) | 2/9 (22%) |
| • Normal blood 2HG | 5/59 (8.5%) | 0/5 (0%) |
| • Elevated blood 2HG | 4/59 (6.8%) | 2/4 (50%) |
pre-treatment/earliest sample.
Supplementary Material
Acknowledgments
We thank members of the Levine and Thompson laboratories for helpful discussions. A.M.I. is supported by the NIH/NCI (K08 CA201483), Leukemia & Lymphoma Society (3356-16), Burroughs Wellcome Fund (1015584), Susan & Peter Solomon Divisional Genomics Program, Steven A. Greenberg Fund, and Cycle for Survival. A.H.S is supported by the NIH/NCI (K08 CA181507) and Leukemia & Lymphoma Society. The work was also supported, in part, by the Conquer Cancer Foundation of ASCO (A.M.I, A.H.S., J.T.), the Leukemia & Lymphoma Society Specialized Center of Research Program (7011-16; A.M.I., C.B.T.), a Translational and Integrative Medicine Research Fund (TIMRF) grant (A.H.S., E.M.S.), the American Association for Cancer Research (J.T.), the American Society of Hematology/Robert Woods Johnson Foundation (J.T.), and grants from the NIH, including R01 CA168802-02 (C.B.T.), R35 CA197594-01A1 (R.L.L.), U54 OD020355 (R.L.L.), and the Memorial Sloan Kettering Cancer Center Support Grant (NIH P30 CA008748) including a supplement to R.L.L., C.B.T., and A.H.S. We acknowledge the use of the Integrated Genomics Operation Core, funded by the Memorial Sloan Kettering Cancer Center Support Grant (NIH P30 CA008748), Cycle for Survival, and the Marie-Josée and Henry R. Kravis Center for Molecular Oncology.
Footnotes
Author Contributions
A.M.I., A.H.S., C.B.T., R.L.L., and E.M.S. conceived the project, designed the experiments, analyzed the data, and wrote the manuscript. A.M.I., A.H.S., B.W., and A.N. performed the experiments with technical assistance from F.M.C., N.T., V.D., H.L., and J.R.C. M.P., C.F., J.T., and M.S.T. assisted with management of clinical data and specimens. M.E.A. and M.R. assisted with pathologic assessment of biospecimens. A.S.R., S.K.A., G.A.P., and J.D.C. performed the structural modeling. N.R.F. and E.P. performed the mutational analysis. B.W., S.C., Z.D.K., and S.A.B. assisted with identification and analysis of the IDH1-mutant leukemia. All authors read and approved the manuscript.
Competing Financial Interests
C.B.T. is a founder of Agios Pharmaceuticals and a member of its scientific advisory board. He also serves on the board of directors of Merck and Charles River Laboratories. R.L.L. is on the Supervisory Board of Qiagen. J.D.C. is a member of the scientific advisory board of Schrödinger. B.W., S.C., Z.D.K., and S.A.B. are employees of Agios Pharmaceuticals, Inc.
References
- 1.Losman JA, Kaelin WG., Jr What a difference a hydroxyl makes: mutant IDH, (R)-2-hydroxyglutarate, and cancer. Genes & Development. 2013;27:836–852. doi: 10.1101/gad.217406.113. [DOI] [PMC free article] [PubMed] [Google Scholar]
- 2.Ley TJ, et al. DNA sequencing of a cytogenetically normal acute myeloid leukaemia genome. Nature. 2008;456:66–72. doi: 10.1038/nature07485. [DOI] [PMC free article] [PubMed] [Google Scholar]
- 3.Ward PS, et al. The common feature of leukemia-associated IDH1 and IDH2 mutations is a neomorphic enzyme activity converting alpha-ketoglutarate to 2-hydroxyglutarate. Cancer Cell. 2010;17:225–234. doi: 10.1016/j.ccr.2010.01.020. [DOI] [PMC free article] [PubMed] [Google Scholar]
- 4.Gross S, et al. Cancer-associated metabolite 2-hydroxyglutarate accumulates in acute myelogenous leukemia with isocitrate dehydrogenase 1 and 2 mutations. The Journal of Experimental Medicine. 2010;207:339–344. doi: 10.1084/jem.20092506. [DOI] [PMC free article] [PubMed] [Google Scholar]
- 5.Losman JA, et al. (R)-2-hydroxyglutarate is sufficient to promote leukemogenesis and its effects are reversible. Science. 2013;339:1621–1625. doi: 10.1126/science.1231677. [DOI] [PMC free article] [PubMed] [Google Scholar]
- 6.Figueroa ME, et al. Leukemic IDH1 and IDH2 mutations result in a hypermethylation phenotype, disrupt TET2 function, and impair hematopoietic differentiation. Cancer Cell. 2010;18:553–567. doi: 10.1016/j.ccr.2010.11.015. [DOI] [PMC free article] [PubMed] [Google Scholar]
- 7.Kats LM, et al. Proto-oncogenic role of mutant IDH2 in leukemia initiation and maintenance. Cell Stem Cell. 2014;14:329–341. doi: 10.1016/j.stem.2013.12.016. [DOI] [PMC free article] [PubMed] [Google Scholar]
- 8.Chen C, et al. Cancer-associated IDH2 mutants drive an acute myeloid leukemia that is susceptible to Brd4 inhibition. Genes & Development. 2013;27:1974–1985. doi: 10.1101/gad.226613.113. [DOI] [PMC free article] [PubMed] [Google Scholar]
- 9.Yen K, et al. AG-221, a First-in-Class Therapy Targeting Acute Myeloid Leukemia Harboring Oncogenic IDH2 Mutations. Cancer Discovery. 2017;7:478–493. doi: 10.1158/2159-8290.CD-16-1034. [DOI] [PubMed] [Google Scholar]
- 10.Wang F, et al. Targeted inhibition of mutant IDH2 in leukemia cells induces cellular differentiation. Science. 2013;340:622–626. doi: 10.1126/science.1234769. [DOI] [PubMed] [Google Scholar]
- 11.Stein EM, et al. Enasidenib in mutant-IDH2 relapsed or refractory acute myeloid leukemia. Blood. 2017 doi: 10.1182/blood-2017-04-779405. [DOI] [PMC free article] [PubMed] [Google Scholar]
- 12.Amatangelo MD, et al. Enasidenib induces acute myeloid leukemia cell differentiation to promote clinical response. Blood. 2017 doi: 10.1182/blood-2017-04-779447. [DOI] [PMC free article] [PubMed] [Google Scholar]
- 13.Gorre ME, et al. Clinical resistance to STI-571 cancer therapy caused by BCR-ABL gene mutation or amplification. Science. 2001;293:876–880. doi: 10.1126/science.1062538. [DOI] [PubMed] [Google Scholar]
- 14.Kobayashi S, et al. EGFR mutation and resistance of non-small-cell lung cancer to gefitinib. The New England Journal of Medicine. 2005;352:786–792. doi: 10.1056/NEJMoa044238. [DOI] [PubMed] [Google Scholar]
- 15.Pao W, et al. Acquired resistance of lung adenocarcinomas to gefitinib or erlotinib is associated with a second mutation in the EGFR kinase domain. PLoS Med. 2005;2:e73. doi: 10.1371/journal.pmed.0020073. [DOI] [PMC free article] [PubMed] [Google Scholar]
- 16.Choi YL, et al. EML4-ALK mutations in lung cancer that confer resistance to ALK inhibitors. The New England Journal of Medicine. 2010;363:1734–1739. doi: 10.1056/NEJMoa1007478. [DOI] [PubMed] [Google Scholar]
- 17.Shih AH, et al. Combination Targeted Therapy to Disrupt Aberrant Oncogenic Signaling and Reverse Epigenetic Dysfunction in IDH2- and TET2-Mutant Acute Myeloid Leukemia. Cancer Discovery. 2017;7:494–505. doi: 10.1158/2159-8290.CD-16-1049. [DOI] [PMC free article] [PubMed] [Google Scholar]
- 18.Niederst MJ, et al. The Allelic Context of the C797S Mutation Acquired upon Treatment with Third-Generation EGFR Inhibitors Impacts Sensitivity to Subsequent Treatment Strategies. Clin Cancer Res. 2015;21:3924–3933. doi: 10.1158/1078-0432.CCR-15-0560. [DOI] [PMC free article] [PubMed] [Google Scholar]
- 19.Zehir A, et al. Mutational landscape of metastatic cancer revealed from prospective clinical sequencing of 10,000 patients. Nature Medicine. 2017;23:703–713. doi: 10.1038/nm.4333. [DOI] [PMC free article] [PubMed] [Google Scholar]
- 20.He J, et al. Integrated genomic DNA/RNA profiling of hematologic malignancies in the clinical setting. Blood. 2016;127:3004–3014. doi: 10.1182/blood-2015-08-664649. [DOI] [PMC free article] [PubMed] [Google Scholar]
- 21.Yang S, Shi H, Chu X, Zhou X, Sun P. A rapid and efficient polyethylenimine-based transfection method to prepare lentiviral or retroviral vectors: useful for making iPS cells and transduction of primary cells. Biotechnol Lett. 2016;38:1631–1641. doi: 10.1007/s10529-016-2123-2. [DOI] [PubMed] [Google Scholar]
- 22.Dang L, et al. Cancer-associated IDH1 mutations produce 2-hydroxyglutarate. Nature. 2009;462:739–744. doi: 10.1038/nature08617. [DOI] [PMC free article] [PubMed] [Google Scholar]
- 23.Schrödinger . Schrödinger Release 2017-2: Maestro. Schrödinger, LLC; New York, NY: 2017. [Google Scholar]
- 24.Jacobson MP, Friesner RA, Xiang Z, Honig B. On the role of the crystal environment in determining protein side-chain conformations. Journal of Molecular Biology. 2002;320:597–608. doi: 10.1016/s0022-2836(02)00470-9. [DOI] [PubMed] [Google Scholar]
- 25.Jacobson MP, et al. A hierarchical approach to all-atom protein loop prediction. Proteins. 2004;55:351–367. doi: 10.1002/prot.10613. [DOI] [PubMed] [Google Scholar]
- 26.The PyMOL Molecular Graphics System. V. S., LLC; [Google Scholar]
Associated Data
This section collects any data citations, data availability statements, or supplementary materials included in this article.
Supplementary Materials
Data Availability Statement
Source data for all figures are provided with the paper. Uncropped versions of blots are provided in Extended Data Figures 6–8. Structural modeling studies referenced accession code Protein Data Bank 5I96. Images, settings, and scripts for the structural modeling are available at doi:10.6084/m9.figshare.5966878. Sequencing data is deposited in the European Nucleotide Archive (https://www.ebi.ac.uk/ena/data/view/PRJEB26337).


