

Summary
Chronic inflammation increases the risk of several cancer types. The current notion is that the control of inflammatory responses relies on transcriptional networks distinct from those involved in cell differentiation 1–3. The orphan nuclear receptor NR5A2 participates in a wide variety of processes including cholesterol and glucose metabolism in the liver, resolution of ER stress, intestinal glucocorticoid production, pancreatic development, and acinar differentiation 4–8. Single nucleotide polymorphisms (SNPs) in the vicinity of NR5A2 have been associated with the risk of pancreatic adenocarcinoma (PDAC) through genome wide association studies 9,10. In mice, Nr5a2 heterozygosity sensitizes the pancreas to damage, impairs regeneration, and cooperates with mutant KRas in tumor progression 11. Through global transcriptomic analysis, we describe here an epithelial cell-autonomous basal pre-inflammatory state in the pancreas of Nr5a2+/− mice that is reminiscent of early stages of pancreatitis-induced inflammation and is conserved in histologically normal human pancreata with reduced NR5A2 mRNA expression. In Nr5a2+/− mice, Nr5a2 undergoes a dramatic transcriptional switch relocating from differentiation-specific to inflammatory genes thereby promoting AP-1-dependent gene transcription. Pancreatic deletion of c-Jun rescues the pre-inflammatory phenotype, Nr5a2 binding to inflammatory gene promoters, and the defective regenerative response to damage. These findings support the notion that, in the pancreas, the same transcriptional networks involved in differentiation-specific functions suppress inflammatory programmes. These networks can be subverted to foster inflammation upon genetic or environmental constraints.
The cooperation between germline Nr5a2 haploinsufficiency, mutant KRas, and inflammation to promote PDAC suggests functional interactions relevant to human disease 11. In two independent series of PDAC patients, tumors with lower NR5A2 expression were significantly enriched in subjects with a history of chronic pancreatitis (P=0.001) (Supplementary Table 1). The rs3790844 risk-increasing allele (T) 9 was associated with reduced NR5A2 protein levels (P=0.028, β=−0.57) (Extended Data Fig. 1), suggesting that NR5A2 expression may underlie susceptibility to PDAC.
To identify the mechanisms favouring impaired regeneration and PDAC, we have used Nr5a2+/− mice. The pancreas of adult Nr5a2+/− mice is histologically normal, as is the expression of pancreatic transcription factors and digestive enzymes (Extended Data Fig. 2a, b). RNA-Seq showed that 926 and 100 genes were significantly up-regulated or down-regulated, respectively, in pancreata from 8–10 week-old Nr5a2+/− mice compared to wild type (WT) mice. Gene Set Enrichment Analysis (GSEA) revealed that 21/23 gene sets over-represented in Nr5a2+/− mice, and 68% of up-regulated genes, belong to inflammatory pathways (Fig. 1a,b; Supplementary Tables 2, 3). Among them are those coding for chemokines (i.e. Ccl5, Ccl7), complement components (i.e. C1qb, C3), and metalloproteases. Results were confirmed by quantitative RT-PCR (RT-qPCR) (Fig. 1c). Corresponding changes in H3K27ac or H3K27me3 at the promoters of differentially regulated genes were observed (not shown). mRNA and protein analyses using fresh tissue, isolated acini, and immunohistochemistry confirmed up-regulation of inflammatory mediators in acinar cells (Fig. 1c-e; Extended Data Figs. 2c and 3a). Quantification of Cd45+ cells and immune cell populations in WT and Nr5a2+/− pancreata did not reveal significant differences and a role of ductal cells was excluded (Fig. 1f; Extended Data Figs. 2d-f and 3). Pancreas-selective inactivation of one Nr5a2 allele, and biallelic Nr5a2 inactivation in myeloid cells, showed that the defect is pancreatic epithelial cell-specific (Extended Data Fig. 4), indicating that Nr5a2 haploinsufficiency leads to an epithelial cell-autonomous basal pre-inflammatory state.
Figure 1. Reduced Nr5a2 expression is associated with pre-inflammation in normal pancreas of mice and humans.

a, PCA of the transcriptome of WT and Nr5a2+/− mice in basal conditions and during caerulein-induced pancreatitis (7 hourly injections) (n=3/group). b, Gene set enrichment analysis of genes differentially expressed in Nr5a2+/− (n=3) vs. WT mice (n=3). c, RT-qPCR showing up-regulation of inflammatory genes in Nr5a2+/− pancreata (relative to WT) (n=7/group). d, RT-qPCR showing up-regulation of inflammatory genes in primary Nr5a2+/− acinar cells (relative to WT) (n=4/group). e, Western blots showing up-regulation of inflammatory proteins in Nr5a2+/− pancreata (n≥4/group). f, FACS analysis of inflammatory cells in WT and Nr5a2+/− pancreata (n=4/group). g, Scatter plot showing the relationship between expression of up-regulated, down-regulated, or a random set of genes in control Nr5a2+/+ vs. Nr5a2+/− mice (y-axis) and in histologically normal human pancreatic samples (x-axis, top high vs. low quartiles of NR5A2 mRNA expression). Statistical analysis (c,d,f), one-sided Mann-Whitney test; * P<0.05, ** P<0.01.
To assess whether similar transcriptomic changes occur in humans, we compared histologically normal pancreata (n=95) 12 with high vs. low NR5A2 expression (top vs. bottom quartile) (n=24/group). Seventy-eight percent of genes whose expression was up-regulated in Nr5a2+/− pancreata (n=718) were differentially expressed in human samples (P<0.05). Of them, 92% were significantly up-regulated. By contrast, 44% of down-regulated genes (n=64) were differentially represented (P<0.05) and only 50% of them were down-regulated (Fig. 1g). Overall, genes that were up-regulated in Nr5a2+/− mice were also up-regulated in the NR5A2low vs. the NR5A2high human pancreata, when compared with a random list of 173 genes (P=10−31). By contrast, down-regulated genes did not follow a concordant pattern in mouse and human pancreata (P=0.58). The conservation of findings across species provides a framework to decipher the relationship between NR5A2 genotype, expression, and PDAC in mice.
Analysis of public pancreatic Nr5a2 ChIP-seq datasets 6 showed that the promoters of 89% of the genes whose expression was up-regulated in Nr5a2+/− mice contain putative Nr5a2 binding sites but actually only 7% exhibited Nr5a2 binding within 2.5 Kb from the transcriptional start site, suggesting the participation of an indirect mechanism (Fig. 2a). Promoter Scanning Analysis of up-regulated genes showed significant enrichment of AP-1 and NF-kB binding motifs, among others. Similar enrichment was found by computing the list of up-regulated genes with GSEA using the MSigDB C3 transcription factor target gene set collection. c-Jun, Junb, Jund, and c-Fos mRNA and protein were significantly up-regulated in Nr5a2+/− pancreata (Fig. 2b,c). We confirmed that these changes occurred in epithelial cells using freshly isolated acini and immunohistochemistry (Extended Data Fig. 3g). p-Jun and p-Jnk were also up-regulated in Nr5a2+/− pancreata and isolated acini (Fig. 2d, Extended Data Fig. 3h). Quantitative chromatin immunoprecipitation (ChIP-qPCR) showed significantly increased binding of Nr5a2 to the promoters of c-Fos and Fosl1 - but not to those of c-Jun, Junb, and Jund - in Nr5a2+/− pancreata compared to WT mice (Fig. 2e). Nr5a2 expression in HEK293 cells led to a dose-dependent decrease of c-Jun mRNA (Fig. 2f), indicating that changes in Nr5a2 levels can modulate c-Jun expression. ChIP-qPCR showed increased binding of c-Jun, Junb, Jund, and c-Fos to the promoter of up-regulated inflammatory genes in Nr5a2+/− pancreata (Fig. 2g).
Figure 2. AP-1 components are up-regulated, and bind to the promoter of inflammatory genes, in Nr5a2+/− pancreata.

a, A minor fraction of the promoters of genes up-regulated in Nr5a2+/− pancreata display Nr5a2 peaks in ChIP-Seq experiments using normal pancreas. b, RT-qPCR of AP-1 component expression in an independent group of WT and Nr5a2+/− mice (n=7/group). c,d Western blots showing NR5A2, AP-1, p-Jun, and p-Jnk expression in WT and Nr5a2+/− pancreata (n=4/group). e, Nr5a2 enrichment at AP-1 gene promoters using ChIP-qPCR (n=7/group). f, RT-qPCR of c-Jun expression in HEK293 upon transfection of Nr5a2-coding plasmid, showing reduced c-Jun mRNA (mean, 5 independent experiments). g, ChIP-qPCR of the occupancy of inflammatory gene promoters by AP-1 in WT and Nr5a2+/− pancreata (n≥5/group). At least two independent experiments were performed. Statistical analysis (b,e,f,g), one-sided Mann-Whitney test; * P<0.05, ** P<0.01.
The basal pre-inflammatory transcriptome of Nr5a2+/− mice suggests a subclinical pancreatitis-like state. We compared the transcriptome of WT and Nr5a2+/− pancreata 8, 24, and 48 h after induction of a mild acute pancreatitis (7 caerulein doses) using RNA-Seq. Principal component analysis (PCA) highlighted the divergence of the basal transcriptomes of WT and Nr5a2+/− pancreata; these differences were completely, but transiently, eroded 8 h after pancreatitis induction. The basal transcriptome of Nr5a2+/− pancreata was similar to that of WT mice at 8 h (Fig. 1a). When the set of genes up-regulated in Nr5a2+/− mice in basal conditions was considered, the differences between Nr5a2+/− and WT pancreata were notably reduced 8–24 h after pancreatitis induction. A similar, but inverse, dynamic pattern was observed for down-regulated genes. Expression of a random set of genes was unaffected (Extended Data Fig. 5a). Consistently, there was a strong up-regulation of AP-1 at 8 h of pancreatitis in mice of both genotypes but persistent AP-1 up-regulation at 24–48 h was observed only in Nr5a2+/− mice (Extended Data Fig. 5b). These results indicate that, at the transcriptome level, Nr5a2 haploinsufficiency mimics acute pancreatitis.
The repeated caerulein dosing required to induce pancreatitis hampers the interpretation of dynamic acute signalling/transcriptional responses. Therefore, we analysed the effects of a single dose of caerulein that does not induce pancreatitis (Extended Data Fig. 6a). c-Jun, c-Fos, Jund, Fra1, and Fra2 were up-regulated to a similar extent in both WT and Nr5a2+/− pancreata 30–60 min after caerulein administration, preceding Stat3 phosphorylation (Extended Data Fig. 6b). We then analyzed the expression of a subset of the genes differentially overexpressed in Nr5a2+/− pancreata in basal conditions. By 30–60 min, one dose of caerulein was sufficient to promote an inflammatory profile in WT mice that highly resembled that of Nr5a2+/− pancreata. A complete resolution of this expression profile occurred in WT mice by 12 h (Fig. 3a,b). To determine whether these effects are epithelial cell-autonomous, primary acini from WT and Nr5a2+/− mice were treated with vehicle or caerulein for 24 h. RT-qPCR analysis confirmed that, in control conditions, Nr5a2+/− acini express higher levels of inflammatory genes than WT acini and the differences were abolished upon caerulein treatment (Extended Data Fig. 6c). These findings further support the notion that Nr5a2+/− acini display a transcriptional pre-inflammatory phenotype similar to that of caerulein-treated WT acini.
Figure 3. The Nr5a2 transcriptional switch.

a,b, Dynamic gene expression (Nr5a2+/− vs. Nr5a2+/+) after one dose of caerulein, using RT-qPCR. Data referred to basal values in WT pancreata (n=4/group) (two independent experiments). c, ChIP-qPCR showing differential promoter occupancy by Nr5a2 in basal conditions (n=3/group). d, ChIP-qPCR showing Nr5a2 switching from the promoter of pancreatic genes to the promoter of inflammatory genes after one caerulein dose in WT mice (black, pancreatic genes; orange, AP-1; blue, inflammatory genes) (n=3/group). (two independent experiments). e, Co-immunoprecipitation/western blot showing that Nr5a2 and c-Jun are part of the same complex in Nr5a2+/− pancreata in basal conditions and in WT mice after one dose of caerulein, but not in basal conditions (at least two independent experiments). f, Sequential ChIP-qPCR of c-Jun/Nr5a2 and Nr5a2/c-Jun to assess promoter binding in WT pancreata in basal conditions and 1 h post-caerulein (see Extended Data Figure 7) (n=3 pools of 3 pancreata). Statistical analysis (f), one-sided Mann-Whitney test; * P<0.05, ** P<0.01. g, Proposed model of the Nr5a2 transcriptional switch. In basal conditions in WT mice, Nr5a2 is bound to acinar gene promoters as well as to the promoter of Nr0b2, a Nr5a2 co-repressor. In this condition, AP-1 proteins show weak binding to inflammatory gene promoters. By contrast, in untreated Nr5a2+/− mice, and in WT mice that have received caerulein, Nr5a2 is weakly bound to the promoter of acinar genes but shows increased binding to the promoters of c-Fos, Fosl1, and inflammatory genes, where AP-1 proteins also show increased binding. The redistribution of Nr5a2 and AP-1 to the two types of genes in Nr5a2 WT mice upon caerulein administration is transient. Nr0b2 levels are reduced in untreated Nr5a2+/− mice and in WT mice that have received caerulein, and this is accompanied by reduced binding to AP-1 promoters, suggesting its participation in the regulation of AP-1 gene expression.
A large fraction of inflammatory gene promoters contain putative Nr5a2 binding sites that are not occupied in normal pancreas (Fig. 2a, not shown). Accordingly, we performed ChIP-qPCR on the promoter of bona fide Nr5a2 target differentiation-related genes (i.e. digestive enzymes) and of inflammatory genes up-regulated in Nr5a2+/− mice. In untreated WT mice, Nr5a2 binding at the promoter of differentiation genes - but not at the promoter of inflammatory genes - was observed (Fig. 3c). However, in untreated Nr5a2+/− mice, Nr5a2 binding to differentiation gene promoters was reduced whereas binding to inflammatory gene promoters was increased. We designate this relocation of Nr5a2 between gene sets “the Nr5a2 transcriptional switch”. A similar transcriptional switch occurred in WT mice 30 min after one dose of caerulein and the genomic distribution of Nr5a2 was restored 12 h later (Fig. 3d), supporting its physiological relevance. Nr5a2 can interact with c-Jun in vitro 13 and we found that both proteins co-immunoprecipitated in the pancreas of untreated Nr5a2+/− mice and in WT mice 1 h after caerulein administration, but not in untreated WT mice (Fig. 3e). Using sequential ChIP-qPCR, Nr5a2 and c-Jun were detected on the same immunoprecipitated chromatin regions at the promoters of C1qb, Ccl7, and Ccl8 in untreated Nr5a2+/− mice and in WT mice 1 h after caerulein administration, supporting that c-Jun and AP-1 cooperate in the Nr5a2 transcriptional switch (Fig. 3f, Extended Data Fig. 7).
Nr0b2 is a Nr5a2 co-repressor and target gene 14 that is highly expressed in acinar cells, shows reduced expression in Nr5a2+/− pancreata, and is dynamically regulated upon caerulein administration (Extended Data Fig. 8a-e). In humans, NR0B2 mRNA expression was significantly higher in NR5A2high pancreata (P=1.4 e-7) and NR5A2 and NR0B2 levels were positively correlated (R2 = 0.312) (Extended Data Fig. 8f), suggesting a contribution to the haploinsufficient phenotype. In basal conditions in WT mice, Nr0b2 was absent from the promoter of differentiation and inflammatory genes but it was enriched in the promoter of c-Jun, Junb and Jund (Extended Data Fig. 8g). Nr5a2+/− pancreata displayed reduced Nr0b2 levels, lower occupancy of AP-1 promoters by Nr0b2, reduced binding of Nr5a2 at the Nr0b2 promoter, and reduced complexing of Nr5a2 with Nr0b2 (Extended Data Fig. 8c,g,h,i), suggesting that Nr0b2 normally represses AP-1 expression. We validated 266–6 acinar cells as a model to assess the effects of caerulein on AP-1 and inflammatory genes (Extended Data Fig. 9a-c): upon Nr0b2 expression, c-Jun mRNA – but not inflammatory transcripts - were reduced and Nr0b2 knock-down modestly increased Nr5a2 occupancy of inflammatory gene promoters (Extended Data Figs. 9d,e). The effects of Nr5a2 knock-down on c-Jun and inflammatory gene expression were abrogated by Nr0b2 overexpression (Extended Data Fig. 9f), supporting the notion that Nr5a2 modulates AP-1 expression, in part, through Nr0b2 down-regulation.
AP-1 up-regulation, increased binding to inflammatory gene promoters in Nr5a2+/− mice, and the interaction of c-Jun and Nr5a2, suggest a crucial involvement of c-Jun in the basal pre-inflammatory state. c-Jun deletion in Nr5a2+/− pancreata rescued the up-regulation of AP-1 and inflammatory transcripts, as well Nr5a2 binding to AP-1 and inflammatory gene promoters without affecting Nr5a2 expression (Fig. 4a-d). Upon induction of acute pancreatitis, Nr5a2+/−;c-JunΔP mice showed reduced damage when compared with control Nr5a2+/− mice (Fig. 4e,f). The normalization of the dynamic expression of AP-1 components during pancreatitis in Nr5a2+/−;c-JunΔP pancreata suggests a critical role of c-Jun. Immunohistochemical analysis showed that the down-regulation of c-Jun occurred selectively in acinar cells (Fig. 4g, Extended Data Fig. 10). Altogether, these results indicate that c-Jun is required for the pre-inflammatory state observed in Nr5a2+/− pancreata.
Figure 4. Pancreatic deletion of c-Jun rescues the pancreatic defect of Nr5a2+/− mice.
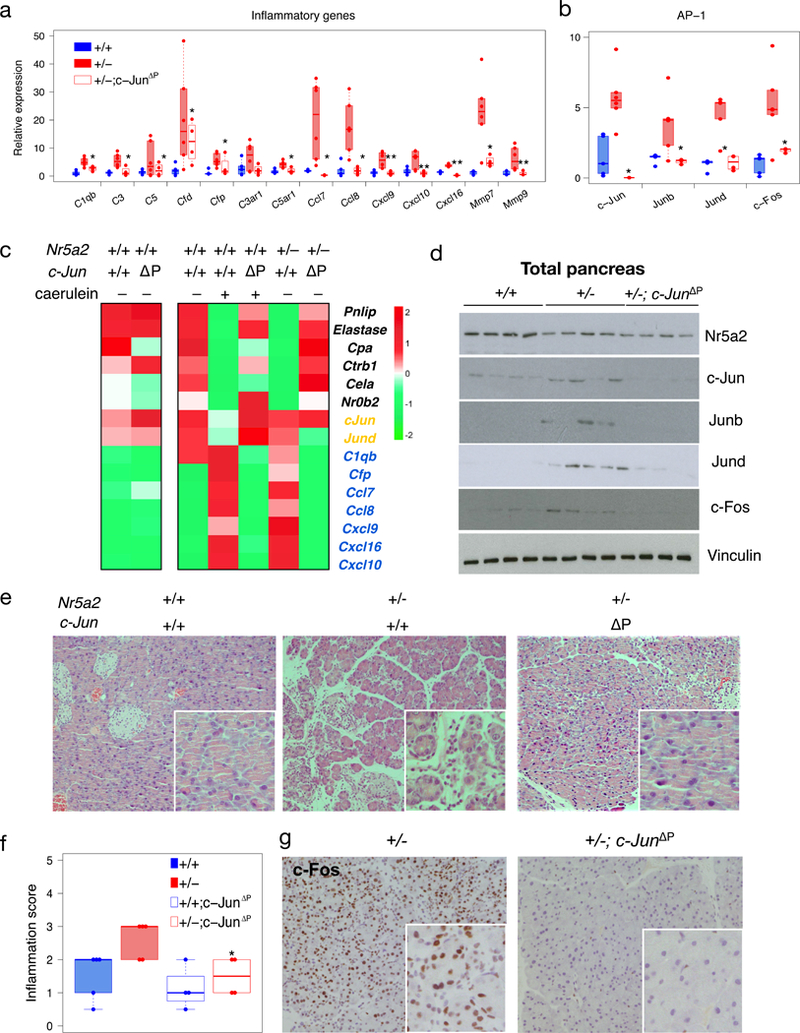
a,b, RT-qPCR analysis of inflammatory gene and AP-1 transcripts in the pancreas of WT, Nr5a2+/−, and Nr5a2+/−;c-JunΔP mice. Panels a and b refer to basal values in WT mice (n≥4). c, ChIP-qPCR shows that the Nr5a2 transcriptional switch is reversed upon c-Jun deletion in the pancreas (n= pool of 3 pancreata). This experiment was performed once. d, Western blots showing the expression of NR5A2 and AP-1 in Nr5a2+/+, Nr5a2+/−, and Nr5a2+/−;c-JunΔP pancreata (n=4/group). e, Histology of Nr5a2+/+, Nr5a2+/−, and Nr5a2+/−;c-JunΔP pancreata 48 h after induction of an acute pancreatitis shows that c-Jun deletion rescues the excessive damage caused by Nr5a2 haploinsufficiency (n≥4/group). All experimental data were obtained in a single experiment. f, Inflammation scores corresponding to the experiment in panel e (n≥4/group). g, Immunohistochemistry of c-Fos in Nr5a2+/−, and Nr5a2+/−;c-JunΔP pancreata 48 h after induction of an acute pancreatitis (n=4/group; representative results of one pancreas). Statistical analysis (a,b,f), one-sided Mann-Whitney test; * P<0.05, ** P<0.01.
In homeostatic conditions, tissue inflammation is supressed but a direct link between differentiation and inflammatory programmes has not been proposed. Here, we demonstrate that Nr5a2 critically restrains inflammation in normal mouse pancreas. Constitutive loss of one Nr5a2 allele leads to a pre-inflammatory state that can explain how haploinsufficiency primes tissue for damage and delays recovery, possibly contributing to accelerated tumorigenesis 11. This pre-inflammatory state is mediated by c-Jun phosphorylation and stabilization, hallmarks of c-Jun activation 15. In Nr5a2+/− mice, low Nr5a2 and Nr0b2 expression likely determine AP-1 dysregulation, as occurs upon induction of pancreatitis, contributing to inflammatory gene expression (Fig. 3g). In the pancreas, AP-1 is pro-inflammatory, unlike what has been found in the skin where c-Jun and Junb deletion in keratinocytes induces inflammatory phenotypes 16, supporting context-dependent and tissue-specific effects of AP-1 17,18. The output of the interaction of Nr5a2, Nr0b2, and AP-1 with gene regulatory elements is likely modulated by post-transcriptional modifications and chromatin accessibility: in keratinocytes, the coordinated regulation of Polycomb and AP-1 proteins ensures canonical expression of epidermal genes during differentiation 19.
We find chemokines and complement components among the inflammatory genes most prominently up-regulated in Nr5a2+/− pancreata. The control of inflammation from epithelial cells at the level of chemotactic stimuli suggests that leukocyte migration to tissues leads to the local up-regulation of cytokines, such as IL1, IL6, and TNF, which then contribute to amplify and prolong the inflammatory response 20. The findings in Nr5a2+/− pancreata indicate that inflammation is actively repressed in normal epithelial cells, and that the genetic pre-inflammatory phenotype mimics the molecular events associated with response to environmental/pharmacological stimuli (i.e. caerulein). Indeed, both conditions are associated with a dramatic switch of the chromatin distribution of Nr5a2, which shifts from the promoters of pancreatic differentiation genes to those of inflammatory genes. Our findings in mice are relevant to human pancreatitis and PDAC as shown by the shared transcriptomic changes, indicative of a pre-inflammatory state in the pancreas of human subjects with low NR5A2 mRNA levels and by the association with low levels of NR5A2 and NR0B2. Although additional work is needed to firmly establish the functional consequences of carrying PDAC risk alleles at chr1q32.1, our results indicate that the underlying biology at this locus may involve negative regulation of NR5A2 expression.
Methods
Mice and experimental manipulations.
The following mouse strains were used: Nr5a2+/−21, conditional floxed c-Jun 22, conditional floxed Nr5a2 23, LysCre24, and Ptf1aCre/+ knock-in mice (a kind gift of C. V. Wright, Vanderbilt University, Nashville, TN, USA) 25. Pancreas-specific Nr5a2-heterozygous and c-Jun–deficient mice were generated by crossing Nr5a2lox/+ and c-Junlox/lox mice with Ptf1aCre/+ mice, respectively. All crosses were maintained in a predominant C57BL/6 background. Littermate control mice were used. All experiments were performed using 8–14 week-old mice. All animal procedures were approved by local and regional ethics committees (Institutional Animal Care and Use Committee and Ethics Committee for Research and Animal Welfare, Instituto de Salud Carlos III, Madrid, Spain) and performed according to the European Union guidelines. After mice were sacrificed by cervical dislocation, the pancreas was removed quickly and placed in buffered formalin for histological analysis or homogenised in denaturing buffer (4M guanidine thiocyanate, 0.1M Trizma HCl pH 7.5, 1% 2-mercaptoethanol) for RNA extraction. In addition, a small piece was snap-frozen for protein isolation.
A mild acute pancreatitis was induced by seven hourly injections of the CCK analog caerulein (Bachem) at 50 μg/kg. Briefly, animals were weighted before the beginning of the procedure and caerulein was administered i.p. Mice were sacrificed by cervical dislocation 8, 24, and 48 h after the first injection. For the single injection protocol, mice received a single dose of caerulein (50 μg/kg) administered i.p. Mice were sacrificed by cervical dislocation at the indicated time points.
The number of mice used in each experiment is shown in the legend of each Figure. For most experiments, at least 5 mice/group were used; when different numbers of mice were included in each group, the lowest number is provided. No specific randomization method was used.
Acinar cell isolation.
Acinar cells were isolated by collagenase digestion and maintained at 37°C in Dulbecco´s modified Eagle medium containing 2% bovine serum albumin and 10 mM 4-(2-hydroxyethyl)-1-piperazine ethanesulfonic acid as described earlier 26. Acini were treated either with caerulein (100 pM) or with saline for 24 h prior to RNA and protein isolation.
Immunofluorescence and immunohistochemical analyses.
Immunofluorescence and immunohistochemical analyses were performed using 3 μm sections of formalin-fixed paraffin-embedded (FFPE) tissues, unless otherwise indicated. After deparaffinization and rehydration, antigen retrieval was performed by boiling in citrate buffer pH 6 for 10 min. For immunofluorescence, the sections were incubated for 45 min at room temperature (RT) with 3% BSA/PBS, then with the primary antibody overnight at 4°C. For double or triple immunofluorescence, the corresponding antibodies were added simultaneously and incubated overnight at 4°C. Sections were then washed with 0.1% Triton/PBS, incubated with the appropriate fluorochrome-conjugated secondary antibody, and nuclei were counter-stained with DAPI. After washing with PBS, sections were mounted with Prolong Gold Antifade Reagent (Life Technology).
For immunofluorescence quantification of Cd45+ cells, fresh-frozen tissues were used. Sections were fixed with 4% paraformaldehyde for 10 min at RT with gentle rotation, washed with PBS and incubated with 3% BSA/0.1% Triton/PBS for 45 min at RT, followed by overnight incubation with primary antibodies recognizing Ptf1a and Cd45 (NB110–93609). After washing with PBS, sections were incubated with the appropriate fluorochrome-conjugated secondary antibodies, and nuclei were counter-stained with DAPI. After washing with PBS, sections were mounted as described. Images were analyzed with Definiens Developer XD v2.5 software (Definiens): a custom made script was developed for single cell segmentation. Afterwards, cells were classified in the different subtypes by calculating the nuclear and cytoplasmic intensity of the different markers. Due to the low amount of marker-positive cells, a picture gallery of all single positives was generated and false-positive images were blindly manually discarded by one of the co-authors (DM) for maximum accuracy. There were no differences between wild type and Nr5a2+/− mice and only the raw, uncurated, results are shown in Extended Data Fig. 2e.
For immunohistochemical analyses, after antigen retrieval, endogenous peroxidase was inactivated with 3% H2O2/methanol for 30 min at RT. Sections were incubated with 2% BSA/PBS for 1 h at RT, and incubated with the primary antibody. After washing, the Envision secondary reagent (DAKO) was added for 40 min at RT and sections were washed three times with PBS. 3,30-diaminobenzidine tetrahydrochloride (DAB) was used as a chromogen. Sections were lightly counterstained with hematoxylin, dehydrated, and mounted. A non-related IgG was used as a negative control.
To identify ductal cells, the Dolichos biflorus agglutinin (DBA)-streptavidin visualization system was used (Discovery DAB Map Kit, RUO, Ventana). Sections were incubated with biotinylated DBA (1:1000; Vector Laboratories B-1035), washed, and incubated with streptavidin-peroxidase. Reactions were developed using DAB. Histological images were acquired with a Nikon TE2000 microscope and the percentage of cells expressing DBA was quantified.
To quantify Cd45+ leukocytes using immunohistochemistry, an automated immunostaining platform was used (Ventana Discovery XT, Roche). Antigen retrieval was first performed with boiling citrate buffer pH 6.0, endogenous peroxidase was blocked and slides were incubated with rat monoclonal anti-CD45 (5C16, 1:500; Novus Biologicals, NB110–93609). Slides were incubated with the corresponding secondary antibodies (biotinylated rabbit anti-rat Ig, Vector Labs) and visualization systems (OmniRabbit, Ventana, Roche) conjugated with horseradish peroxidase. Immunohistochemical reactions were developed using DAB and nuclei were counterstained with hematoxylin. Finally, the slides were dehydrated, cleared, and mounted for microscopic evaluation. Whole digital slides were acquired with a scanner (Axio Scan Z1, Zeiss) and images captured with the Zen Software (Zeiss). Image analysis and quantification were performed using with the AxioVision software package (Zeiss). After ROI (Regions of interest) selection, areas were selected for quantification and exported as subsets .TIFF images. The images with artifactual staining or cutting artifacts were eliminated. Afterwards, the different images from all slides were chosen for automatic quantification (AxioVision 4.6 software package, Zeiss) using a script for each antibody. For Cd45 quantification, positivity was evaluated in one phase (phase 1, positive) and compared with total tissue area (phase 2). The output results were then exported as excel files with scoring data for each .TIFF file. Data obtained was then compiled and appropriately assessed.
Histological scoring of mouse pancreata.
Inflammation-related histological parameters (oedema, inflammatory cell infiltration, acino-ductal metaplasia) were scored blindly according to the grade of severity (0–3).
Flow cytometry analysis of inflammatory cells.
Briefly, mouse pancreata were injected in situ with collagenase P (1 mg/mL) (Roche), transferred to cold collagenase and minced. After incubating at 37°C for 20 min with mild shaking, collagenase was inactivated with 5% cold FBS in HBSS and the pancreas was disaggregated and filtered twice through a 70 μM strainer. After centrifugation for 2 min at 300g and resuspension (2% chelated FBS, 2 mM EDTA, supplemented with DNase in HBSS) (Ambion), live cells were counted, incubated with blocking buffer, and subsequently with primary antibody for 1 h at RT. Cell suspensions were analyzed through a FACS ARIA Ilu sorter coupled to a LSR Fortessa analyzer with 10 different markers (Fig 1F and Extended Data Fig. 2d). Mice with low counts of total live cells were not considered in the analyses. For each condition, ≥5 mice were used.
RNA-seq and data processing (mouse).
Total pancreatic RNA was isolated using guanidine thiocyanate, followed by acid phenol-chloroform extraction. RNA Integrity Numbers (RIN) ranged from 6.6–9.2 when assayed by Lab-chip technology on an Agilent 2100 Bioanalyzer. PolyA+ RNA was extracted and randomly fragmented, converted to double stranded cDNA and processed through subsequent enzymatic treatments of end-repair, dA-tailing, and ligation to adapters as in Illumina’s “TruSeq RNA Sample Preparation Guide” (Part # 15008136 Rev. A; for samples Big104, Big90, Big92, Big18, Big277, Big278, Big33, Big87, Big94, Big113, Big17, Big86) or Illumina’s “TruSeq RNA Sample Preparation v2 Protocol” (Part # 15026494 Rev. C; for samples Big408, Big409, Big410, Big416, Big417, Big423, Big454, Big459, Big461, Big465, Big467 and Big470). Adapter-ligated library was completed by limited-cycle PCR with Illumina PE primers (10 cycles or 8 for samples v2 protocol). The resulting purified cDNA library was applied to an Illumina flow cell for cluster generation (TruSeq cluster generation kit v5) and sequenced on the Genome Analyzer IIx with SBS TruSeq v5 reagents by following manufacturer’s protocols. For each genotype (wild type or Nr5a2+/−) and condition (baseline, 8 h, 24 h and 48 h after pancreatitis induction), 3 pancreata were analyzed.
Image analysis and per-cycle base-calling were performed with Illumina Real Time Analysis software (RTA1.13). Conversion to FASTQ read format with the ELAND algorithm (v2e) was performed with CASAVA-1.8 (Illumina). These files contain only reads that passed “chastity” filtering (tagged with a ‘N’, for *NOT filtered* in the sequence identifier line). Quality check was done via fastqc (v0.9.4, Babraham Bioinformatics) and raw reads were aligned to the NCBI37/mm9 version of the mouse genome. Tophat5 (version 2.0.4) was used for alignment with the following parameters: --bowtie1, --max-multihits 5, --genome-read-mismatches 1 --segment-mismatches 1 -- segment-length 20 --splice-mismatches 0. Gene expression was quantified with cufflinks (version 2.0.2) with the following parameters: -N, -u. Further, gene expression values were normalized for library size with cuffnorm following parameters: -o -L --library-norm-method classic-fpkm. Cuffdiff was used to find differential gene expression among conditions with the following parameters: -num-threads 16, -multi-read-correct, -frag-bias-correct. Differentially expressed genes were considered with q-value <0.05 (adjusted p-values found using an optimized FDR approach).
ChIP-Seq data processing.
SRR389293 and SRR389294 images were downloaded from the Gene Expression Omnibus website 6. Quality check was done via fastqc (v0.9.4, Babraham Bioinformatics). ChIP-seq reads were aligned to the mouse reference genome (mm9, NCBI37, July 2007) with Burrows-Wheeler Aligner (bwa,v0.5.9-r16) allowing 0–1 mismatches. Uniquely aligned reads were converted to BED format. Macs14 (v1.4.1 20110622) was used for peak calling using the following parameters: -t SRR389393, -c SRR389294 -f BED -g mm. Other parameters were used as default. PeakAnalyzer 1.4 was used to annotate Nr5a2 binding sites. Motif enrichment was identified with the MEME suite using the default parameters. Reads were directionally extended to 300 bp and, for each base pair in the genome, the number of overlapping sequence reads was determined and averaged over a 10 bp window to create a wig file to visualize the data in the University of California Santa Cruz (UCSC) genome browser.
Principal component analysis (PCA).
Pearson correlation was calculated from the expression value (FPKM) of each gene for each sample by using the “cor” command in R. PCA qa performed using the “prcomp” command in R, from the correlation value of each sample.
Gene set enrichment analysis (GSEA).
The list of genes was ranked by the “t-stat” statistical value from the cuffdiff output file. The list of pre-ranked genes was then analysed with GSEA for Gene Ontology (GO) database. Significantly enriched GO terms were identified using an FDR q-value <0.25. The analyses were carried out as defined in http://www.broadinstitute.org/gsea/doc/GSEAUserGuideFrame.html?Interpreting_GSEA.
Singular enrichment analysis.
The differentially expressed gene sets were computed at the molecular signature dataset of GSEA, using the Biological Processes dataset.
Human transcriptome RNA-Seq analysis.
Histologically normal fresh frozen pancreatic tissue samples (n=95) either from patients with pancreatic cancer (n=79) (Mayo Clinic, Rochester, MN; Memorial Sloan Kettering Cancer Center, New York, NY) or from organ donors (n=16) (Penn State College of Medicine, Hershey, PA and Gift of Life Donor Program, Philadelphia, PA) were used. Histological review was performed at each participating institution. Subjects of self-reported non-European ancestry and those with history of neo-adjuvant therapy prior to surgery were excluded from the study. All relevant ethical regulations were followed. The project was approved by the Institutional Review Boards of Memorial Sloan-Kettering Cancer Center, Mayo Clinic, Penn State, and Georgetown Universities; exemption for the work with human tissue samples at NIH was approved by the NIH Office of Human Subject Research, Bethesda. Human samples were anonymized. Written informed consent was obtained from the human subjects.
RNA was isolated with the mirVana kit (Ambion). Samples with RIN scores >7.5 (1 μg) were subject to massive parallel paired-end sequencing on the Illumina HiSeq2000 sequencing platform (TruSeq v3 chemistry) at the National Cancer Institute’s CCR Sequencing Facility, as previously described 27. Read alignment (MapSplice) and gene expression quantification [in transcripts per million (TPM), RSEM version 1.2.14] was performed using settings and reference data published by The Cancer Genome Atlas (TCGA) University of North Carolina pipeline and the “UCSC gene” track (hg19/GRCh37) for gene annotation. (https://cghub.ucsc.edu/docs/tcga/UNC_mRNAseq_summary.pdf) 28,29. We compared human samples in the top and bottom quartile of NR5A2 mRNA levels for expression of genes identified as differentially expressed in the two mouse strains (log2-fold change >1 or <−1) and a set of random genes; only those genes for which a bona fide orthologue was found in the human genome were included: up-regulated (n=718) and down-regulated (n=64). A random list of genes was used for comparison (n=173). Logistic regression models based on upper quantile normalized TPM expression values were conducted using R/Bioconductor with adjustments for age, gender, and study.
Expression quantitative trait locus (eQTL) analysis.
Protein eQTL analysis was conducted using human PDAC tissue samples from patients of European ancestry by assessing NR5A2 protein levels in FFPE tissue samples (n=110) on tissue microarrays generated at the Mayo Clinic. Immunohistochemistry was performed with rabbit polyclonal anti-NR5A2 antibodies (HPA005455, Sigma) at 1/300 dilution. NR5A2 staining was scored based on intensity (on a scale from 0–3; 0, negative; 1, weak; 2, positive; 3, strong) and the proportion of reactive cells (0–100%). Histoscore was calculated as (staining intensity * percentage cells). When more than one core was available from a given tumor, the average score was used. TaqMan genotyping for the SNP marking the PDAC risk locus on chr1q32.1 in NR5A2 (rs3790844; genotyping assay: C__27483560_10, Thermo Fisher) was performed on blood DNA from the same patients. Protein eQTLs were assessed by linear regression for additive genetic effects on NR5A2 expression based on average histoscore and quantiles of average histoscore (group 1: histoscore < 120; 2: 120 - < 150; 3: 150 - < 170; 4: 170 - < 210 and 5: 210+) with adjustments for age, gender, BMI and TMA slide. Comparison of genotypes and NR5A2 expression was performed using average histoscore quantiles. The Institutional Review Boards of the participating institutions approved the project.
Quantitative RT-PCR.
Total RNA was treated with DNase I (Ambion, Austin TX, USA) for 30 min at 37°C and cDNAs were prepared according to the manufacturer’s specifications, using the TaqMan® reverse transcription reagents (Applied Biosystems, Roche). RT-qPCR analysis was performed using the SYBR Green PCR master mix and an ABIPRISM 7900HT instrument (Applied Biosystems). The sequence of the primers used is provided in Supplementary Table 4. Expression levels were normalized to endogenous Hprt mRNA levels using the ΔΔCt method. The results shown are representative of at least four biological replicates
Immunoprecipitation and western blotting.
For immunoprecipitation of proteins from fresh total pancreas lysates, a piece of mouse pancreas was isolated and minced in 50mM Tris-HCl pH 8, 150mM NaCl, 5mM EDTA, 0.5% NP-40 containing 3X phosphatase inhibitor cocktail (Sigma) and 3X EDTA-free Complete protease inhibitor cocktail (Roche Diagnostics, Germany). Lysates were briefly sonicated until the protein solution was clear, cleared for 10 min at 11000 rpm at 4°C, and the supernatant was recovered.
Antibody-coated Protein A or protein G Dynabeads (Life Technology) were used for immunoprecipitation. In brief, beads were washed 3 times with PBS and incubated with anti-Nr5a2 or normal goat IgG overnight at 4°C. After washing 3 times with PBS and twice with coupling buffer (27.3 mM sodium tetraborate, 72.7 mM boric acid), the dry beads were incubated overnight at 4°C in freshly prepared 38 mM dimethyl pimelimidate dihydrochloride in 0.1 M sodium tetraborate. Afterwards, beads were washed 3 times with coupling buffer and once with 1 M Tris pH 9. Then, 1 mL of the Tris solution was added to the beads and incubated for 10 min at RT with rotation to block amino groups and stop crosslinking. Finally, beads were washed 3 times with storage buffer (6.5 mM sodium tetraborate/boric acid) and stored at 4°C until used. Protein lysates (1–5 mg, cells; 10–15 mg, tissues) were then incubated overnight at 4°C with antibody-coated Dynabeads (Thermofisher). Bound immune complexes were washed twice with NP-40-containing lysis buffer and eluted by boiling in 2X Laemmli buffer for 5 min.
For co-immunoprecipitation from transfectants, HEK293 cells transfected with the corresponding plasmids were lysed in 50mM Tris-HCl pH 8, 150mM NaCl, 5mM EDTA, 0.5% NP-40 for 30 min at 4°C. After a brief sonication, cells were cleared by centrifugation for 10 min at 11000 rpm and the supernatant was recovered. Lysates were pre-cleared with proteinA/G agarose beads and 2 μg of normal rabbit IgG (SIGMA) and then immunoprecipitated with anti Flag-M2 affinity gel (A2220), EZview™ Red anti-HA (E6779) (Sigma) for 2 h at 4°C. The immune complexes were then pelleted by centrifugation and washed twice in NP-40 lysis buffer for 10 min at 4°C. After washing, 2X Laemmli buffer was added and a fraction of the material eluted by boiling was loaded onto a SDS-PAGE and processed for western blotting. For immunoprecipitation with anti-Nr5a2, antibody (2 μg) was added and incubated overnight.
For western blotting, proteins were extracted from pancreatic tissue, isolated acinar cells, or cultured cells using either Laemmli buffer [10% glycerol, 2% sodium dodecyl sulfate, 0.125M Tris-HCl pH 6.8] or lysis buffer (50 mM Tris-HCl pH 8, 150 mM NaCl, 5 mM EDTA, 0.5% NP-40) supplemented with protease inhibitor and phosphatase inhibitor cocktails. Protein concentration was measured using the BCA reagent (Biorad) or extrapolated when using Laemmli lysis buffer. Proteins were resolved by either standard SDS-PAGE or 4–20% TGX Pre-cast gels (Biorad) and transferred onto nitrocellulose membranes. The antibodies used are listed in Life Sciences Reporting Summary. Densitometry analysis of digitalised western blotting images was performed using FiJi software (NIH, Bethesda, MD, USA).
Chromatin immunoprecipitation (ChIP).
Pancreas tissue was minced, washed with cold PBS supplemented with 3X protease and phosphatase cocktail inhibitors, and fixed with 1% formaldehyde for 20 min at RT. Glycine was added to a final concentration of 0.125 M for 5 min at RT. The fixed tissue was soaked in SDS buffer (50 mM Tris pH 8.1, 100 mM NaCl, 5 mM EDTA, 0.5% SDS) and homogenised using a douncer. The supernatant was collected after centrifugation and the chromatin was sonicated with a Covaris instrument for 40 min (20% duty cycle; 10% intensity; 200 cycle), yielding DNA fragments with a bulk size of 300–500 bp. Samples were centrifuged to pellet cell debris. The amount of chromatin isolated was quantified using Nanodrop; an aliquot of this material was used as input for final quantification. Samples (0.5–1 mg of chromatin) were diluted with Triton buffer (100 mM Tris pH 8.6, 0.3% SDS, 1.7% Triton X-100, and 5 mM EDTA) to 1 mL and pre-cleared for 2 h with a mix of protein A/G (previously blocked with 5% BSA) at 4°C. Antibody-coated beads were added [anti-Nr5a2 (1 μg), anti-c-Jun (1 μg), anti-Junb (1 μg), anti-c-Fos (5 μg), anti-Jund (2 μg), anti-H3K27ac (1 μg), and anti-H3K27me3 (1 μg)]. Non-related IgG was used as a control. After incubating for 3 h at 4 °C in a rotating platform, beads were successively washed with 1 mL of mixed micelle buffer (20 mM Tris pH 8.1, 150 mM NaCl, 5 mM EDTA, 5% w/v sucrose, 1% Triton X-100, and 0.2% SDS), buffer 500 (50 mM HEPES at pH 7.5, 0.1% w/v deoxycholic acid, 1% Triton X-100, 500 mM NaCl, and 1 mM EDTA), LiCl detergent wash buffer (10 mM Tris at pH 8.0, 0.5% deoxycholic acid, 0.5% NP-40, 250 mM LiCl, and 1 mM EDTA), and TE (pH 7.5), and bound molecules were eluted by incubating overnight in elution buffer (containing 1% SDS and 100mM NaHCO3) at 65 °C, and treated with proteinase K solution (10 M EDTA, 40 mM Tris-HCl pH 6.5, 40 μg/mL proteinase K). The eluted DNA was purified by phenol-chloroform extraction. After isolation, pelleted DNA was resuspended in 150 μL of nuclease-free water. Gene occupancy was then analysed by real-time PCR using 1 μl of the eluted DNA diluted in a final volume of 10 μl. The sequence of the primers used for ChIP-PCR is provided in Supplementary Table 5.
Sequential ChIP (Seq-ChIP).
Chromatin from total pancreas was isolated as described above. Briefly, after the first round of immunoprecipitation, all beads were washed as described for the individual ChIP. Then, 10% of the beads were transferred to a new tube and de-crosslinked. The DNA was then extracted with phenol chloroform to check the efficiency of the first ChIP. For all steps involving immunoprecipitation, low protein-binding tubes were used (Eppendorf, 022431081). For Seq-ChIP, the immune complexes in the remaining 90% of beads were eluted by incubating for 30 min at 37°C in 90 μl of freshly prepared TE/10mM DTT, diluted to 2 mL with dilution buffer and incubated with anti-Nr5a2 and anti-c-Jun antibodies overnight at 4°C. Then, immune complexes were incubated with 40 μl of beads for 2–4 h at 4°C, washed, transferred to a fresh tube, and eluted as described for the individual ChIP.
Nr5a2 and Nr0b2 knock-down.
Nr5a2 expression was interfered using the Mission® shRNA lentiviral constructs purchased from Sigma [TRCN0000025966, targeting CCGGGCAGAAGACTACCTGTACTATCTCGAGATAGTACAGGTAGTCTTCTGCTTTTT (Nr5a2 sh1) and TRCN0000025985, targeting CCGGCCCACAACAGACTGAGAAATTCTCGAGAATTTCTCAGTCTGTTGTGGGTTTTT (Nr5a2 sh2)] previously tested for their efficiency. The knock-down efficiency was analysed by RT-qPCR and immunoblotting. Nr0b2 expression was interfered using the Mission® shRNA lentiviral constructs purchased from Sigma [TRCN0000027118, targeting CCGGCGTCCGACTATTCTGTATGCACTCGAGTGCATACAGAATAGTCGGACGTTTTT (Nr0b2 sh1)] and [TRCN0000027130, targeting CCGGCAAGGAGTATGCGTACCTGAACTCGAGTTCAGGTACGCATACTCCTTGTTTTT (Nr0b2 sh2)]. Control cells were transformed using scrambled vector (shNT).
HEK293-FT cells (ATCC, Rockville, MD) were used to produce lentiviral particles. Briefly, cells were allowed to reach 60% of confluence and transfected with 25 μg of shNT, sh1 or sh2 plasmids together with 30 μg of psPAX and 10 μg of pCMV-VSVG helper plasmids using CaCl2 2M HBSS, as described above. After 12 h, the supernatant was collected and replaced with 5 mL of fresh medium. Additionally, the supernatant was collected 24 h and 48 h after transfection. Media were filtered (0.45 μm pore) and added to 266–6 cells (at 50– 60% of confluence). After 3 rounds of infection, the supernatant was removed and replaced with fresh medium. After 1 day of recovery, puromycin (2μg/mL) (Sigma-Aldrich) was added. Two days later, the medium was replaced, and cells were collected for protein and RNA analysis after 24 h.
NR0B2 lentiviral overexpression.
The production of lentiviral particles and cellular infection were performed as described above. The media from the transfectants was collected 12, 24, and 48 h after transfection. Subsequently, 266–6 cells (obtained from Dr. I. Rooman, VUB, Brussels, Belgium) were infected using Polybrene (Hexadimethrine Bromide SIGMA 107689) (5μg/mL). After selection with puromycin, resistant 266–6 cells were collected for RNA and protein analysis.
For combined Nr5a2 knock-down and Nr0b2 overexpression, cells were first incubated with control sh or Nr5a2-targeting lentiviruses. After puromycin selection, resistant 266–6 cells were allowed to recover in fresh medium and incubated with media containing lentiviral particles for either empty vector or Nr0b2-Flag. Two rounds of infection were performed. After 24 h, the supernatant was removed and fresh medium was added. One day later, 266–6 cells were collected for protein and RNA analyses.
Cloning.
The Nr5a2 cDNA was amplified and Flag-tagged by PCR using the following primers: GGGAATTCATGGACTACAAGGACGACGATGACAAGTCTGGCTAGTTTGG and GGGGAATTCTTAGGCTCTTTTGGCATGCAGCA. The PCR product was ligated into the pJET vector and then sub-cloned into pLVX-puro. The human NR0B2 cDNA, tagged with a Flag epitope, was subcloned into the lentiviral vector pLVX-puro. The region encompassing −1960 to −655 of the mouse Ccl8 promoter was amplified by PCR and subcloned in pGL3-basic vector (Promega). The sequence of the inserts was confirmed by enzymatic digestion and Sanger sequencing.
Luciferase reporter assays.
HEK293T cells were transfected with plasmids pcDNA3-Nr5a2-Flag and c-Jun-HA, or the corresponding empty plasmids, together with pRL-TK (Promega, Madison, WI) constitutively expressing Renilla luciferase for normalisation and transfection efficiency control. Plasmids containing the Ccl8 promoter were included in all the experiments. The amount of transfected plasmids was maintained constant. Transfections were performed in triplicate using standard CaCl2 method. After 36 h, cells were lysed in passive lysis buffer (Luciferase kit, Promega E2920) and reporter activity was determined using the Dual-Glo Luciferase Assay system (Promega), following the manufacturer’s instructions. Firefly and Renilla luciferase activities were measured using a luminometer.
Other statistical analyses.
Comparisons of quantitative data between groups was performed using one-sided Mann-Whitney test in all cases when there was a prior hypothesis, except for the data shown in Fig. 1g and Extended Data Fig. 5a. Box plots represent the median and first and third quartiles of the data; error bars are generated by R software and represent the highest/lowest data within 1.5 interquartile range. All statistical analyses were performed with Excel or R software.
Data availability.
Mouse pancreas RNA-Seq data generated in this study have been deposited in GEO with accession number GSE84659. Source data for Figures 1–4 and Extended Data Figures 1–10 are provided with the online version of the paper. All other data are available upon reasonable request.
Extended Data
Extended Data Figure 1. Protein eQTL analysis in human PDAC.

Pancreatic tumors (n=110) from patients carrying the risk increasing (T) allele at rs3790844 express lower levels of NR5A2 protein than those carrying the protective (C) allele. NR5A2 expression was assessed using immunohistochemistry and a score based on percentage of reactive cells and intensity of staining. The analysis was performed for average histoscore (P=0.097, β=−18.0) and average histoscore quantiles (P=0.028, β=−0.57). Statistical analysis, two-sided Wilcoxon test.
Extended Data Figure 2. The pancreas of Nr5a2+/− mice is histologically normal but it displays increased expression of inflammatory genes.

a, RT-qPCR analysis of the expression of transcripts coding for acinar-related genes in wild type and Nr5a2+/− mice (n=7/group). Data were obtained from an independent series of mice than those used for RNA-Seq. b, Immunofluorescence analysis of Ptf1a, Cdh1, and Cpa in the pancreas of wild type and Nr5a2+/− mice (n=3/group). Arrow, acinus. c, Immunohistochemical analysis of expression of C5ar1 and Cfd in the pancreas of wild type and Nr5a2+/− mice shows patchy expression in acinar cells (arrows) (n=5/group). d, Percentage of inflammatory cell subtypes (from total cells) in wild type and Nr5a2+/− pancreata (n≥4/group) analysed by flow cytometry (two different experiments) e, f, Quantification of periacinar Cd45+ cells in the pancreas of wild type and Nr5a2+/− mice using immunofluorescence on frozen sections. Broken line to delineate a pancreatic lymph node, as control. Two independent assessments were performed. e, Quantification of cells expressing Pax5, Mac2 and Cd3 in the pancreas of wild type and Nr5a2+/− mice using immunofluorescence (n≥3/group). Statistical analysis (a,d,e), one-sided Mann-Whitney test; * P<0.05, ** P<0.01.
Extended Data Figure 3. The up-regulation of inflammatory markers, AP-1 components, p-Jun and p-JNK in Nr5a2+/− pancreata is epithelial cell-autonomous, as shown by the analysis of isolated primary acinar cells.

a, Expression of inflammatory proteins in primary acinar cells from wild type and Nr5a2+/− mice using western blotting (n=4/group). b-f, Primary acinar cell fractions from wild type and Nr5a2+/− mice are largely depleted of DBA+ ductal cells (b,c), show reduced expression of the ductal cell marker Hnf1-beta (d,e), and inflammatory cell markers (f) compared to total pancreas (n=4/group). Inset depicts DBA-labeled duct. Two independent experiments were performed. g,h, Expression of AP-1 components and JNK in primary acinar cells from wild type and Nr5a2+/− mice using western blotting. Nr5a2 is expressed at reduced levels in Nr5a2+/− pancreata (n=4/group). Statistical analysis (c-f), one-sided Mann-Whitney test; * P<0.05, ** P<0.01.
Extended Data Figure 4. The defective pancreatic response to damage is epithelial cell-autonomous.

a, Constitutive Nr5a2+/− mice display a more severe pancreatitis upon administration of 7 hourly doses of caerulein. b-d, This phenotype is recapitulated at 48 h in mice harboring a heterozygous deletion of Nr5a2 in pancreatic epithelial cells (b) but not in mice in which both alleles of Nr5a2 are inactivated in myeloid cells by Cre activation from the lysozyme (Lys) endogenous locus (d). This experiment was performed once for the conditional mice; for Nr5a2+/− mice, >4 independent experiments were performed. Representative histological images are shown. Semiquantitative inflammation scores corresponding to the experiments shown in panels a-d (n≥4/group). c, RT-qPCR analysis of the expression of transcripts coding for AP-1 and inflammatory genes in control and Ptf1aCre;Nr5a2lox/+ mice (n=6/group). Statistical analysis (a-d), one-sided Mann-Whitney test; * P<0.05, ** P<0.01.
Extended Data Figure 5. Nr5a2 haploinsufficiency causes a basal pre-inflammatory state similar to that associated with early stages of pancreatitis.

a, Comparative expression (WT vs. Nr5a2+/− mice) of the up-regulated (left panel), down-regulated (middle panel), or control (right panel) genes over time after induction of pancreatitis. RNA-Seq analysis was performed once. Statistical analysis, one-sided Student t test. b, Immunohistochemical analysis shows persistent over-expression of AP-1 components during the recovery period after induction of a 7-hourly acute pancreatitis. Representative results of one of 5 pancreata analyzed are shown.
Extended Data Figure 6. A single dose of caerulein does not cause inflammation but it induces an up-regulation of AP-1 and p-Jun that precedes Stat3 phosphorylation both in wild type and Nr5a2+/− mice.

a, Quantification of infiltration by Cd45+ cells in the pancreas of wild type and Nr5a2+/− mice after administration of one dose of caerulein (n=1). b, Immunohistochemical analysis of expression of c-Jun, c-Fos, p-Jun, and p-Stat3 in wild type and Nr5a2+/− mice at various time points after caerulein administration (n=4/group). c, RT-qPCR analysis of expression of a panel of inflammatory genes, among those up-regulated in Nr5a2+/− mice, in isolated acini treated with PBS or caerulein (100 pM). Data are referred to values of wild type acini incubated with PBS (n=4/group). Two independent experiments were performed. Statistical analysis (c), one-sided Mann-Whitney test; * P<0.05, ** P<0.01.
Extended Data Figure 7. Nr5a2 cooperates with AP-1 to regulate inflammatory gene expression.

a, Analysis of putative NR5A2 and AP-1 binding sites in the proximal promoter of C1qb, Ccc7, and Ccl8 using the JASPAR algorithm (http://jaspar.genereg.net/search?q=&collection=CORE&tax_group=vertebrates)). Sequence matrices for Nr5a2, Fos:Jun, Fos, Jun, Jun (var.2), Fosl1, Fosl2, and Batf:Jun were computed. Motifs with a score >7.5 for Nr5a2 (blue) and AP-1 (orange) are highlighted. Additionally, a manual search for the Nr5a2 binding motif CAAGGNCA was performed. Highlighted in purple are the genomic regions amplified in the sequential ChIP-qPCR experiments shown in Figure 4F. The sequences of the 400 nucleotides upstream and downstream of each amplicon are also shown. b, Ccl8 Luciferase promoter-reporter activity (−1960;−655) using HEK293 cells and increasing concentrations of c-Jun-coding plasmid in the absence (left) or presence (right) of Nr5a2. Data shown corresponds to the mean of 6 independent experiments. Statistical analysis (b), one-sided Mann-Whitney test; * P<0.05, ** P<0.01.
Extended Data Figure 8. Nr5a2 regulates AP-1 expression, in part, through the modulation of Nr0b2 and its recruitment to AP-1 gene promoters.

a, Expression of Nr0b1 and Nr0b2 transcripts in total pancreas and isolated acini of wild type and Nr5a2+/− mice (n=4/group). Arrow, acinus; broken line delineates an islet. b, Immunohistochemical and double immunofluorescence analysis showing acinar distribution of Nr0b2 in wild type pancreas and reduced expression in Nr5a2+/− pancreata. Acinar cells are delineated with anti-Cdh1 antibodies (n=5/group). c, Reduced expression of Nr0b2 mRNA and protein in total pancreas and isolated acini of wild type and Nr5a2+/− mice. Densitometric quantification of Nr0b2 expression relative to vinculin (n≥4/group). d,e, Expression of Nr0b2 mRNA in wild type mice upon induction of a mild acute pancreatitis (d) (n=3/group) or upon administration of a single dose of caerulein (e) (n≥3/group). f, Correlation of NR5A2 and NR0B2 mRNA expression in normal human pancreas using RNA-Seq. g, ChIP-qPCR analysis of the occupancy by Nr0b2 at the AP-1 (left) and inflammatory gene promoters (right panel) in WT and Nr5a2+/− mice. Data are referred to control IgG and an unrelated genomic region (n=3/group) (left, right panels). ChIP-qPCR analysis of Nr0b2 on the promoter of AP-1 genes shows reduced occupancy in wild type mice 1 h after administration of one dose of caerulein. Results in the middle panel are normalized to enrichment in wild type mice (n≥6/group). h, ChIP-qPCR analysis of the occupancy of the Nr0b2 promoter by Nr5a2 in wild type and Nr5a2+/− mice. Data are referred to control IgG and an unrelated genomic region (n≥5/group). i, Co-immunoprecipitation of Nr5a2 and Nr0b2 in wild type and Nr5a2+/− pancreata in basal conditions or 1 h after administration of a single dose of caerulein. Densitometric quantification of Nr0b2 bands (right) (n=3/group). At least two independent experiments were performed. Statistical analysis (a-i), one-sided Mann-Whitney test; * P<0.05, ** P<0.01.
Extended Data Figure 9. Nr0b2 plays an important role in the dynamic regulation of inflammatory genes by Nr5a2.

a-c, Validation of 266–6 cells as a model for mechanistic studies. a, Dose-dependent effects of caerulein on ERK activation, AP-1 expression, and Nr0b2 expression using western blotting. b, RT-qPCR analysis showing caerulein-induced changes in expression of Nr5a2, AP-1, and inflammatory genes. c, ChIP-qPCR analysis showing changes in Nr5a2 occupancy of the promoters of acinar (Ctrb1, Cpa, Nr0b2), c-Jun, and inflammatory genes (C1qb, Ccl7, Ccl8) 30 min after treatment with caerulein (4 independent experiments) These findings largely recapitulate the observations made in the mouse pancreas. d, Forced overexpression of Nr0b2 leads to reduced expression of c-Jun mRNA but does not affect expression of inflammatory genes (4 independent experiments). e, Effects of Nr0b2 knock-down on Nr5a2 binding to the promoter of acinar, c-Jun, and inflammatory genes (3 independent experiments). f, Combined Nr5a2 knock-down and Nr0b2 overexpression showing that higher levels of Nr0b2 are associated with reduced expression of inflammatory gene transcripts, a situation that mimics normal pancreas in basal conditions in wild type mice (4 independent experiments). At least two independent experiments were performed. Statistical analysis (c-f), one-sided Mann-Whitney test; * P<0.05, ** P<0.01.
Extended Data Figure 10. c-Jun is required for the overactivation of AP-1 observed in Nr5a2+/− mice during caerulein-mediated pancreatitis.

Immunohistochemical analysis of the expression of c-Jun, Junb, Jund, c-Fos, Fra1, and Fra2 in the pancreas of control (Nr5a2+/+, Nr5a2+/−, Nr5a2+/+;c-JunΔP) and Nr5a2+/−;c-JunΔP mice 48 h after the initiation of pancreatitis (n=4/group). One experiment was performed. Arrowhead, acinus; arrow, mesothelial cell.
Supplementary Material
Acknowledgements
We thank O. Domínguez, J. Herranz, T. Lobato, L. Martínez, C. Yolanda, CNIO core facilities, Epithelial Carcinogenesis and Genes, Development and Disease Group members for valuable contributions, L. Montuenga, C. Rodríguez-Ortigosa, and investigators cited for providing antibodies, and E. Batlle and P. Muñoz-Cánoves for critical comments. This study utilized the high-performance computational capabilities of the Biowulf Linux cluster at the NIH, Bethesda, MD (http://biowulf.nih.gov). The content of this publication does not necessarily reflect the views or policies of the Department of Health and Human Services, NIH, nor does mention of trade names, commercial products, or organizations imply endorsement by the U.S. Government.
Grants
This work was supported, in part, by: grants SAF2011–29530 and SAF2015–70553-R from Ministerio de Economía y Competitividad (Madrid, Spain) (co-funded by the ERDF-EU), RTICC from Instituto de Salud Carlos III (RD12/0036/0034, RD12/0036/0050), grants 256974 and 289737 from European Union Seventh Framework Program to FXR; grants BFU 2012–40230 and SAF2015–70857 from Ministerio de Economía y Competitividad (Madrid, Spain) (co-funded by the ERDF-EU) and Worldwide Cancer Research (13–0216) to EFW; grants PI12/00815 and PI1501573 from Fondo de Investigaciones Sanitarias (FIS), Instituto de Salud Carlos III, Spain and EUPancreas COST Action BM1204 to NM; the Intramural Research Program of the U.S. National Institutes of Health (NIH), National Cancer Institute, Bethesda, MD, U.S.A; and Mayo Clinic SPORE in Pancreatic Cancer funded by National Cancer Institute grant P50 CA102701. LT and TB were supported by the Department of Technology, Norwegian University of Science and Technology and the Central Norway Regional Health Authority, Trondheim, Norway, and by the European Science Foundation. PM and IC are recipients of Juan de la Cierva and Beca de Formación del Personal Investigador from Ministerio de Economía y Competitividad (Madrid, Spain), respectively. IF is recipient of a “Juegaterapia-Amigos del CNIO” Postdoctoral Fellowship. FXR acknowledges the support of Asociación Española Contra el Cáncer.
Footnotes
Author contributions
IC, MF and FXR conceived the study. IC, MF and NP performed animal experiments. IC, ECSP, MZ and JJ. conducted bioinformatics analyses. IC, VJSA and IF conducted in vitro studies using mouse cells. SO, JS, WRB, GMP and NM provided essential samples and information on human subjects. WRB, GMP, NM and LA designed and performed clinical studies, obtained samples and performed human data analysis. IM, DM, LT and TB were involved in data analysis. LB, KS and EW provided critical reagents. PM, LB, LA and EW had critical input into experimental design, data analysis and interpretation. IC and FXR. wrote the manuscript with contributions of PM, LB, LA and EW. FXR supervised the overall conduct of the study. All authors read and approved the final manuscript.
Author Information Reprints and permissions information is available at www.nature.com/reprints. The authors declare no competing financial interests. Readers are welcome to comment on the online version of the paper. Publisher’s note: Springer Nature remains neutral with regard to jurisdictional claims in published maps and institutional affiliations. Correspondence and requests for materials should be addressed to Francisco X. Real (preal@cnio.es).
References
- 1.Karin M, Clevers H Reparative inflammation takes charge of tissue regeneration. Nature 529, 307–315 (2016). [DOI] [PMC free article] [PubMed] [Google Scholar]
- 2.Grivennikov SI, Greten FR, Karin M Immunity, inflammation, and cancer. Cell 140, 883–899 (2010). [DOI] [PMC free article] [PubMed] [Google Scholar]
- 3.Crusz SM, Balkwill FR Inflammation and cancer: advances and new agents. Nat. Rev. Clin. Oncol 12, 584–596 (2015). [DOI] [PubMed] [Google Scholar]
- 4.Stein S, Schoonjans K Molecular basis for the regulation of the nuclear receptor LRH-1. Curr. Opin. Cell Biol 33, 26–34 (2015). [DOI] [PubMed] [Google Scholar]
- 5.Mamrosh JL, et al. Nuclear receptor LRH-1/NR5A2 is required and targetable for liver endoplasmic reticulum stress resolution. Elife 3, e01694 (2014). [DOI] [PMC free article] [PubMed] [Google Scholar]
- 6.Holmstrom SR, et al. LRH-1 and PTF1-L coregulate an exocrine pancreas-specific transcriptional network for digestive function. Genes Dev. 25, 1674–1679 (2011). [DOI] [PMC free article] [PubMed] [Google Scholar]
- 7.Molero X, et al. Gene expression dynamics after murine pancreatitis unveils novel roles of Hnf1a in acinar cell homeostasis. Gut 61,1187–1196 (2012). [DOI] [PubMed] [Google Scholar]
- 8.Hale MA, et al. The nuclear hormone receptor family member NR5A2 controls aspects of multipotent progenitor cell formation and acinar differentiation during pancreatic organogenesis. Development 141, 3123–3133 (2014). [DOI] [PMC free article] [PubMed] [Google Scholar]
- 9.Petersen GM, et al. A genome-wide association study identifies pancreatic cancer susceptibility loci on chromosomes 13q22.1, 1q32.1 and 5p15.33. Nat. Genet. 42, 224–228 (2010). [DOI] [PMC free article] [PubMed] [Google Scholar]
- 10.Amundadottir LT Pancreatic cancer genetics. Int J. Biol. Sci. 12, 314–325 (2016). [DOI] [PMC free article] [PubMed] [Google Scholar]
- 11.Flández M, et al. Nr5a2 heterozygosity sensitizes to, and cooperates with, inflammation in KRasG12V-driven pancreatic tumorigenesis. Gut 63, 647–655 (2014). [DOI] [PubMed] [Google Scholar]
- 12.Zhang M et al. Characterizing cis-regulatory variation in the transcriptome of histologically normal and tumour-derived pancreatic tissues. Gut PMID (2017). [DOI] [PMC free article] [PubMed] [Google Scholar]
- 13.Huang SC, Lee CT, Chung BC Tumor necrosis factor suppresses NR5A2 activity and intestinal glucocorticoid synthesis to sustain chronic colitis. Sci Signal. 7, ra20 (2014). [DOI] [PubMed] [Google Scholar]
- 14.Oiwa A, et al. Synergistic regulation of the mouse orphan nuclear receptor SHP gene promoter by CLOCK-BMAL1 and LRH-1. Biochem. Biophys. Res. Commun. 353, 895–901 (2007). [DOI] [PubMed] [Google Scholar]
- 15.Papavassiliou AG, Chavrier C, Bohmann D Phosphorylation state and DNA-binding activity of c-Jun depend on the intracellular concentration of binding sites. Proc. Natl. Acad. Sci. USA 89, 11562–11565 (1992). [DOI] [PMC free article] [PubMed] [Google Scholar]
- 16.Schönthaler HB, Guinea-Viniegra J, Wagner EF Targeting inflammation by modulating the Jun/AP-1 pathway. Ann. Rheum. Dis. 70 Extended Data 1:i109–112 (2011). [DOI] [PubMed] [Google Scholar]
- 17.Shaulian E, Karin M. AP-1 as a regulator of cell life and death. Nat. Cell. Biol. 4, E131–136 (2002). [DOI] [PubMed] [Google Scholar]
- 18.Eferl R, Wagner EF. AP-1: a double-edged sword in tumorigenesis. Nat. Rev. Cancer 3, 859–868 (2003). [DOI] [PubMed] [Google Scholar]
- 19.Ezhkova E, et al. Ezh2 orchestrates gene expression for the stepwise differentiation of tissue-specific stem cells. Cell 136, 1122–1135 (2009). [DOI] [PMC free article] [PubMed] [Google Scholar]
- 20.Headland SE, Norling LV The resolution of inflammation: Principles and challenges. Semin. Immunol. 27, 149–160 (2015). [DOI] [PubMed] [Google Scholar]
- 21.Botrugno OA, et al. Synergy between LRH-1 and beta-catenin induces G1 cyclin-mediated cell proliferation. Mol. Cell 15, 499–509 (2004). [DOI] [PubMed] [Google Scholar]
- 22.Behrens A, et al. Impaired postnatal hepatocyte proliferation and liver regeneration in mice lacking c-jun in the liver. EMBO J. 21, 1782–1790 (2002). [DOI] [PMC free article] [PubMed] [Google Scholar]
- 23.Coste A et al. LRH-1-mediated glucocorticoid synthesis in enterocytes protects against inflammatory bowel disease. Proc. Natl Acad. Sci. USA 104, 13098–13103 (2007). [DOI] [PMC free article] [PubMed] [Google Scholar]
- 24.Clausen BE et al. Conditional gene targeting in macrophages and granulocytes using LysMcre mice. Transgenic Res. 8, 265–277 (1999). [DOI] [PubMed] [Google Scholar]
- 25.Kawaguchi Y, et al. The role of the transcriptional regulator Ptf1a in converting intestinal to pancreatic progenitors. Nat. Genet. 32, 128–134 (2002). [DOI] [PubMed] [Google Scholar]
- 26.Cendrowski J, et al. Mnk1 is a novel acinar cell-specific kinase required for exocrine pancreatic secretion and response to pancreatitis in mice. Gut 64, 937–947 (2015). [DOI] [PubMed] [Google Scholar]
- 27.Hoskins JW, et al. Transcriptome analysis of pancreatic cancer reveals a tumor suppressor function for HNF1A. Carcinogenesis 2014 35, 2670–2678 (2014). [DOI] [PMC free article] [PubMed] [Google Scholar]
- 28.Li B, Dewey CN RSEM: accurate transcript quantification from RNA-Seq data with or without a reference genome. BMC Bioinformatics 12, 323 (2011). [DOI] [PMC free article] [PubMed] [Google Scholar]
- 29.Wang K, et al. MapSplice: accurate mapping of RNA-seq reads for splice junction discovery. Nucl. Acids Res. 38, e178 (2010). [DOI] [PMC free article] [PubMed] [Google Scholar]
Associated Data
This section collects any data citations, data availability statements, or supplementary materials included in this article.
Supplementary Materials
Data Availability Statement
Mouse pancreas RNA-Seq data generated in this study have been deposited in GEO with accession number GSE84659. Source data for Figures 1–4 and Extended Data Figures 1–10 are provided with the online version of the paper. All other data are available upon reasonable request.