

Abstract
Membrane fission is a fundamental process in the regulation and remodeling of cell membranes. Dynamin, a large GTPase, mediates membrane fission by assembling around, constricting and cleaving the necks of budding vesicles1. Here, we report a 3.75 Å resolution cryo-EM structure of the membrane-associated helical polymer of human dynamin-1 in the GMPPCP bound state. The structure defines the helical symmetry of the dynamin polymer and the positions of the oligomeric interfaces, which were validated by cell-based endocytosis assays. Compared to the lipid-free tetramer form2, membrane-associated dynamin binds to the lipid bilayer with its pleckstrin homology domain (PHD) and self-assembles across the helical rungs via the GTPase domain3. Notably, interaction with the membrane and helical assembly is accommodated by a severely bent bundle signaling element (BSE), which connects the GTPase domain with the rest of the protein. The BSE conformation is asymmetric across the inter-rung GTPase interface, and is unique compared to all known nucleotide-bound states of dynamin. The structure suggests that the BSE bends from forces generated from the GTPase dimer interaction that are transferred across the stalk to the PHD and lipid membrane. Mutations disrupting the BSE kink impaired endocytosis. We also report a 10.1 Å resolution cryo-EM map of a super-constricted dynamin polymer showing localized conformational changes at the BSE and GTPase domains induced by GTP hydrolysis that drive membrane constriction. Altogether, the results provide a structural basis for dynamin’s mechanism of action on lipid membrane.
Dynamin family members are mechanochemical GTPases that catalyze membrane remodeling during essential cellular processes1. Mutations in dynamins are associated with neuropathies4 and atypical expression levels of dynamins are associated with diverse cancers5 while several viruses (e.g. HIV) hijack dynamin-dependent pathways6,7. All dynamins are elongated, modular proteins, sharing a structurally conserved N-terminal guanine nucleotide-binding (GTPase) domain connected to a four-helix stalk by a three-helix bundle signaling element (BSE)8. The prototypical member, dynamin, also contains the lipid-binding pleckstrin homology domain (PHD) and a proline/arginine rich domain (PRD) that interacts with SRC homology 3 domain (SH3) containing dynamin partners9. Based on crystal structures, dynamin exists as a homo-tetramer formed from two dimers in the absence of lipid2. The dimer is held together by an extensive interface at the stalk domain (interface 2)10,11, while the tetramer is stabilized at the junction between the stalk and BSE (interface 1) and at the membrane-facing end of the stalks (interface 3)2 (Fig. 1). In all crystal structures, the PHD is either disordered or tucked up into its own stalk. In the assembled state, at the necks of budding vesicles or bound to lipid in vitro, low resolution cryo-EM structures suggest dynamin further oligomerizes into a helical polymer encasing a lipid tube with an additional GTPase domain dimer interface (interface G2) between rungs of the helix3. Upon guanosine triphosphate (GTP) binding and hydrolysis, the helical polymer constricts the underlying membrane from a thick >20 nm inner lumen diameter down to a <3.4 nm diameter hemi-fission state12,13 and catalyzes membrane fission. While these points are well established, the function of GTP energy in relation to membrane constriction and fission and the molecular details of the membrane-bound conformations remain unknown for the biologically relevant forms of dynamin14.
Figure 1, Cryo-EM map of assembled dynamin in the GTP-bound state (GMPPCP) on membrane at 3.75 Å.

a, Cryo-EM images (left) of helical dynamin tubes were processed to generate a 3D map (right) and subsequently a model of the tetramer was built (domains colored green for GTPase, pink for BSE, blue for stalk and gold for PH) (EMDB-7957: PDBID 6DLU). Dashed red line indicate interface G2. N=3 independent experiments with similar results. b, Regions in map showing high resolution features, ß-sheet in the GTPase domain, GMPPCP molecule, and side chains of the L477-R453 helix in the stalk (box in c). c, Tetramer model of assembled dynamin with surrounding density and domains colored as described above. The assembly interfaces are labeled 1–3. d, Comparison of the crystal structure of dynamin in the apo state (colored as above) with our 3D map (grey).
To provide a structural basis for the mechanism of dynamin, we determined a 3.75 Å cryo-electron microscopy (cryo-EM) map of the constricted dynamin-1 (dyn) polymer lacking the intrinsically disordered PRD assembled on lipid and treated with the non-hydrolyzable GTP analogue GMPPCP (dynGMPPCP) (Fig. 1a). We have complemented this structure with a cryo-EM reconstruction of a 10.1 Å resolution super-constricted dynamin polymer treated with GTP (dynGTP) (Extended Data Fig. 1, 2). Whereas dynGMPPCP represents the GTP-bound form of the dynamin polymer, dynGTP may constitute an intermediate conformation between GTP binding and GTP hydrolysis.
Each nucleotide treatment of dynamin yielded distinct distributions of polymer diameters (Extended Data Fig. 1a, 2). Consistent with previous reports3, the dynGMPPCP reconstruction has a 40 nm outer diameter and a 7.4 nm inner lumen diameter (Extended Data Fig. 1b). The more constricted dynGTP reconstruction has a 36 nm outer diameter and a 3.4 nm inner lumen diameter, which is narrow enough to induce spontaneous fission without a protein scaffold15. Additionally, dynGTP has a 2-start helical symmetry (Extended Data Fig. 3), similar to a previously published structure of GTP-bound dynamin containing the GTP hydrolysis deficient mutation K44A12.
Molecular details of the 3.75 Å map of dynGMPPCP could not be resolved when relying on previously published helical parameters3. New helical parameters (rise = 6.3 Å, twist = 23.7°) were determined that led to the elucidation of secondary structure, side chains, and the nucleotide density as appropriate for the nominal resolution (Fig. 1b), enabling a precise molecular model of the dynamin tetramer across most of the molecule. The PHDs were of lower local resolution (> 7.0 Å), suggesting they exhibit conformational flexibility and may not conform to a fixed helical symmetry (Extended Data Fig. 1b). This is likely due to their unstable positioning on the dynamic lipid membrane while linked to the stalk by long flexible loops, which are disordered in published X-ray crystal structures.
Compared to the crystal structure of the lipid-free tetramer, dynGMPPCP adopts an extended form, with the GTPase domain positioned more distal from the stalk and the PHD placed atop the lipid bilayer instead of tucked beneath interface 3 (Fig. 1c, d). The oligomeric interfaces in the stalk domain are similar between the lipid-free tetramer and dynGMPPCP except at interface 1. Interface 1 was originally postulated from the crystal structures of Mx16 but is not clearly defined in crystal structures of dynamin, consisting of only 190 Å2 buried solvent accessible surface area11. In contrast, interface 1 in the dynGMPPCP structure has 726 Å2 buried solvent accessible surface area (Fig. 2a). To probe the functional significance of interface 1 on endocytosis, transferrin uptake assays were conducted on cells transfected with interface mutants (Fig. 2b, c). Compared to cells with wild-type dynamin, cells with mutations in interface 1 (L330R/Q334R/L702R) exhibited marked endocytosis defects that were similar to cells with the GTPase mutation K44A known to disrupt GTP hydrolysis17 or with interface 3 disrupting mutations (D406R/M407R/T488W). The defects were associated with poor transferrin uptake that did not affect clathrin colocalization (Fig. 2b)18. This is consistent with recruitment to clathrin prior to dynamin polymer assembly19–21 and suggests polymerization or mechanoenzyme function were inhibited. Double mutations or single mutations at interface 1 only partially disrupted endocytosis (Extended Data Fig 4, 5), suggesting that interface 1 is highly robust.
Figure 2, Mutations in interface 1 and 3 inhibit endocytosis.

a, Interface 1 (L330R/Q334R/L702R) and interface 3 mutations (D406R/M407R/T488W) generated for endocytic assays. Middle panels, the dynGMPPCP polymer has a tighter interface 1 (blue, left) than the soluble crystal tetramer (right, green). Distances between stalks in interface 1 are shown above. b, TIRF images of dynamin and clathrin colocalization at the plasma membrane (N=2 independent experiments). Scale bar, 20 μm. Insets, 10 μm squares. c, Transferrin uptake is defective with interface 1 (L330R/Q334R/L702R) and interface 3 (D406R/M407R/T488W) mutations. Wild-type and K44A are shown for comparison. Mean and propagated standard deviation from N=3 biological replicates are shown with single replicates (grey dots) background subtracted and referenced to mean values. Trends were verified with N=2 biologically independent experiments (Extended Data Figure 5).
The most significant differences in dynGMPPCP compared to lipid-free crystal structures are in the conformations and dispositions of the GTPase and BSE domains (Fig. 1c, d), which are known to depend on nucleotide state. Previously published studies have sought to capture the different dynamin conformational states associated with the GTPase cycle through crystal structures of a dynamin GTPase-BSE dimer (GG). While interface G2 in dynGMPPCP is equivalent to the GG interface G2 in crystal structures, with an average RMSD of 0.8 Å, the GG crystal structures do not fit well into the cryo-EM density of dynGMPPCP (Fig. 3a), suggesting that the cryo-EM structure represents a different hydrolysis intermediate. Notably, the BSE exhibits marked asymmetry across interface G2 in dynGMPPCP (Fig. 3b). Of the two dynamin molecules forming the interface, only one contains a 35º kink centered on T292 in the hinge region linking the BSE and GTPase domains, between helices α5G and α2B (Fig. 3a, b; Extended Data Fig. 4b). In all dynamin crystal structures, the α5G and α2B helices are continuous and form an extended helix (T274-E310) with only a slight bend at T294 (Extended Data Fig. 4b), suggesting that a severe kink at T294 is not energetically favorable. In fact, the cryo-EM density of the bent BSE is more disordered than that of the unbent BSE, particularly at residues 20–31 (N-terminal helix and loop). To gain additional insight, the coordinates of a dynamin with an unbent BSE was aligned to the structure of a bent dynamin in the dynGMPPCP map at the GTPase domain (Fig. 3c). Surprisingly, the stalk and PHD of the aligned unbent dynamin were positioned deep inside the lipid bilayer. The exercise suggests that the BSE bends to accommodate the forces generated at the interface G2, which are then transferred across the stalk domain and the PHD to the underlying lipid membrane. Indeed, the cryo-EM density around the PHD of the bent dynamin is better defined than that of the unbent dynamin as if the PHD from the bent dynamin is stabilized from the transferred force against the lipid membrane (Fig. 3c). To evaluate the functional significance of bending dynamin, mutations that disrupt the BSE kink were probed with cell-based endocytosis assays. A triple mutant that increases the helical propensity of the kink (T292A/L293A/P294A), which presumably resists bending, resulted in significantly reduced transferrin uptake nearly to the level of the K44A mutation (Fig. 3d, e). The single mutant P294A and the triple mutant (R290A/D291A/T292A), did not significantly impact transferrin uptake (Fig. 3d, e, Extended Data Fig. 4, 5). An additional mutation on the back side of the GTPase domain (T92R/L84R/V118R/T78R) also had little effect on endocytosis even though there is close contact here between neighboring GTPase domains in the assembled polymer (Fig. 3 d, e).
Figure 3, Comparison of the BSE orientation in relationship to the GTPase domain dimer.

a, Asymmetry of GG domains in the cryo dynGMPPCP dimer reveals a unique kink (pink arrow) in the extended helix from the GTPase to the BSE (T274-E310, colored pink) in the monomer labeled B. Comparison of the GG crystal structures in different nucleotide states show a large swing of the BSE and a lack of unique kink in the extended helix in monomer B. From top to bottom: dynamin bound to GMPPCP (PDBID: 3ZYC), GDP/AlF (PDBID: 2X2E) and GDP (PDBID: 5D3Q). b, Overlay of cryo dynGMPPCP GG domains from monomer A and B illustrating the large asymmetry between the BSE domains (colored blue and yellow for bent and unbent respectively). Mutated residues T292/L293/P294 are highlighted in red. Sequence of the helix is shown on the right with helical propensity calculated by PROFphd (H: alpha-helix). Insert: flipped GG dimer in map. c, Left: A dynamin dimer model with both BSE unbent (pink). The normally bent dynamin has been replaced with an unbent dynamin aligned at the GTPase domain. Right: The PH domains associated with the bent and unbent BSEs resides in the stronger and weaker densities respectively. d, TIRF images of dynamin and clathrin colocalization at the plasma membrane (N=2 independent experiments). Scale bar, 20 μm. Insets, 10 μm squares. e, Transferrin uptake is defective in the helix stabilizing mutant (T292A/L293A/P294A). Wild-type and K44A are shown for comparison. Mean and propagated standard deviation from N=3 biological replicates are shown with single replicates (grey dots) background subtracted and referenced to mean values. Trends were verified with N=2 biologically independent experiments (Extended Data Figure 5).
To understand the role of GTP hydrolysis on the dynamin polymer, a model of a super-constricted dynamin polymer was derived from the 10.1 Å dynGTP map (Fig. 4a). Whereas the stalk domains of dynGMPPCP dimer structure fits reasonably well into the dynGTP density, the GTPase-BSE domains rotate toward the membrane by 10 Å (unbent) and 8 Å (bent) in dynGTP compared to dynGMPPCP (Fig. 4b, c). Thus, a localized shift in the GTPase and BSE domains induced by GTPase energy mediates super-constriction. Additional impact of this conformational change is apparent when the coordinates of an unbent dynamin are aligned to the structure of a bent dynamin in the dynGTP map at the GTPase domain (Fig. 4d). Just as for dynGMPPCP, the stalk and PHD of the aligned unbent dynamin in dynGTP were positioned deep inside the lipid bilayer but at a much more severe angle (Fig. 4d), suggesting greater force is being exerted onto the underlying membrane. Furthermore, the underlying lipid bilayer appears to thicken from ~ 40 Å for dynGMPPCP, which matches previous measurements of DOPS lipid bilayers22, to ~ 46 Å for dynGTP, which is consistent with greater strain on the lipid23.
Figure 4, 3D map of assembled dynGTP on membrane at 10.1 Å in the super-constricted state.
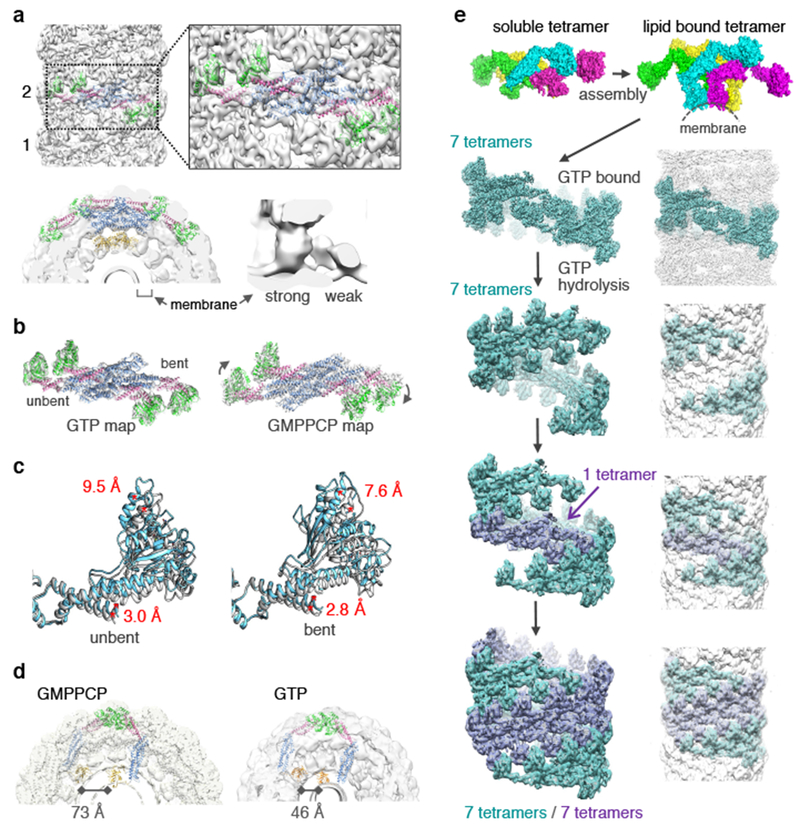
a, In the presence of GTP, dynamin assembles as a 2-start helix (labeled 1 and 2). The strong PHD density associates with the bent BSE (EMDB-7958: PDB 6DLV). b, Comparison of dynGTP and dynGMPPCP structures aligned at unbent stalk with the dynGTP model in dynGTP density (left) and dynGMPPCP density (right). c, Comparison of GTPase-BSE domains from the dynGMPPCP and dynGTP show a ~3 Å shift in the BSE, and a 9.6 Å and 7.6 Å movement in the GTPase domains toward the membrane in the unbent and bent monomers respectively. d, A dynamin dimer model made with both BSEs unbent (pink). Comparison between the unbent dimer in the GMPPCP density (left) and GTP density (right) illustrates a potential compression of the dimer upon GTP hydrolysis. Distance between the PHDs is 73 Å compared to 46 Å for the dynGMPPCP and dynGTP models respectively. e, Model of dynamin assembly and constriction: The dynamin tetramer unfolds (monomers colored green, cyan, yellow and magenta) and wraps around the lipid tube in a GTP-bound state as a 1-start helix (teal) that is disrupted by GTP hydrolysis allowing for a second strand (purple) to assemble and form 2-start helix.
A model of dynamin assembly and constriction emerges from the cryo-EM data (Fig. 4e). In the absence of nucleotide or in the basal hydrolysis state, dynamin polymerizes around lipid tubes, but proceeds to sample a wide range of conformations through structural adjustments at its interfaces. From previous low resolution cryo-EM studies24, interface G2 is formed in this apo state, but likely in a different configuration. Notably, the crystal structure of the apo conformation of dynamin is inconsistent with assembly around a lipid tube (Extended Data Fig. 6). Upon GTP binding, dynamin polymers sample a much more restricted range of conformations, favoring a distinct set of interfaces and a marked asymmetry in the BSE and GTPase domains that applies a force on the underlying lipid membrane. Localized conformational changes at the GTPase and BSE domains as GTP energy is harnessed drive global changes to the helical symmetry, making room for a second strand to assemble on the membrane tube. This would require dynamin disassembly from the lipid bilayer upon GTP hydrolysis, which has been previously reported14. Furthermore, in crystal structures, interface G2 has only been observed in the presence of GMPPCP or GDP/AlF, but not GDP or in the apo state14. The flexibility of the PHDs should accommodate the transition from the 1-start helix to the 2-start helix. In summary, these molecular snapshots of the biologically relevant form of dynamin provide a framework for understanding the complex orchestration of GTP-driven conformational changes that mediate membrane constriction.
Methods
ΔPRD dynamin expression and purification.
HA-tagged ΔPRD dynamin (86 kDa) was expressed in baculovirus-infected TN5 cells and purified as described previously3. Briefly, cells were harvested after ~48 hours and flash frozen in liquid nitrogen. Cell pellets were thawed quickly in ~50 ml of HCB100 (20 mM HEPES, pH 7.2, 100 mM NaCl, 2 mM EGTA, 1 mM MgCl2, 1 mM DTT) at 37 °C and homogenized by N2-cavitation at 500 psi for 25 min. The homogenate was diluted with HCB0 (no NaCl) to a final concentration of HCB50 (50 mM NaCl) and then centrifuged for 1 hr at 50,000 rpm. To concentrate and enrich for dynamin, 30% ammonium sulfate was added to the supernatant and centrifuged for 12 min at 10,000g. The pellets were resuspended in HCB50, containing protease inhibitors (Roche), and centrifuged at 10,000g for 8 min to pellet aggregated protein. The protein was further purified by a Mono-Q column followed by a Macro-Prep Ceramic Hydroxyapatite (HAP) Type I column. Dynamin was eluted with 400 mM KPO4 off the HAP column and frozen in liquid nitrogen. The purity was ~95%, judged by Coomassie blue staining, and the final dynamin concentration was 2 mg/ml.
Liposome preparation.
Synthetic phosphatidylserine in chloroform (50 ul of 10 mg/ml, DOPS, Avanti) was dried down under argon gas in a glass tube and stored overnight under vacuum to remove excess solvent. The lipid was resuspended in 250 ul HCB150 (150 mM NaCl) and extruded 21 times through a 0.8 μm pore-size polycarbonate membrane (Avanti).
ΔPRD dynamin polymer formation.
ΔPRD dynamin polymers were generated as described previously25. Three dynamin treatments were performed to explore a wide range of polymer constriction states (Extended Data Fig. 1, 2). Briefly, dynamin was centrifuged at 13,000 rpm (table top centrifuge at 4 °C) for 5 minutes to remove aggregated protein and then diluted 1:3 with HCB0 for a final concentration ~0.5 mg/ml. The protein was then incubated with DOPS liposomes for 2 hours at room temperature with or without 1 mM GMPPCP. For dynGMPPCP polymers, ΔPRD dynamin was pre-incubated for 5 min before the addition of the DOPS vesicles followed by further incubation for 1 hr. For dynGTP polymers, 1 mM GTP was added to preformed ΔPRD dynamin tubes 5–10 seconds prior to freezing.
Cryo-EM sample preparation and imaging.
Aliquots of 3.5 ul of each sample was applied to plasma-cleaned (Fishione Inc.) C-flat grids (Protochips, CF-1.2/1.3–4C), blotted on the sample side with filter paper for 2 seconds (22 °C, 90% humidity) and then plunged into liquid ethane with a Leica EM Grid Plunger (Leica Microsystems). For the dynGTP samples, after 3.5 ul sample was applied to the grids in the grid plunger, GTP was added and plunged into ethane after 5–10 seconds. The vitrified samples were stored in liquid nitrogen before examination by cryo-EM. For the dynGMPPCP polymer samples, images were recorded during three sessions on a Titan Krios microscope (FEI) at 300 kV and recorded at 22,500X magnification with a defocus range of 1.0–3.0 μm on a K2 summit camera in counting mode. For the GMPPCP treated sample containing partially constricted polymers and for the dynGTP sample, images were recorded on a TF20 microscope (FEI) at 200 kV and recorded at 29,000X magnification, with a defocus range of 1.5–3.0 μm on a K2 summit camera in counting mode (Extended Data Table 1).
Cryo-EM data processing.
For all images recorded from the FEI Titan Krios microscope, the first frame was removed prior to motion correction and dose weighting with MotionCor226. The CTF parameters of non-dose-weighted images were estimated using Ctffind427, and the correction parameters were applied to the dose-weighted images. For all images recorded from the FEI TF20 microscope, Unblur28 was used for motion correction and dose weighting. The motion-corrected images were then CTF corrected in Relion using Ctffind4 estimations. From these preprocessed images, well-ordered helical polymers were selected manually in RELION 2.0.3 and 2.0.629 (Extended Data Fig. 2). Polymers adopted a wide range of tubular diameters, and to minimize heterogeneity, all particles were sorted by outer tube diameter, and only particles with the most populated diameter were selected for structure calculation (Extended Data Fig. 1, 2). This was achieved by cross correlating each particle image with a set of references consisting of helical tubes with varying outer diameters using the Spider software suite12,30. The references consisted of down-sampled images of the dynGMPPCP from multiple views with varying gaps between the two sides of the polymer. All scripts used for the sorting procedure are available upon request. RELION was used for further particle processing. Dynamin polymers with no nucleotide resisted structural characterization as they were highly disordered and had a wide 41–71 nm diameter distribution (Extended Data Fig. 1a, 2). The particles were subjected to multiple rounds of 2D classification, with only the highest resolution 2D classes selected after each round. 3D classification did not generate maps with significant differences, possibly due to the homogeneity achieved from sorting with Spider. For the 3.8 Å dynGMPPCP map, the B factor automatically estimated in Relion was used (−159.56). For the dynGTP map no B factor sharpening was applied. The resolutions of the final maps were determined using the ‘gold standard’ (FSC=0.143)31 (Extended Data Fig. 1). The mask used to calculate the FSC was determined by choosing the lowest threshold in Chimera32 of one of the unfiltered half-maps that gave no noise outside the reconstruction. Model to cryo-EM map FSC curves were generated by Phenix 33. Helical propensity was calculated by PROFphd34.
3D model refinement.
Initial fitting was performed using a model of the dynamin dimer constructed from the crystal structures of the GG-GMPPCP monomer (PDBID: 3ZYC ) and the human dynamin-1 dimer (PDBID: 3SNH). The model was first docked into the cryo-EM density manually in UCSF Chimera32 followed by rigid-body refinement with Modeller35. Upon convergence, all-atom real space refinement was done using the Phenix-1.13–2998 software suite33 along with manual model building in Coot 0.8.736. The final refinement statistics are shown in Extended Data Table 1. Surface burial analysis was performed using the EMBL PISA server37.
Cell culture.
All flow cytometry and microscopy was performed on HeLa cells (ATCC CCL-2) that were maintained in phenol red free DMEM growth media (DMEM, Life Technologies 31053–036; 10% Fetal Bovine Serum, Life Technologies 26140–079; 2 mM Glutamax, Life Technologies 35050–061; 1 mM Sodium pyruvate, Sigma S8636–100ML) at 37°C with 5% CO2. HeLa cells were early passaged stocks directly obtained from ATCC and were tested mycoplasma free. The human dynamin1-GFP mutants created for this work were fully sequenced and have been deposited in Addgene repository database.
Fluorescence microscopy.
Cells were trypsinized (0.25% trypsin, Thermo-Fisher 25200056) and plated on poly-D-lysine coated coverslips (Neuvitro, GG-25–1.5-pdl) 24–36 hours prior to imaging. Transfection was performed overnight (1–1.5 ug of DNA, 3 uL of lipofectamine 2000 in 0.5 ml of optimem and 2 ml of DMEM growth media). Cells were transfected with the dynamin-GFP mutant of interest and mcherry-clathrin (light chain a, addgene #27680,38). Total internal reflectance fluorescence (TIRF) microscopy was performed in imaging buffer (10 mM Hepes, 10 mM glucose, 130 mM NaCl, 2.8 mM KCl, 5 mM CaCl2 , 1 mM MgCl2 , pH 7.4). Cells were imaged on a Nikon Eclipse TI inverted fluorescence microscope with a 100× apoTIRF 1.49 NA objective, 488 nm, and 561 nm excitation lasers. TIRF images displayed in Figures 2 and 3 are characteristic examples from N>20 cells over two independent experiments for each mutant.
Transferrin uptake assay.
For the transferrin uptake assay, the cells were prepared as with fluorescence microscopy but were plated onto six-well plates (Fisher Scientific 08–772-1B) and transfected only with the dynamin1-GFP mutant of interest. After overnight transfection, cells were serum starved for 45 minutes (DMEM; 2 mM Glutamax; 1 mM Sodium pyruvate). The media was first replaced with ice cold PBS4+ (PBS with 1 mM CaCl2, 1mM MgCl2, 0.2%BSA, 5 mM glucose) and placed on ice then replaced by PBS4+ containing 5 μg/ml Alexa-fluor 647 conjugated transferrin (Thermo Fisher T23366). The cells were incubated on ice with transferrin for 5 minutes before the cells were placed into a 37°C incubator for 20 minutes. The transferrin was then removed and the cells were rinsed twice with ice cold PBS and incubated on ice with 1 ml, 2 mg/ml pronase (Sigma 10165921001) in PBS for 10 minutes. The cells were no longer adherent and were pipetted gently to separate clumps before adding 0.25 ml of 16% paraformaldehyde (Electron Microscopy Sciences 15710) to fix for 20 minutes. The cells were then spun down and resuspended in 300 μL PBS for flow cytometry. Experiments were performed on a BD LSR II flow cytometer and acquired using BD FACSDiva Software Version 8.0.1. Single cells were gated away from debris using forward and side scattered light. In one experiment, 1.6 ng/ml DAPI was added to help gate cells away from debris. The results did not differ from a replicate using scattered light (Extended Fig. 5). Each experiment when presented together in a plot had identical gating throughout and included each condition in triplicate. The isolated single cells were plotted with Alexa Fluor (AF) 647 transferrin fluorescence vs GFP fluorescence. Gating for GFP positive cells and GFP negative cells was chosen based on untransfected controls. Average AF647 fluorescence was obtained for each population and were background subtracted with a no uptake control. Their ratio determined the fraction of transferrin uptake. In duplicate experiments, the exact uptake ratio could change due to slightly different GFP gating parameters but the relative trends remained constant (Extended Figure 5). In Figures 2c, 3e, and Extended Figures 4a, and 5d,h, the standard deviations are propagated to include the standard deviations from the subtracted background and the GFP negative reference. The single grey points shown are the average fluorescence from Alexa Fluor 647 transferrin in GFP positive cells in single replicates that have been background subtracted and referenced to the mean values from N=3 replicates.
Extended Data
Extended Data Figure 1, Cryo-EM parameters and data analysis.

a, Diameter distribution of dynamin tubes in the absence or presence of GMPPCP or GTP, scale bar 200 nm. Each experiment was repeated 3 independent times with similar results. b, Local resolution and helical parameters where R=rise, T-twist and SPT=subunits per helical turn. c, Gold standard FSC curves of the dynamin 3D maps. d, Model to map FSC curves. (Dotted blue line indicated the gold standard resolution at 0.5 FSC.)
Extended Data Figure 2. Cryo-EM data collection and processing flowchart.

Starting from the top, the flowchart details the pathways of three separate samples (red, green and blue) of dynamin protein through imaging and processing. The samples were imaged by two different microscopes, and then three different conformational states were selected manually. Each of these states were separately processed by Spider and then RELION. The red stars in the polymer diameter histograms indicate the diameters of the particles used for the final reconstructions. See Methods for details.
Extended Data Figure 3. Dynamin helical tubes and their Fourier transforms.

a,b, Representative cryo-EM images (left) are shown of two dynamin polymers in different conformations. Each experiment was repeated 3 independent times with similar results. The Fourier transforms of the polymer images are displayed to the right. The strong layer lines associated with the pitch (red arrows) are highlighted. The distance of the layer lines from the meridian (m), highlighted by dotted black lines, indicate the dynGTP polymer is a 2-start helix, whereas the dynGMPPCP polymer is a 1-start helix. c,d, Power spectrum of 2D class averages from dynGTP and dynGMPPCP respectively, highlighting the differences between a 2-start and 1-start helix. e,f, Sections of the dynGMPPCP and dynGTP maps starting from the outside and going to the middle section. A top middle section looking down the center of the tubes is shown in the top right panels.
Extended Data figure 4, Functional cell-based assays probing dynamin mutants and structural comparison of the BSE hinge.

a, Transferrin uptake of additional interface 3 mutants. Wild-type and K44A are shown for comparison. Mean and propagated standard deviation from N=3 biological replicates are shown. Also shown are single GFP(+) biological replicates that are each background subtracted and referenced to mean values (grey dots). Experiment was repeated and trends verified with N=2 biologically independent experiments. b, Comparison of α5G and α2B helices from dynGMPPCP (cryo-bent and cryo-unbent) and available crystal structures, including dynamin bound to GMPPCP (PCP 1 and 2, PDBID: 3ZYC), dynamin bound to GDP- AlF (GDP-AlF 1 and 2, PDBID: 2X2E) and dynamin bound to GDP (GDP 1 and 2, PDBID: 5D3Q). The number after each structure (1 or 2) represents the first or the second member of the dynamin dimer presented in each structure.
Extended Data Figure 5, FACS gating.

To test the robustness of our gating, we used either side-scattering (a-d) or DAPI (e-h) to isolate single cells in two different experimental replicates. In both cases, single cells were isolated from debris (a, e). Single cells were then separated into GFP(−) and GFP(+) gates (b, c, f, g). Controls lacking transfection or transferrin uptake (b, f) informed gating choices. Inhibitory mutants exhibited characteristic dip in transferrin fluorescence in the GFP(+) cells (c, g). The exact fraction of transferrin uptake was dependent on GFP(+) gating choices (d, h) while qualitative trends were consistent. Mean and propagated standard deviation from N=3 biological replicates are shown. Also shown are single GFP(+) biological replicates that are each background subtracted and referenced to mean values (grey dots).
Extended Data Figure 6, Comparison of dynGMPPCP and dynAPO at interface G2.

a, A large swing in the BSE of the tetramer in the Apo conformation (PDBID: 5A3F) disrupts interface G2. The Apo tetramer and cryo dynGMPPCP (GMPPCP-bound conformation) were aligned by the stalk. Curved arrow indicates the movement of the G domain. Domains are colored green for GTPase, pink for BSE, blue for stalk in monomer B, and purple for GTPase, orange for BSE, tan for stalk in monomer A. b, Interface G2, colored as above, in Cryo-EM map of dynGMPPCP (grey mesh).
Extended Data Table 1,
Cryo-EM data collection, refinement and validation statistics.
| DynGMPPCP (EMDB-7957) (PDB 6DLU) | DynGTP (EMDB-7958) (PDB 6DLV) | |
|---|---|---|
| Data collection and processing | ||
| Microscope | FEI Titan Krios | FEI TF20 |
| Magnification | 22,500X | 29,000X |
| Voltage (kV) | 300 | 200 |
| Electron exposure (e−/Å2) | 67 | 36 |
| Defocus range (μm) | 1.0-3.0 | 1.5-3.0 |
| Pixel size (Å) | 1.07 | 1.27 |
| Image processing software | RELION v2.0.6 | RELION v2.0.6 |
| Symmetry imposed | Helical | Helical |
| Initial particle images (no.)a | 989,911 | 58,260 |
| Final particle images (no.)a | 452,959 | 14,322 |
| Map resolution (Å) | 3.75 | 10.1 |
| FSC threshold | 0.143 | 0.143 |
| Map resolution range (Å) | 3.57-5.67 | 7.8-21 |
| Helical Parameters | ||
| Inner diameter (nm) | 7.4 | 3.4 |
| Outer diameter (nm) | 40.0 | 36.0 |
| Pitch (Å) | 96.4 | 201.5 |
| Rise (Å) | 6.35 | 14.63 |
| Twist (°) | 23.68 | 26.14 |
| Dynamin dimers per tum (no.) | 15.2 | 13.8 |
| Start (no.) | 1 | 2 |
| Refinement | ||
| Refinement Software | Phenix 1.13-2998 | Phenix 1.13-2998 |
| Initial model used (PDB code) | 3SNH, 3ZYC | 3SNH, 3ZYC |
| Model resolution (Å) | 3.86 | |
| FSC threshold | 0.5 | |
| Model resolution range (Å) | ||
| Model sharpening B factor (Å2) | −146.8 | Not used |
| Phenix Mask CCb | 0.793 | 0.789 |
| Model composition | (1 dimer) | (2 dimers) |
| Non-hydrogen atoms | 11,993 | 22,031 |
| Protein residues | 1,453 | 2,678 |
| Ligand atoms | 66 | 0 |
| B factors (Å2) | ||
| Protein | 88.3 | 482 |
| Ligands | 46.0 | N/A |
| R.m.s. deviations | ||
| Bond lengths (Å) | 0.007 | 0.007 |
| Bond angles (°) | 0.829 | 1.468 |
| Validation | ||
| MolProbity scorec | 1.97 | 1.76 |
| Clashscorec | 11.78 | 9.69 |
| Poor rotamers (%)c | 0.23 | 0.57 |
| EM Ringer scored | 1.92 | −0.24 |
| Ramachandran plot | ||
| Favored (%)c | 94.2 | 96.3 |
| Allowed (%)c | 5.8 | 3.7 |
| Disallowed (%)c | 0 | 0 |
Footnotes:
Number of particles is equivalent to number of asymmetric units as calculated by (number of boxes) * (number of unique assymetric units per box)
Model-to-map fit (CC_mask) as reported by phenix.real_space_refine
As reported by Molprobity (http://molprobity.biochem.duke.edu)
As reported by Phenix
Supplementary Material
Acknowledgements
This work was supported by the NIDDK and NHLBI NIH Intramural Research Program. This work utilized the Simons Electron Microscopy Center and National Resource for Automated Molecular Microscopy (NRAMM) located at the New York Structural Biology Center (supported by grants from the Simons Foundation (349247), NYSTAR, and the NIH National Institute of General Medical Sciences (GM103310) with additional support from the Agouron Institute (F00316) and NIH (S10 OD019994-01)), the NHLBI light microscopy core facility, the NHLBI flow cytometry core facility and the computational resources of the NIH HPC Biowulf cluster (http://hpc.nih.gov). We thank Paula Flicker, Jacqueline Kehr, Jeanne Morin-Leisk, Annika Shuali, and Anna Sundborger for insightful discussions. We thank Pradeep Dagur for technical assistance with flow cytometry, and Bridget Carragher and Clint Potter for technical assistance with data collection at NRAMM.
Footnotes
Author contributions
L.K. and J.E.H designed research; L.K., and J.E.H prepared protein samples; L.K., H.B., W.J.R., and J.E.H collected cryo-EM data; L.K., S.F, A.D.K., H.B, B.C. and J.E.H. processed and analyzed the data; K.A.S. and J.W.T. designed and performed cell based assays; M-P.S. generated all constructs for cell-based assays. L.K. and J.E.H. wrote the paper. All authors were asked to comment on the manuscript.
Competing financial interests: The authors declare no competing financial interests.
Data availability statement: Data that support the findings of this study have been deposited in EMDB with the accession codes EMDB-7957, EMDB-7958, PDBID 6DLU and PDBID 6DLV and will be available upon publication. Dynamin1-GFP mutant plasmids produced for this study have been deposited at the Addgene plasmid repository.
REFERENCES
- 1.Ferguson SM & De Camilli P Dynamin, a membrane-remodelling GTPase. Nature Publishing Group 13, 75–88 (2012). [DOI] [PMC free article] [PubMed] [Google Scholar]
- 2.Reubold TF et al. Crystal structure of the dynamin tetramer. Nature 525, 404–408 (2015). [DOI] [PubMed] [Google Scholar]
- 3.Chappie JS et al. A pseudoatomic model of the dynamin polymer identifies a hydrolysis-dependent powerstroke. Cell 147, 209–222 (2011). [DOI] [PMC free article] [PubMed] [Google Scholar]
- 4.Heymann JAW & Hinshaw JE Dynamins at a glance. Journal of Cell Science 122, 3427–3431 (2009). [DOI] [PMC free article] [PubMed] [Google Scholar]
- 5.Sundborger AC & Hinshaw JE Dynamins and BAR Proteins-Safeguards against Cancer. Crit Rev Oncog 20, 475–484 (2015). [DOI] [PMC free article] [PubMed] [Google Scholar]
- 6.Sun Y & Tien P From endocytosis to membrane fusion: emerging roles of dynamin in virus entry. Crit. Rev. Microbiol. 39, 166–179 (2013). [DOI] [PubMed] [Google Scholar]
- 7.Harper CB, Popoff MR, McCluskey A, Robinson PJ & Meunier FA Targeting membrane trafficking in infection prophylaxis: dynamin inhibitors. Trends in Cell Biology 23, 90–101 (2013). [DOI] [PubMed] [Google Scholar]
- 8.Daumke O & Praefcke GJK Invited review: Mechanisms of GTP hydrolysis and conformational transitions in the dynamin superfamily. Biopolymers 105, 580–593 (2016). [DOI] [PMC free article] [PubMed] [Google Scholar]
- 9.Sundborger AC & Hinshaw JE Regulating dynamin dynamics during endocytosis. F1000Prime Rep 6, 85 (2014). [DOI] [PMC free article] [PubMed] [Google Scholar]
- 10.Ford MGJ, Jenni S & Nunnari J The crystal structure of dynamin. Nature 477, 561–566 (2011). [DOI] [PMC free article] [PubMed] [Google Scholar]
- 11.Faelber K et al. Crystal structure of nucleotide-free dynamin. Nature 477, 556–560 (2011). [DOI] [PubMed] [Google Scholar]
- 12.Sundborger AC et al. A dynamin mutant defines a superconstricted prefission state. CellReports 8, 734–742 (2014). [DOI] [PMC free article] [PubMed] [Google Scholar]
- 13.Mattila J-P et al. A hemi-fission intermediate links two mechanistically distinct stages of membrane fission. Nature 524, 109–113 (2015). [DOI] [PMC free article] [PubMed] [Google Scholar]
- 14.Antonny B et al. Membrane fission by dynamin: what we know and what we need to know. EMBO J e201694613 (2016). doi: 10.15252/embj.201694613 [DOI] [PMC free article] [PubMed] [Google Scholar]
- 15.Kozlovsky Y & Kozlov MM Membrane Fission: Model for Intermediate Structures. Biophysj 85, 85–96 (2003). [DOI] [PMC free article] [PubMed] [Google Scholar]
- 16.Gao S et al. Structure of Myxovirus Resistance Protein A Reveals Intra- and Intermolecular Domain Interactions Required for the Antiviral Function. Immunity 35, 514–525 (2011). [DOI] [PubMed] [Google Scholar]
- 17.Damke H, Binns DD, Ueda H, Schmid SL & Baba T Dynamin GTPase domain mutants block endocytic vesicle formation at morphologically distinct stages. Molecular Biology of the Cell 12, 2578–2589 (2001). [DOI] [PMC free article] [PubMed] [Google Scholar]
- 18.Larson BT, Sochacki KA, Kindem JM & Taraska JW Systematic spatial mapping of proteins at exocytic and endocytic structures. Molecular Biology of the Cell 25, 2084–2093 (2014). [DOI] [PMC free article] [PubMed] [Google Scholar]
- 19.Grassart A et al. Actin and dynamin2 dynamics and interplay during clathrin-mediated endocytosis. J Cell Biol 205, 721–735 (2014). [DOI] [PMC free article] [PubMed] [Google Scholar]
- 20.Srinivasan S et al. A noncanonical role for dynamin-1 in regulating early stages of clathrin-mediated endocytosis in non-neuronal cells. PLoS Biol 16, e2005377 (2018). [DOI] [PMC free article] [PubMed] [Google Scholar]
- 21.Sochacki KA, Dickey AM, Strub M-P & Taraska JW Endocytic proteins are partitioned at the edge of the clathrin lattice in mammalian cells. Nat Cell Biol 19, 352–361 (2017). [DOI] [PMC free article] [PubMed] [Google Scholar]
- 22.Petrache HI et al. Structure and Fluctuations of Charged Phosphatidylserine Bilayers in the Absence of Salt. Biophysj 86, 1574–1586 (2004). [DOI] [PMC free article] [PubMed] [Google Scholar]
- 23.Mitra K, Ubarretxena-Belandia I, Taguchi T, Warren G & Engelman DM Modulation of the bilayer thickness of exocytic pathway membranes by membrane proteins rather than cholesterol. Proceedings of the National Academy of Sciences 101, 4083–4088 (2004). [DOI] [PMC free article] [PubMed] [Google Scholar]
- 24.Chen Y-J, Zhang P, Egelman EH & Hinshaw JE The stalk region of dynamin drives the constriction of dynamin tubes. Nat Struct Mol Biol v11, 574–575 (2004). [DOI] [PubMed] [Google Scholar]
Additional References
- 25.Zhang P & Hinshaw JE Three-dimensional reconstruction of dynamin in the constricted state. Nat Cell Biol 3, 922–926 (2001). [DOI] [PubMed] [Google Scholar]
- 26.Zheng SQ et al. MotionCor2: anisotropic correction of beam-induced motion for improved cryo-electron microscopy. Nat Meth 14, 331–332 (2017). [DOI] [PMC free article] [PubMed] [Google Scholar]
- 27.Rohou A & Grigorieff N CTFFIND4: Fast and accurate defocus estimation from electron micrographs. Journal of Structural Biology 192, 216–221 (2015). [DOI] [PMC free article] [PubMed] [Google Scholar]
- 28.Grant T & Grigorieff N Measuring the optimal exposure for single particle cryo-EM using a 2.6 Å reconstruction of rotavirus VP6. eLife 4, e06980 (2015). [DOI] [PMC free article] [PubMed] [Google Scholar]
- 29.He S & Scheres SHW Helical reconstruction in RELION. Journal of Structural Biology 198, 163–176 (2017). [DOI] [PMC free article] [PubMed] [Google Scholar]
- 30.Shaikh TR et al. SPIDER image processing for single-particle reconstruction of biological macromolecules from electron micrographs. Nat Protoc 3, 1941–1974 (2008). [DOI] [PMC free article] [PubMed] [Google Scholar]
- 31.Scheres SHW & Chen S Prevention of overfitting in cryo-EM structure determination. Nat Meth 9, 853–854 (2012). [DOI] [PMC free article] [PubMed] [Google Scholar]
- 32.Pettersen EF et al. UCSF Chimera--a visualization system for exploratory research and analysis. J Comput Chem 25, 1605–1612 (2004). [DOI] [PubMed] [Google Scholar]
- 33.Adams PD et al. PHENIX: a comprehensive Python-based system for macromolecular structure solution. Acta Crystallogr. D Biol. Crystallogr. 66, 213–221 (2010). [DOI] [PMC free article] [PubMed] [Google Scholar]
- 34.Rost B PHD: predicting one-dimensional protein structure by profile-based neural networks. Meth. Enzymol. 266, 525–539 (1996). [DOI] [PubMed] [Google Scholar]
- 35.Webb B & Sali A Comparative Protein Structure Modeling Using MODELLER. Curr Protoc Protein Sci 86, 2.9.1–2.9.37 (2016). [DOI] [PubMed] [Google Scholar]
- 36.Emsley P, Lohkamp B, Scott WG & Cowtan K Features and development of Coot. Acta Crystallogr. D Biol. Crystallogr. 66, 486–501 (2010). [DOI] [PMC free article] [PubMed] [Google Scholar]
- 37.Krissinel E & Henrick K Inference of macromolecular assemblies from crystalline state. Journal of Molecular Biology 372, 774–797 (2007). [DOI] [PubMed] [Google Scholar]
- 38.Taylor MJ, Perrais D & Merrifield CJ A high precision survey of the molecular dynamics of mammalian clathrin-mediated endocytosis. PLoS Biol 9, e1000604–23 (2011). [DOI] [PMC free article] [PubMed] [Google Scholar]
Associated Data
This section collects any data citations, data availability statements, or supplementary materials included in this article.