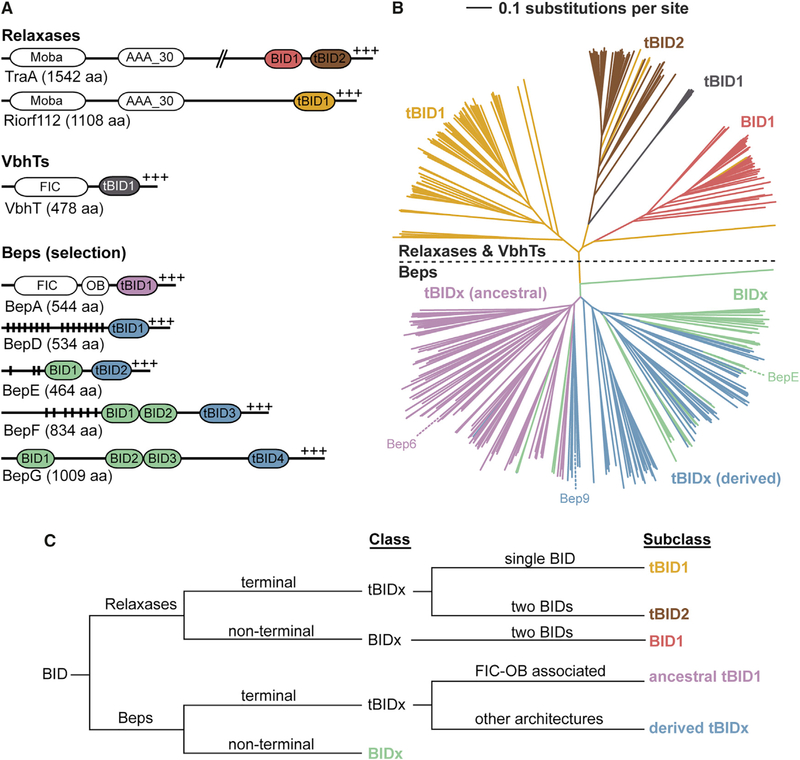
Figure 2. BID Domain Arrangements and Subclasses in Beps and Relaxases.
(A) The BID domain architecture as seen in two relaxases (TraA from Agrobacterium fabrum and Riorf112 from Agrobacterium rhizogenes), a VbhT homolog (VbhT from Bartonella schoenbuchensis), and representative B. henselae Beps, with vertical black lines indicating Tyr phosphorylation motifs and +++ the positively charged C terminus. MobA, mobilization proteins of the MobA/MobL family; AAA_30, ATPases associated with diverse cellular activities (AAA) domain; FIC, filamentation induced by cAMP domain; OB, oligonucleotide/oligosaccharide binding fold.
(B) Simplified neighbor-joining distance-based tree representation of the multiple sequence alignment of the BID domains from Beps and relaxases. The branches corresponding to Bep_tBIDx (ancestral) are colored in pink, Bep_tBIDx (derived) in blue, and Bep_BIDx in green (Engel et al., 2011). The relaxase tBID1 domains are colored in yellow, tBID2 in brown, and the BID1 in red. See Figure S3 for the full high-resolution tree shown here with species names and UniProt IDs.
(C) Classification scheme of BID domains developed in this study.
See also Figures S3 and S4.

