

Abstract
A grandmother hypothesis may explain why humans evolved greater longevity while continuing to end female fertility at about the same age as do the other great apes. With that grandmother hypothesis in mind, we sought to compare age-specific mortality and fertility rates between humans and chimpanzees, our closest living relatives, and found two puzzles. First, we expected that lower adult mortality in humans would be associated with slower senescence, but the rate of chimpanzee demographic aging falls within the human range. Second, we expected declines in age-specific fertility to be similar in the two species but instead of falling in the thirties as it does in women, fertility remains high into the forties in some chimpanzee populations. We report these puzzles using data from nine human populations and both wild and captive chimpanzees, and suggest that systematic differences in the heterogeneity of surviving adults may explain them.
Evolutionary models to explain the wide variation in rates of aging across taxa draw on life history theory in which species are characterized by population parameters, “the probabilities of survival and the rates of reproduction at each age in the lifespan” (Partridge and Harvey, 1988, p 1449). Gurven and Kaplan (2007) recently surveyed life tables for some traditional human populations and compared them with similar data on chimpanzees to characterize the evolved pattern of human survival. They found that differences among human populations are small in comparison to the differences between humans and chimpanzees, and concluded that the species differences must be explained to account for the evolution of human life history. We agree (Hawkes, 2003; Robson et al., 2006). But, as we show here, the comparisons between species can be misleading unless they take account of systematic variation within-species.
We focus on females, as does much of life history theory, because it is female fertilities and mortalities that determine population growth and age structure, and because our comparative questions are prompted by a grandmother hypothesis about the evolution of human life history. That hypothesis was partly based on ethnographic observations of the important economic subsidies that postmenopausal Hadza women provide their grandchildren, and is meant to explain our distinctive combination of greater longevity with female fertility ending at ages very similar to the other living great apes (Alvarez, 2000; Hawkes, 2003; Hawkes et al., 1997, 1998; Jones et al., 2007; O’Connell et al., 1999). It proposes an evolutionary scenario based on ecological shifts in the Plio-Pleistocene that reduced the availability of foods young juveniles could handle for themselves, increasing the importance of mother-child food sharing. Older females whose fertility was ending then faced a novel opportunity to increase their fitness. By provisioning their grandchildren, they could allow their daughters to move on to the next baby sooner. Because more robust elders could help more, the net benefits for vigor at later ages increased, altering the optimal allocation to maintenance and repair. The economic help from elders would have favored lower adult mortality rates (Lee, 2008). Grandmother effects provided the fundamental shift to our distinctively human pattern of cooperative breeding (Hrdy, 1999, 2005).
This hypothesis combines grandmother effects with optimality models from life history theory to explain later age at first parturition and slower rates of aging in humans. The models assume that finite resources require tradeoffs with fitness payoffs assessed over lifetimes (Stearns, 1992). But, the tradeoffs assumed in the models are often difficult to measure directly because individuals differ in the amount of resource they have to allocate (Cam et al., 2002; Nussey et al., 2008; Service, 2000; Zens and Peart, 2003). Life history traits can be like houses and cars. Although resources spent on one leave less for the other, those with more resources can spend more on both. Rather than the negative correlation expected from the tradeoffs, observations often reveal positive correlations instead (van Noordwijk and de Jong, 1986).
Such population heterogeneity, known to have so many surprising consequences for population dynamics (Vaupel and Yashin, 1985), contributes to two puzzles that arise in life history comparisons between humans and chimpanzees. Average adult mortality is lower in humans than in chimpanzees (Hill, 1993; Hill and Kaplan, 1999; Hill et al., 2001). Frequently used models of the evolution of senescence predict that on those grounds humans would age more slowly than chimpanzees do (Ricklefs, 1998; Williams and Day, 2003; Williams et al., 2006; Williams, 1957). The usual demographic measure of aging is the rate of increase in the mortality hazard across adulthood. One convention for describing it is the Mortality Rate Doubling Time (MRDT, Finch, 1990; Finch et al., 1990; Sacher, 1977). Finch (2007, p 12) reports that “Human MRDTs are fairly similar across populations, despite major differences in diseases and overall mortality (Finch, 1990; Gurven and Kaplan, 2007),” and he gives 7–9 years as the human MRDT. For captive female chimpanzees, an MRDT can be calculated from the life table that Dyke et al. (1995) constructed by synthesizing observed age-specific mortalities at three primate research centers. It is 8.95 years. On these grounds, demographic aging appears to be no different in humans than chimpanzees.
As we show, however, human MRDTs can be much slower than 7–9 years. The human variation is not only wider but also strongly dependent on the young adult mortality rate. The rate of demographic aging is faster when young adult mortality is lower (Gavrilov and Gavrilova, 1991, 2001; Strehler and Mildvan, 1960). It is opposite in direction to the variation between species. In cross-species comparisons the increase in the hazard is slower—MRDTs longer—as background mortality levels drop (Sacher, 1977).
We argue that population heterogeneity must contribute to the within-species pattern. Frail individuals die earlier. They die even earlier under more severe conditions. Such “mortality selection” (Manton and Stallard, 1984), or simple culling (Wachter, 2003) changes the average risk of the survivors. When this effect of background risk on the rate of increase in mortality with age is taken into account, the difference in demographic aging patterns between chimpanzees and humans is recovered.
Heterogeneity also complicates comparison of fertility schedules across species. The age of terminal fertility varies widely among individual women and appears to do so among chimpanzees. If underlying heterogeneity affects both fertility and mortality in chimpanzees as its does in humans, it must push age-specific fertility in opposite ways in the two species. That is, because the lower mortality in women means that most outlive their fertility. Increasing numbers of women in their thirties and forties pass their last parturition. Their survival suppresses the fertility rates of the older age classes. In contrast, the relatively higher mortality among chimpanzees leaves few survivors through the fertile years. Only the most robust—who may be the most fertile—live into their forties. Both cross-species comparisons and contrasts between wild and captive chimpanzees display these initially paradoxical patterns.
We show similar rates of increase in mortality with age, and different patterns of fertility decline between human and chimpanzee populations and explain how both may be due to heterogeneity that varies with mortality level. That heterogeneity hypothesis is also consistent with comparisons of decline in physical performance in human communities with varying rates of young adult mortality. Heterogeneity must affect demographic parameters in all populations. Understanding the systematic effects, we address here is a necessary step to clarifying aging differences between humans and chimpanzees.
TRADEOFFS VERSUS HETEROGENEITY
Fundamental theory about life history evolution predicts that lower adult mortality strengthens selection against senescence because the lifetime value of possible future payoffs goes up when the chance of dying goes down (Kirkwood and Rose, 1991; Ricklefs, 1998; Williams, 1957). As the likelihood of future reproduction and survival increases, so does the optimal allocation to maintenance and repair. More somatic effort slows the rate of increase in mortality hazard across adulthood.
But if populations contain subpopulations that differ in their vulnerability, then the range of heterogeneity among survivors will vary with the severity of culling earlier in life. When external threats are greater, more of the frail individuals die earlier, so older age groups contain relatively fewer of them. Nam (1996) reviewed the history of this idea to explain mortality crossovers, especially between African-American and white Americans where age-specific death rates are often found to be higher for blacks in young and middle adulthood, but lower than whites at very old ages. Nam mentions Pearl’s (1922, p 23) version of the argument: that as improved living conditions saved the lives of ever more young people “there appear now in higher age groups of the population many weaker individuals than formerly ever got there.”
ADULT MORTALITY COMPARISONS
To compare survival curves among populations, Gurven and Kaplan (2007) used Siler models which incorporate parameters for infant and juvenile mortality. Because our investigation is focused on adult mortality hazards, we use Gompertz’s (1825) classic approach for measuring the rate of aging from demographic data. A separate age-independent component subsequently added by Makeham (1867) is widely used, but we dispense with it in our analyses. As others have noted, it adds little to the fit and can create numerical convergence problems (Bebbington et al., 2007; Konigsberg and Frankenberg, 2002). Moreover, there is no simple way to distinguish empirically how much mortality should be assigned to this component versus the baseline mortality parameter in Gompertz (Finch, 1990). Finch (1990) further justified the use of the original two-parameter Gompertz function to describe aging rates by its fit across a wide variety of vertebrates:
| (1) |
In this formulation, m is the mortality hazard rate, G describes the rate of increase in adult mortality with increasing age (or t), and A represents all age-independent adult mortality, both due to general species vulnerability and also to threats that may vary among populations of the same species depending on local conditions. Finch (1990) labeled that risk of death the initial mortality rate (IMR). Taking the natural log, Eq. (1) yields a line representing the logarithm of the hazard of death across adulthood with the log of the IMR as its intercept, and G as its slope.
With the Gompertz model, differences in longevity between populations of the same species or between species can be due either to differences in the initial mortality rate, differences in G (or its transformed value, ln2/G, the mortality rate doubling time {MRDT}), or some combination of both. Many (including Finch, 1990) have cautioned that mortality schedules differing only in the Makeham constant will appear to differ in both of the Gompertz parameters if the Makeham constant is ignored. To minimize this problem, and in the spirit of Finch’s simplification, we assess the slope (G) not from earliest adulthood but between the ages of 30 and 80 years.
Humans
Gurven and Kaplan (2007, p 328–329 their Figs. 1a and 2a) show the survival schedules and the mortality hazards to age 80 for the same set of hunter-gatherer populations that we use here. They pick the age of 40 as the beginning of senescent increases in mortality hazard in these populations. We use age 30 (and evaluate the difference this makes) to allow a direct comparison with chimpanzees.
Fig. 1.

The aging rates of the Gompertz models of the populations in Table 1. The slope of the log of the hazard by age (from 30 to 80) is plotted against the intercept of that line (the log of the hazard at age 30). For the nine human populations (open circles), the regression between these estimates is −0.976. The two chimpanzee estimates (solid circles) fall away from the human cases, although both their intercepts and slopes are within the human range (Table 1).
Fig. 2.
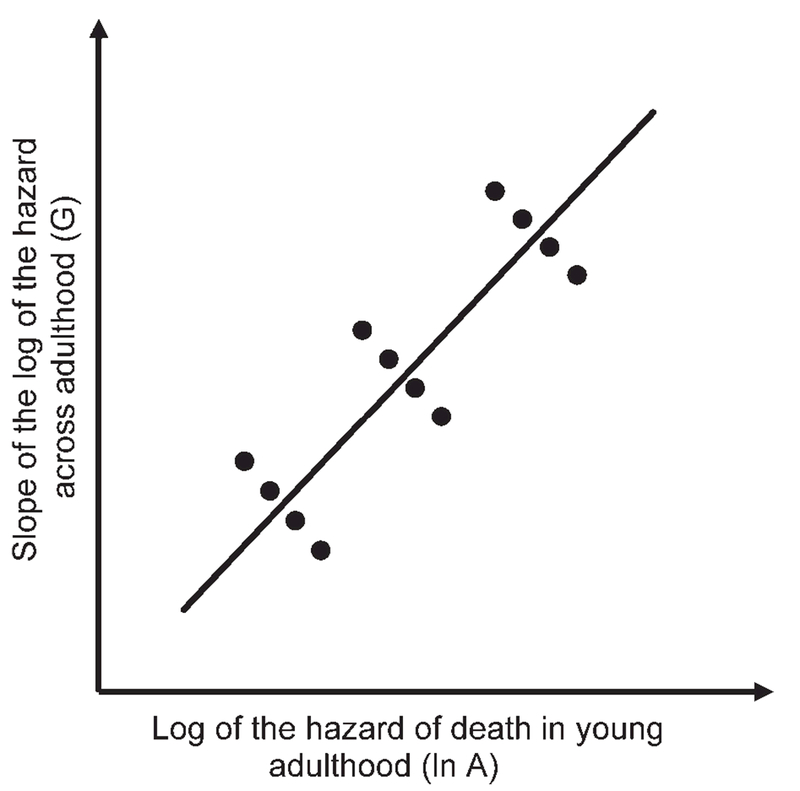
A schematic representation of within-species and cross-species correlations between rates of increase in the mortality hazard with age and mortality risk in young adulthood running in opposite directions. If the within-species slopes reflect differential heterogeneity, it is an ecological fallacy to equate those slopes with individual rates of aging.
We use female life tables for all but two of the populations (the !Kung, and the Agta) for which the sexes are not distinguished in the data sources. Our nine populations include the five hunter-gatherer cases used by Gurven and Kaplan (2007): the !Kung of southern Africa (Howell, 1979), the Ache of eastern Paraguay (Hill and Hurtado, 1996), the Agta of the Phillipines (Early and Headland, 1998), the Hadza of northern Tanzania (Blurton Jones, unpublished, the female life table which was not distinguished in Blurton Jones et al., 2002), and the Hiwi of Venezuela (Hill et al., 2007). We include two other populations, the US and Japan in 2002 to represent lower mortality levels, and an additional two to represent high mortality populations depending on agriculture: the rural farmers in China in the early 20th century (Barclay et al., 1976), and Gainj slash-and-burn cultivators in the Central Highlands of New Guinea (Wood, 1987). This convenience sample situates the hunter-gatherer cases within a wider range of socioecological diversity.
The stochasticity of demographic variables makes large samples necessary for valid estimates. Some of these life tables are based on small samples of deaths, so we used the hazard based on observed deaths for five-year age classes for all populations. The Gompertz parameters are listed in Table 1. Their fit to the data can be assessed by the linear correlation coefficient of the logarithm of the hazard of death across the age classes, listed in the second column of Table 1 with significance levels in column 3. The log of the hazards at age thirty, the intercepts of the Gompertz line are in column 4 with their standard errors in column 5. The hazard rates at age 30 (the IMRs or A in the Gompertz equation) are shown in column 6. The slopes (G) are in column 7 with their standard errors in column 8, and the mortality rate doubling times [MRDT = (ln2)/G]—inversely related to the slopes—are in column 9.
TABLE 1.
Gompertz parameters fitted from life tables for a convenience sample of nine human and two synthetic chimpanzee populations
| 1 | 2 | 3 | 4 | 5 | 6 | 7 | 8 | 9 | |
|---|---|---|---|---|---|---|---|---|---|
| Population | r | P | Intercept | SE | Exp (A) IMR | G Slope | SE | MRDT ln2/G | Sources |
| Human | |||||||||
| Japan 2002 | 0.998 | <0.001 | −6.325 | 0.049 | 0.0018 | 0.0845 | 0.002 | 8.2045 | Japan gov’t website |
| US 2002 | 0.999 | <0.001 | −5.692 | 0.023 | 0.0034 | 0.0849 | 0.001 | 8.1597 | US gov’t website |
| Ache forest | 0.757 | 0.018 | −3.509 | 0.423 | 0.0299 | 0.0527 | 0.017 | 13.1499 | Hill and Hurtado, 1996 |
| Hadza 1980s–90s | 0.879 | <0.001 | −3.658 | 0.322 | 0.0258 | 0.0609 | 0.012 | 11.3812 | Blurton Jones (unpub) |
| !Kung 1960s | 0.918 | <0.001 | −4.302 | 0.298 | 0.0135 | 0.0683 | 0.010 | 10.1434 | Howell, 1979 |
| Agta foraging phase | 0.774 | 0.024 | −1.870 | 0.154 | 0.1541 | 0.0212 | 0.007 | 32.7041 | Early and Headland, 1998 |
| Hiwi 1990s | 0.830 | 0.041 | −2.751 | 0.300 | 0.0461 | 0.0423 | 0.014 | 16.3675 | Hill et al., 2007 |
| Rural China 1930 | 0.961 | <0.001 | −2.567 | 0.109 | 0.0768 | 0.0408 | 0.004 | 16.9728 | Barclay et al., 1976 |
| Gainj 1980s | 0.992 | <.001 | −2.286 | 0.039 | 0.1017 | 0.0387 | 0.002 | 17.9255 | Wood, 1987 |
| Chimpanzee | |||||||||
| Free-ranging | 0.574 | 0.426 | −1.169 | 0.400 | 0.3107 | 0.0390 | 0.039 | 17.7783 | Hill et al., 2001 |
| Captive | 0.994 | <0.001 | −2.370 | 0.067 | 0.0935 | 0.0774 | 0.004 | 8.9535 | Dyke et al., 1995 |
GOMPERTZ
m(t) = AeGt
Ln m(t) = G*t + lnA
All life tables are females except for the !Kung and Agta for which sexes were not distinguished in the original sources. Parameters were calculated on 5 year age classes, conditional on survival to the beginning of the age class preceeding age 30. Column 2 is the goodness-of-fit of the Gompertz model with its significance level in column 3. Column 4 is the intercept Ln A (at age 30), with its standard error in column 5. Column 6 is hazard of death at age 30 (the IMR, exp(column 4)). Column 7 is G, the slope, with its standard error in column 8. Column 9 is the mortality rate doubling time of that aging slope [ln2/column 7].
Chimpanzees
We used two data sets. Captive chimpanzees are represented by the model female life table constructed by Dyke et al. (1995) with data from three captive populations. Wild chimpanzees are represented by the female life table in Hill et al. (2001) that synthesizes data from five free-ranging populations. Gompertz parameters for these two synthetic populations are shown in the bottom two rows of Table 1.
Variation in Gompertz parameters within-species
The slopes of the Gompertz models for the human populations vary widely. The nearly four-fold difference in the MRDTs is strongly affected by the Agta. Even without that case it is substantial. This human variation encompasses the wide variation in chimpanzees. In each species, the relationship between the demographic aging rate and the young adult mortality rate is opposite to the one expected from the tradeoff argument, and opposite to that generally found across species. An initial suspicion might be that this is some artifact of the modeling. Wood et al. (1992, p 69) memorably criticized reliance on Gompertz models, saying “The [IMR] and MRDT are summary measures derived from the untestable fit of an atheoretical model to imperfect data.” We offer no brief here for any of the many theories devised to explain why mortality rates generally fit Gompertz models. But, to check the possibility that the relationship is a necessary consequence of the Gompertz specifications, we constructed Weibull models from the same data and found the same result (not shown). Finch et al. (1990) provided a further demonstration. Although Australian prisoners in Japanese prison camps during the Second World War experienced mortality rates 30-fold higher than civilians, the slope of the increase between the ages of 30 and 80 was unchanged. As this example indicates, G and A can vary independently. But, barring brief shifts in background mortality like those represented by the prisoners of war (and to which we return), the rate of increase in the risk of death across adulthood is slower when the young adult mortality is higher.
Figure 1 plots the two Gompertz parameters (G and ln A) against each other for the nine human populations (the open circles), r = −0.978 (P < 0.001); for the 5 forager cases alone r = −0.992 (P = 0.001). Even if the Agta are excluded as an extreme value, the young adult mortality rates (IMRs) vary by more than a factor of 55 and the mortality rate doubling times vary about twofold. The higher the IMRs, the longer the MRDTs. Instead of a faster increase in mortality with age when the likelihood of dying initially is greater (as a tradeoff assumption might predict), the relationship is reversed.
This relationship between Gompertz parameters among populations of the same species shown in Figure 1 is consistent with a hypothesis of population heterogeneity and differential culling. When the IMR is low, more live to older ages, so the rate at which mortality risk increases across adulthood reflects the higher heterogeneity of the survivors. Conversely, when the IMR is high, survivors are less heterogeneous. The rate of increase in risk reflects larger proportions of survivors with higher (and less variable) vitality. The concentration camp data considered by Finch et al. (1990) and mentioned above are consistent with this hypothesis. Exposure to the harsh conditions of the camps raised the overall mortality. But, each age class of Australian prisoners was drawn from the civilian population and reflected the civilian heterogeneity; so, the rate of increase in mortality with age was unchanged.
The regression displayed in Figure 1 between the two Gompertz parameters for human populations confirms a previous finding. It was first shown by Strehler and Mildvan (1960) when they used a sample of national life tables drawn from the UN Demographic Yearbook for 1955 to test a prediction of their theory of aging in homogeneous populations. It has since been repeatedly found among human populations (e.g., Riggs et al., 1998; Yashin et al., 2001, 2002a) and across populations within other species (Gavrilov and Gavrilova, 1991; Pletcher and Neuhauser, 2000). Gavrilov and Gavrilova (1991) noted that the variation in the Makeham component—omitted by Strehler and Mildvan in their test—could give the erroneous appearance of such a correlation. They corrected Strehler and Mildvan’s calculations and found that the strong correlation persisted nevertheless. They labeled this the compensation law of mortality. “High mortality rates in disadvantaged populations (within a given species) are compensated for by low apparent “aging rates” (longer mortality doubling period)” (Gavrilov and Gavrilova, 2001, p 528).
We checked our results using different ages to represent IMRs, age 40—chosen by Gurven and Kaplan (2007) to be the beginning of senescent rise, and age 20 which is closer to the age at maturity and the beginning of senescence expected from theory (Hamilton, 1966; Williams, 1957). When IMR is set as the hazard at age 40, the correlation between it and the slope of the logarithm of the hazard from 40 to 80 for our nine human populations is −0.948 (P < 0.001). Although Gurven and Kaplan (2007) estimated Gompertz parameters from the Siler formulation, did not distinguish the sexes, and used different cases in addition to the five forager cases than we do, they also found the Strehler-Mildvan correlation to be “highly significant (r = 0.994, P < 0.001)” (p 345). If IMR is set at age 20, the correlation between the Gompertz variables for our human cases remains high: r = −0.975 (P < 0.001).
Comparison between species
The relative position of the plotted chimpanzee and human data points when IMR is calculated for the age of 20 and the slope is calculated from 20 to 80 changes little from that shown in Figure 1. In both, the chimpanzee populations fall away from the nine populations of humans. Neither the slope of the logged hazard rate nor the IMRs alone fully separate the two species, but as shown in Figure 1, each has a characteristic relationship between these parameters. The aging slope for chimpanzees is similar to humans only when the human populations have lower initial mortality rates.
In contrast to the Strehler-Mildvan correlations within-species, comparisons among different (related) species are often consistent with the tradeoff prediction. Sacher, 1977, p 586) calculated the Gompertz parameters for an array of mammals, concluding that “the 30-fold increase in life expectancy from mouse to man is accompanied by a 15-fold increase in the doubling time of mortality rate and an almost 500-fold decrease in [initial mortality rate].” In his cross-species analysis, he called the initial mortality rate “the vulnerability parameter, for it measures the initial vulnerability to disease, before the onset of aging. It is, therefore, related to the genetically determined vigor of the genotype” (1977, p 586). This relationship across species is consistent with the prediction that lower adult mortality rates strengthen selection against senescence and retard rates of increase in mortality with age.
Figure 2 shows how the relationships between IMR and demographic aging could run in one direction among populations of the same species and in the opposite direction between different species. Under this heterogeneity hypothesis, equating the demographic aging rate of a population with the risk for individuals that compose is an ecological fallacy (Robinson, 1950; Wilmoth and Horiuchi, 1999). This schematic shows species with characteristic endowments that set their ranges of initial vulnerability. It exploits Sacher’s (1977) suggestion that initial mortality rates depend on genetic endowments and follows Finch’s (1990; Finch et al., 1990) observation that selection should not only vary aging rates but also the vulnerability that sets rates of initial mortality. Different species in equally benign environments differ in their initial mortality rates because that hazard depends on species’ characteristic vulnerabilities as well as the local nutrition, parasites, pathogens, and predators they face. Populations of the same species can differ in both parameters because, depending on the dangers of the neighborhoods they occupy, culling is more or less severe. Where mortality threats are higher, the hazard increases more slowly as more of the frail die earlier.
FERTILITY DECLINE COMPARISONS
Just as subpopulations differ in mortality risk, they differ in fecundity. In all mammalian females, a large pool of oocytes develops near the time of birth and is subsequently depleted—mostly by atresia—throughout juvenile and adult life (vom Saal et al., 1994). Both the size of the initial stock and the rate of loss vary widely across mammalian species (Gosden and Telfer, 1987). Individual variation within-species may often be substantial.
Variation in terminal fertility among women
In our own species, where details of ovarian ontogeny and aging are far better described than for any other primate the variation among individuals is high (te Velde and Pearson, 2002). Among girls and women of the same age, remaining primordial follicle pools vary by two orders of magnitude. The exponential decline in follicular stocks that begins before birth reaches thresholds associated first with reduced fecundability, then sterility, and finally menopause at different ages in different women (Faddy and Gosden, 1996, O’Connor et al., 2001; Sievert, 2006). Analyzing menstrual records of 529 women accumulated prospectively through the 1970s, Treolar (1981) found that while the average age for the complete cessation of menses was 50–51, ages at menopause varied from as early as 41 to as late as 59. These data are displayed in Figure 3.
Fig. 3.

Percent of women past their last birth and percent past menopause by age in seven populations. Age at last parturition data come from three natural fertility populations (Utah data from UPDB, 2006; French data from Desjardins et al., 1994; Quebecois data from Müller et al., 2002). Age at menopause from four populations (Minnesota data from Treolar, 1981; Australia data from Do et al., 1998; Puebla data from Sievert and Hautaniemi, 2003; Norway data from Jacobsen et al., 2003). See text for more detail.
Figure 3 also shows the variation in ages at menopause in three other populations. One is Norwegian women (Jacobsen et al., 2003), represented by 19,731 subjects of whom 5% recalled their natural menopause at or before age 40 (collapsed here in the 35–39 year age class). Another is Australian women of whom 97 out of 1,693 postmenopausal subjects (5.7%) reached natural menopause before age 40 (Do et al., 1998). The last menopause data set is from interviews with 755 women in Puebla Mexico who reported their ages at natural menopause (Sievert and Hautaniemi, 2003).
Age at last birth in natural fertility populations also varies widely. Figure 3 includes plots of the cumulative distribution of ages at last delivery for three natural fertility populations: 2,462 women who were born 1845–1849 and lived to the age of 50 or later from the Utah Population Database (UPDB; Bean et al., 1990), 2,678 women born before 1715 in Quebec (Desjardins et al., 1994), and 1,578 women born before 1750 in four French villages of the Haut-Jura (Desjardins et al., 1994). As Figure 3 indicates, 5–17% of women may have had their last delivery by the age of 35, whereas another 10% do not do so until after 45.
Linked heterogeneity in fertility and mortality
Age distributions of last births and menopause in Figure 3 are similar, but offset by up to 10 years. Although the data come from different populations, it is likely that women with later last deliveries would also have later ages at menopause. This heterogeneity in ovarian aging is also associated with variation in general health and vigor and in mortality risk. Perls et al. (1997), studying centenarians, found their subjects four times more likely to have last births after the age of forty than women born in the same year who died in their seventies. The correlation was also found in three of the populations plotted in Figure 3. Müller et al. (2002) found a positive correlation between age at last birth and subsequent survival in 18th century Quebecois. Smith et al. (2002) found the same correlation in the UPDB. Jacobsen and colleagues (2003) found that age at last delivery was positively related to age at menopause in their Norwegian sample, with increasing age at menopause in turn related to significant increases in subsequent survival. They noted that their results support Snowdon et al.’s (1989) hypothesis that “a young age at menopause is a general indicator of premature aging” (Jacobsen et al., 2003, p 927). These are only a small sample of well-designed studies that have looked for, and more often than not, found correlations between age at last birth, menopause, and the duration of subsequent survival in women.
Fertility decline in chimpanzees
Captive chimpanzees ranging in ages from late thirties to late forties display perimenopausal changes very similar to humans (Gould et al., 1981; Graham, 1979). Although it can be said that menopause does not occur in chimpanzees because most females die in their fertile years (e.g, Caro et al., 1995; Lacreuse et al., 2008; Pavelka and Fedigan, 1991), an increasing body of evidence suggests that the process of ovarian senescence proceeds at the same rate in chimpanzees as it does in humans (Jones et al., 2007; Lacreuse et al., 2008; but see Videan et al., 2006).
Higher chimpanzee mortality, however, prevents detecting links between heterogeneity in fertility and mortality in the same way those links have been discovered in humans. Death during the childbearing years terminates fertility, so age at last birth can only serve as a marker of terminal fertility among mothers who live beyond those years. To avoid the error of including women whose fertility ended early because they died young, Perls et al. (1997) compared the age at last birth of centenarians with last births of women who died at 73. Smith et al. (2002) restricted their sample to women who lived past 60. Müller et al. (2002) compared women who lived at least to 50, and Jacobsen et al. (2003) compared ages at last birth, age at menopause, and subsequent mortality hazards among women who were postmenopausal. For chimpanzees, such a restriction leaves virtually no sample.
Consequences of linked heterogeneity in fertility and mortality
Emery Thompson et al. (2007) adopted an alternative strategy to detect linked heterogeneity in chimpanzees. They looked for associations between the rate of successful offspring production and mortality hazard. Fertilities for females over the age of 25 from six wild populations were divided into “healthy” years if the female survived an additional five or more years, and “unhealthy” if she did not. Fertility was significantly higher during healthy than the unhealthy years. When analysis was restricted to healthy years, the researchers found no significant decline in fertility from 25–29 to the 40–44 age class. Specific mother effects had a much larger impact on the duration of birth intervals than did maternal age. Noting the correlations between later fertility and longer survival in humans, Emery Thompson and colleagues point out that the same linked heterogeneity in chimpanzees would mean that especially fertile females are more likely to survive into their late thirties and forties.
For two of the populations included by Emery Thompson et al. (2007) and Gombe and Budongo, the highest age-specific fertilities are in the 40–44 year age class. This pattern could be the result of severe culling by this age. If low fertility females die at younger ages, their selective removal increases average fertility at older ages, even if the fertilities of the survivors themselves are usually declining from their own rates when younger. A similar problem of bias has been noted in assessments of variation in birth intervals with parity in humans (Mineau et al., 1979; Wood, 1994). Only fertile women can contribute birth intervals, and only highly fertile women can contribute intervals at high parities. When women of all parities are pooled, birth intervals can appear to be constant, or even decreasing across parities. In the same way (we hypothesize), if chimpanzees rarely outlive their fertility, and higher fertility is linked to higher survivorship, then age-specific fertility at older ages will be based only on high fertility females because the low fertility females have already died. This heterogeneity bias could explain the high age-specific fertilities of (wild) chimpanzees in their forties.
Consequences of lower mortality in captive chimpanzees
Captive chimpanzees experience lower mortality than free-ranging populations, allowing more frail individuals to survive to older ages. If frailty affects both fertility and mortality, then more females with lower fertility or earlier ovarian senescence should survive to older ages among captives than survive in the wild. Consistent with that expectation, pregnancy outcomes in captives show increasing failures with age. Roof et al. (2005) examined 1,255 pregnancies in 272 females from three Primate Research Centers and found a clear rise in spontaneous abortions and stillbirths with increasing maternal age, a result that parallels evidence of increasing fetal loss with increasing age in women (Holman and Wood, 2001; Wood, 1994).
Observations at Taronga Park Zoo where chimpanzees have been breeding naturally since the mid-1960s also show declining fertility among females in their thirties (Littleton, 2005). Age-specific fertilities are highest between the ages of 15 and 29. They drop 23% in the 30–34 year age class, and then another 61% in the 35–39 year age class to reach zero by 45. The decline is steeper and begins at earlier ages than in most of the wild populations, consistent with the expectation of greater heterogeneity among those surviving into their late thirties and forties in captivity relative to those in the wild.
If wild chimpanzee populations are increasingly culled of less fertile females, the trajectory of age-specific fertilities would differ from the human trajectory even if females in their early twenties had the same average remaining fertility in both species. Evidence consistent with that similarity comes from measurements of ovarian follicular reserve depletion with age in both species. A sample of ovaries from captive chimpanzees spanning the first year of life to the age of 47, shows an exponential decrease in primordial follicle counts with age that is indistinguishable from the rate of depletion with age in classic human data sets (Jones et al., 2007).
DISCUSSION
We conclude that the pervasive effects of heterogeneity must be considered carefully in order to make sense of demographic comparisons between humans and chimpanzees. With respect to mortality, humans do not have Mortality Rate Doubling Times that “are fairly similar across populations despite major differences in … overall mortality (Finch, 1990: Gurven and Kaplan, 2007) …” (Finch, 2007, p 12). Instead of ranging from 7–9 years, human MRDTs vary by more than a factor of two and depend on mortality level. Human MRDTs overlap those of chimpanzees. Adult mortality schedules do not differ between these species in either characteristic rates of demographic aging or in characteristic young adult mortality levels alone, but in the relationship between them. At a given level of mortality risk for young adults, the increase in risk with age is distinctly slower in humans. In both species, the rate of the demographic aging is slower when adult mortality rates are higher. Differential heterogeneity must contribute to this shift within-species because higher death rates remove more frail individuals at younger ages, leaving older age-classes to be increasingly dominated by those whose risks were always increasing more slowly.
Population fertility rate comparisons between the two species are also complicated by the effects of mortality level on heterogeneity. All human populations have substantial fractions of women who outlive their fertility, a characteristic feature we attribute to our grandmothering life history. Although last births occur at similar ages in both species, very few chimpanzees outlive their fertility. Culling is more severe in chimpanzees even for populations with similar initial mortality rates because the increase in mortality is steeper. In wild chimpanzees, heterogeneity in the fertility of survivors is always declining across the thirties and forties as those with low fertility die faster. The results are flat age-specific fertility curves with relatively high fertility in the over-thirty age-classes (Emery Thompson et al., 2007). In humans by contrast, women usually survive their fertility. At similar initial mortality rates, the human increase in mortality with age is slower. It is even slower where the level of young adult mortality is higher. The fraction of women no longer fertile begins to increase in the early thirties, reaching about 50% by forty (see Fig. 3). The infertile women, strong and healthy at these ages, are part of the denominator used to calculate age specific birth rates. It is survival of peri- and postmenopausal women that drives the descent of human population fertility rates after its peak in the thirties.
Gurven and Kaplan (2007, p 354) ask “Is a 50-year-old Hadza [hunter-gatherer] as robust and functional as a 50-year-old American?” The heterogeneity argument predicts the average Hadza at that age to be more robust than the average American. Available data on muscle strength are consistent with that prediction. Muscle strength affects the performance of a wide array of daily activities; so age-related changes in strength are used as a convenient assay of physiological senescence in people (Buchner and deLateur, 1991). In Western populations, where background mortality is low, strength measured on women declines across adulthood at about 0.5–1% per year from the ages of 20–70 (Hunter et al., 2000). Among hunter-gatherers where higher initial mortality rates remove weaker individuals earlier, women show little or no decline in strength with age into their sixties (Blurton Jones and Marlowe, 2002; Walker and Hill, 2003). Of course, higher activity levels among hunter-gatherer women must also contribute to the strength of those elders. When Western samples are separated by activity level, the more active women are stronger at all ages. But in Western samples, the slope of the decline in strength with age in the active subset is not much different from the slope for those who are inactive (Hunter et al., 2000). Biases in the heterogeneity of subjects in the Western studies may obscure the even steeper slopes that would be found in more representative samples. This is suggested by the steeper declines with age in longitudinal than in cross-sectional studies (Hughes et al., 2001). Those who enroll in cross-sectional studies at older ages may represent the relatively more vigorous. “For example, adults who choose to participate in a cross-sectional study may be more representative of “optimal agers,” whereas individuals who participate in longitudinal studies may remain in the study through sickness, disease, depression, and minor injuries” (Spirduso et al., 2005, p 122).
Although consistent with population differences in changing muscle strength with age, the appeal of the heterogeneity argument to fully account for Strehler-Mildvan correlations between IMR and MRDT within-species may nevertheless be misleading. Even though different background mortality levels in populations of the same species must result in different levels of heterogeneity at older ages, current models introducing gamma-distributed frailty within a Gompertz model generally do not yield a Gompertz mortality hazard. Those models have been used to explain the departure from Gompertz observed in mortality rates that occur at advanced ages, a deceleration in mortality rates that appears in human populations after the age of 80, among the old-aged in other species, and even in Fords and Toyotas (Vaupel et al., 1998). Wide recognition that mortality hazard rates are consistent with the Gompertz model until those old ages may be the reason others have not championed heterogeneity and different rates of culling to explain the Strehler-Mildvan correlation.
Strehler and Mildvan (1960) themselves, after assuming homogeneous populations in their aging model, then cited evidence of considerable variability in physiology and performance among individuals and explicitly considered heterogeneity. Their attempt to incorporate it also resulted in a bend either up or down from the linear Gompertz plot of the logarithm of the hazard of mortality by age. They concluded that “since real populations exhibit remarkably linear Gompertz kinetics up to great ages, we must assume either that variability is not great compared to [the average demand on it] or that subpopulations are made up of such mixtures [of variation in vitality and its rate of attrition] that opposing effects tend to cancel each other out” (1960, p 19).
Other modelers have also found that enough heterogeneity to shift slopes before the age of 80 also results in departures from Gompertz in these ages. Steinsaltz and Wachter (2006, p 31) ask, “what must the underlying baseline hazard function be for the mixed mortality to be exactly Gompertz?” The model they use to answer that question shows that hazard rates for the subpopulations must be hyperexponential, an unlikely possibility Yashin et al. (2002 a,b) illustrate how changes in the frailty distribution with age would alter the slope of the demographic aging parameter away from Gompertz. These results depend on the assumption of proportional hazards for the unobserved subpopulations. Alternative assumptions may better capture the essence embodied in the heterogeneity argument suggested here (e.g., Wilmoth and Horiuchi, 1999). Simple simulations show that subpopulations with Gompertz mortalities of differing slopes do result in population mortalities that are very close to Gompertz up to the age of 80. The use of covariates to identify subpopulations in empirical analyses is another way to expose subpopulation hazards and their effect on population rates. Studies of Stehler-Mildvan correlations largely ignore covariates because most data sets used to estimate the Gompertz parameters are based on aggregated rather than individual-level data. But the growing number of individual level historical human data sets, such as the UPDB, in which variation across cohorts clearly shows the Strehler-Mildvan pattern, may allow previously unobserved sources of heterogeneity to be identified and measured.
Both fertility and mortality rates in human populations reveal our distinctively high survival past last parturition. The hypothesis that this feature of human life history evolved due to the economic productivity of ancestral grandmothers guided us to the puzzles reported here. Consistent with that hypothesis, we expected that humans and chimpanzees would have different rates of demographic aging and similar age specific fertility declines. Instead, we found similar demographic aging rates and the highest fertility in chimpanzee age groups that have fertility approaching zero in humans. Those findings provoked us to investigate variation among human populations more closely and to find that each puzzle could be a systematic effect of mortality levels on population heterogeneity. Differential heterogeneity has been recognized to have large effects on vital rates before (Vaupel and Yashin, 1985). However, the probable systematic effects we suggest on variation in mortality rates among human populations, as well on differences and similarities in vital rates between humans and chimpanzees, have yet to receive the attention they will require in continuing investigations of the evolution of human aging.
ACKNOWLEDGMENTS
We thank N. G. Blurton Jones, M. Emery Thompson, C. E. Finch, H. C. Harpending, A. R. Rogers, and K. W. Wachter for their help with the problems treated here, and are grateful to R. Sear and M. Gibson for organizing the IUSSP workshop on Trade-offs in Female Life Histories that provided the venue for further improvements.
LITERATURE CITED
- Alvarez HP. 2000. Grandmother hypothesis and primate life histories. Am J Phys Anthropol 133:435–450. [DOI] [PubMed] [Google Scholar]
- Barclay GW, Coale AJ, Soto MA, Trussell J. 1976. A reassessment of the demography of traditional rural China. Popul Index 42:606–635. [PubMed] [Google Scholar]
- Bean LL, Mineau GP, Anderton DL. 1990. Fertility change on the American Frontier, adaptation and innovation. Berkeley: University of California Press. [Google Scholar]
- Bebbington M, Lai CD, Zitikis R. 2007. Modeling human mortality using mixtures of bathtub shaped failure distributions. J Theor Biol 245:528–538. [DOI] [PubMed] [Google Scholar]
- Blurton Jones NG, Hawkes K, O’Connell JF. 2002. The antiquity of post-reproductive life: are there impacts on hunter-gatherer post-reproductive life spans? Am J Hum Biol 14:184–205. [DOI] [PubMed] [Google Scholar]
- Blurton Jones NG, Marlowe F. 2002. Selection for delayed maturity: does it take 20 years to learn to hunt and gather? Hum Nat 13:199–238. [DOI] [PubMed] [Google Scholar]
- Buchner DM, deLateur BJ. 1991. The importance of skeletal muscle strength to physical function in older adults. Ann Behav Med 13:91–98. [Google Scholar]
- Cam E, Link WA, Cooch EG, Monnat JY, Danchin E. 2002. Individual covariation in life-history traits: seeing the trees despite the forest. Am Nat 159:96–105. [DOI] [PubMed] [Google Scholar]
- Caro TM, Sellen DW, Parrish A, Frank R, Brown DM, Voland E, Borgerhoff Mulder M. 1995. Termination of reproduction in nonhuman and human female primates. Int J Primatol 16:205–220. [Google Scholar]
- Desjardins B, Bideau A, Brunet G. 1994. Age of mother at last birth in two historical populations. J Biosoc Sci 26:509–516. [DOI] [PubMed] [Google Scholar]
- Do KA, Treloar SA, Pandeya N, Purdie D, Green AC, Heath AC, Martin NG. 1998. Predictive factors of age at menopause in a large Australian twin study. Hum Biol 70:1073–1091. [PubMed] [Google Scholar]
- Dyke B, Gage TB, Alford PL, Swenson B, Williams-Blangero S. 1995. Model life table for captive chimpanzees. Am J Primatol 37:25–37. [DOI] [PubMed] [Google Scholar]
- Early JD, Headland TN. 1998. Population Dynamics of a Philippine Rain Forest People: The San Ildefonso Agta. Gainesville: University Press of Florida. [Google Scholar]
- Emery Thompson M, Jones JH, Pusey AE, Brewer-Marsden S, Goodall J, Marsden D, Matsuzawa T, Nishida T, Reynolds V, Sugiyama Y, Wrangham RW. 2007. Aging and fertility in wild chimpanzees: implications for the evolution of menopause. Curr Biol 17:2150–2156. [DOI] [PMC free article] [PubMed] [Google Scholar]
- Faddy MJ, Gosden RG. 1996. A model conforming the decline in follicle numbers to the age of menopause in women. Hum Reprod 11:1484–1486. [DOI] [PubMed] [Google Scholar]
- Finch CE. 1990. Longevity, senescence, and the genome. Chicago: University of Chicago Press. [Google Scholar]
- Finch CE. 2007. The biology of human longevity: inflammation, nutrition, and aging in the evolution of lifespans. Amsterdam: Academic Press. [Google Scholar]
- Finch CE, Pike MC, Whitten M. 1990. Slow mortality rate accelerations during aging in some animals approximate that of humans. Science 249:902–905. [DOI] [PubMed] [Google Scholar]
- Gavrilov L, Gavrilova NS. 1991. The biology of life span: a quantitative approach. New York: Harwood Academic Publishers. [Google Scholar]
- Gavrilov LA, Gavrilova NS. 2001. The reliability theory of aging and longevity. J Theor Biol 213:527–545. [DOI] [PubMed] [Google Scholar]
- Gompertz B 1825. On the nature of the function expressive of the law of human mortality. Proc R Soc Lond B Biol Sci 115:513–585. [Google Scholar]
- Gosden RG, Telfer EE. 1987. Number of follicles and oocytes in mammalian ovaries and their allometric relationships. J Zool 211:169–175. [Google Scholar]
- Gould KG, Flint M, Graham CE. 1981. Chimpanzee reproductive senescence: a possible model for evolution of the menopause. Maturitas 3:157–166. [DOI] [PubMed] [Google Scholar]
- Graham CE. 1979. Reproductive function in aged female chimpanzees. Am J Phys Anthropol 50:291–300. [DOI] [PubMed] [Google Scholar]
- Gurven M, Kaplan H. 2007. Longevity among hunter-gatherers: a cross-cultural examination. Popul Dev Rev 33:321–365. [Google Scholar]
- Hamilton WD. 1966. The moulding of senescence by natural selection. J Theor Biol 12:12–45. [DOI] [PubMed] [Google Scholar]
- Hawkes K 2003. Grandmothers and the evolution of human longevity. Am J Hum Biol 15:380–400. [DOI] [PubMed] [Google Scholar]
- Hawkes K, O’Connell JF, Blurton Jones NG. 1997. Hadza women’s time allocation, offspring provisioning and the evolution of post-menopausal lifespans. Curr Anthropol 38:551–577. [Google Scholar]
- Hawkes K, O’Connell JF, Blurton Jones NG, Alvarez H, Charnov EL. 1998. Grandmothering, menopause, and the evolution of human life histories. Proc Natl Acad Sci USA 95:1336–1339. [DOI] [PMC free article] [PubMed] [Google Scholar]
- Hill K 1993. Life history theory and evolutionary anthropology. Evol Anthropol 2:78–88. [Google Scholar]
- Hill K, Boesch C, Goodall J, Pusey A, Williams J, Wrangham RW. 2001. Mortality rates among wild chimpanzees. J Hum Evol 39:1–14. [DOI] [PubMed] [Google Scholar]
- Hill K, Hurtado AM. 1996. Ache life history: the ecology and demography of a foraging people. New York: Aldine de Gruyter. [Google Scholar]
- Hill K, Hurtado AM, Walker RS. 2007. High adult mortality among Hiwi hunter-gatherers: implications for human evolution. J Hum Evol 52:443–454. [DOI] [PubMed] [Google Scholar]
- Hill K, Kaplan H. 1999. Life history traits in humans: theory and empirical studies. Ann Rev Anthropol 28:397–430. [DOI] [PubMed] [Google Scholar]
- Holman DJ, Wood JW. 2001. Pregnancy loss and fecundability in women In: Ellison PT, editor. Reproductive ecology and human evolution. New York: Aldine de Gruyter; p 15–38. [Google Scholar]
- Howell N 1979. Demography of the Dobe !Kung. New York: Academic Press. [Google Scholar]
- Hughes VA, Frontera WR, Wood M, Evans WJ, Dallal GE, Roubenoff R, Fiatarone Singh MA. 2001. Longitudinal muscle strength changes in older adults: Influence of muscle mass, physical activity, and health. J Gerontol A Biol Sci Med Sci 56A:B209–B217. [DOI] [PubMed] [Google Scholar]
- Hunter SK, Thompson MW, Adams RD. 2000. Relationships among age-associated strength changes and physical activity level, limb dominance, and muscle group in women. J Gerontol A Biol Sci Med Sci 55A:B264–B273. [DOI] [PubMed] [Google Scholar]
- Hrdy SB. 1999. Mother Nature: maternal instincts and how they shaped the human species. New York: Ballantine Books. [Google Scholar]
- Hrdy SB. 2005. Evolutionary context of human development: the cooperative breeding model In: CS Carter, Ahnert L, Grossman KE, Hrdy SB, Lamb ME, Porges SW, Sachser N, editors. Attachment and bonding: a new synthesis. Cambridge: MIT Press. [Google Scholar]
- Jacobsen BK, Heuch I, Kvale G. 2003. Age at natural menopause and all-cause mortality: a 37-year follow-up of 19,731 Norwegian women. Am J Epidemiol 157:923–929. [DOI] [PubMed] [Google Scholar]
- Japanese Government Statistics and Information Department, Ministry of Health, Labour and Welfare. (Accessed November 01, 2006, at http://www.stat.go.jp/english/index/official/tb0222.htm).
- Jones KP, Walker LC, Anderson D, Lacreuse A, Robson SL, Hawkes K. 2007. Depletion of ovarian follicles with age in chimpanzees: similarities to humans. Biol Reprod 77:247–251. [DOI] [PubMed] [Google Scholar]
- Kirkwood TBL, Rose MR. 1991. Evolution of senescence: late survival sacrificed for reproduction. Proc R Soc Lond B Biol Sci 332:15–24. [DOI] [PubMed] [Google Scholar]
- Konigsberg LW, Frankenberg SR. 2002. Deconstructing death in paleodemography. Am J Phys Anthropol 117:297–309. [DOI] [PubMed] [Google Scholar]
- Lacreuse A, Chennareddi L, Gould KG, Hawkes K, Wijayawardana SR, Chen J, Easley KA, Herndon JG. 2008. Menstrual cycles continue into advanced old age in the common chimpanzee (Pan troglodytes). Biol Reprod 79:407–412. [DOI] [PMC free article] [PubMed] [Google Scholar]
- Lee R 2008. Sociality, selection, and survival: Simulated evolution of mortality with intergenerational transfers and food sharing. PNAS 105:7124–7128. [DOI] [PMC free article] [PubMed] [Google Scholar]
- Littleton J 2005. Fifty years of chimpanzee demography at Taronga Park Zoo. Am J Primatol 67:281–298. [DOI] [PubMed] [Google Scholar]
- Makeham WH. 1867. On the law of mortality. J Inst Actuar 13:325–358. [Google Scholar]
- Manton KG, Stallard E. 1984. Recent trends in mortality analysis. Orlando: Academic Press. [Google Scholar]
- Mineau GP, Bean LL, Skolnick M. 1979. Mormon demographic history II: the family life cycle and natural fertility. Pop Studies 33:429–446. [Google Scholar]
- Müller H-G, Chiou J-M, Carey JR, Wang J-L. 2002. Fertility and life span: late children enhance female longevity. J Gerontol A Biol Sci Med Sci 57:B202–B206. [DOI] [PubMed] [Google Scholar]
- Nam CB. 1996. Another look at mortality crossovers. Soc Biol 42:133–142. [DOI] [PubMed] [Google Scholar]
- Nussey DH, Coulson T, Festa-Bianchet M, Gallaird JM. 2008. Measuring senescence in wild animal populations: towards a longitudinal approach. Funct Ecol 22:393–406. [Google Scholar]
- O’Connor KA, Holman DJ, Wood JW. 2001. Menstrual cycle variability and the perimenopause. Am J Hum Biol 13:465–478. [DOI] [PubMed] [Google Scholar]
- Partridge L, Harvey PH. 1988. The ecological context of life history evolution. Science 241:1449–1455. [DOI] [PubMed] [Google Scholar]
- Pavelka MSM, Fedigan LM. 1991. Menopause: a comparative lifehistory perspective. Yearb Phys Anthropol 34:13–38. [Google Scholar]
- Pearl R 1922. The biology of death. Philadelphia: JB Lippincott. [Google Scholar]
- Perls TT, Alpert L, Fretts RC. 1997. Middle aged mothers live longer Nature 389:133. [DOI] [PubMed] [Google Scholar]
- Pletcher SD, Neuhauser C. 2000. Biological aging—criteria for modeling and a new mechanistic model. Int J Mod Phys C 11:525–546. [Google Scholar]
- Ricklefs RE. 1998. Evolutionary theories of aging: confirmation of a fundamental prediction, with implications for the genetic basis and evolution of life span. Am Nat 152:24–44. [DOI] [PubMed] [Google Scholar]
- Riggs JE, Hobbs G, Gerald R. 1998. Nonrandom sequence of slope-intercept estimates in longitudinal Gompertzian analysis suggests biological relevance. Mech Age Dev 100:269–275. [DOI] [PubMed] [Google Scholar]
- Robinson WS. 1950. Ecological correlations and the behavior of individuals. Am Soc Rev 15:351–357. [DOI] [PubMed] [Google Scholar]
- Robson SL, van Schaik CP, Hawkes K. 2006. The derived features of human life history In: Hawkes K, Paine RR, editors. The evolution of human life history. Santa Fe: School of American Research Press; p 17–45. [Google Scholar]
- Roof KA, Hopkins WD, Izard MK, Hook M, Schapiro AJ. 2005. Maternal age, parity, and reproductive outcome in captive chimpanzees (Pan troglodytes). Am J Primatol 67:199–207. [DOI] [PMC free article] [PubMed] [Google Scholar]
- Sacher GA. 1977. Life table modification and life prolongation In: Finch CE, Hayfllick L, editors. Handbook of the biology of aging. New York: Van Nostrand; p 582–638. [Google Scholar]
- Service PM. 2000. Heterogeneity in individual mortality risk and its importance for evolutionary studies of senescence. Am Nat 156:1–13. [DOI] [PubMed] [Google Scholar]
- Sievert LL. 2006. Menopause: a biocultural perspective. New Brunswick: Rutgers University Press. [Google Scholar]
- Sievert LL, Hautaniemi SI. 2003. Age and menopause in Puebla, Mexico. Hum Biol 75:205–226. [DOI] [PubMed] [Google Scholar]
- Smith KR, Mineau GP, Bean LL. 2002. Fertility and post-reproductive longevity. Soc Biol 49:185–205. [PubMed] [Google Scholar]
- Snowdon DA, Kane RL, Beeson WL, Burke GL, Sprafka JM, Potter J, Iso H, Jacobs DR, Phillips RL. 1989. Is early menopause a biological marker of health and aging? Am J Public Health 79:709–714. [DOI] [PMC free article] [PubMed] [Google Scholar]
- Spirduso WW, Francis KL, MacRae PG. 2005. Physical dimensions of human aging, 2nd ed. Champaign: Human Kinetics. [Google Scholar]
- Stearns SC. 1992. The evolution of life histories. Oxford: Oxford University Press. [Google Scholar]
- Steinsaltz DR, Wachter KW. 2006. Understanding mortality rate deceleration and heterogeneity. Math Popul Stud 13:19–37. [Google Scholar]
- Strehler BL, Mildvan AS. 1960. General theory of mortality and aging. A stochastic model relates observations on aging, physiologic decline, mortality, and radiation. Science 132:14–21. [DOI] [PubMed] [Google Scholar]
- Te Velde ER, Pearson PL. 2002. The variability of female reproductive ageing. Hum Reprod Update 8:141–154. [DOI] [PubMed] [Google Scholar]
- Treolar AE. 1981. Menstrual cyclicity and the pre-menopause. Maturitas 3:249–264. [DOI] [PubMed] [Google Scholar]
- United States National Center for Health Statistics. (Accessed November 01, 2006, available at: http://www.cdc.gov/nchs/products/pubs/pubd/vsus/vsus.htm).
- Utah Population Database. (Accessed November 01, 2006, at (http://www.huntsmancancer.org/groups/ppr/data.html).
- van Noordwijk AJ, de Jong G. 1986. Acquisition and allocation of resources: Their influence on life history traits. Am Nat 128:137–142. [Google Scholar]
- Vaupel JW, Carey JR, Christensen K, Johnson TE, Yashin AI, Holm NV, Iachine IA, Kannisto V, Khazaeli AA, Liedo P, Longo VD, Zeng Y, Manton KG, Curtsinger JW. 1998. Biodemographic trajectories of longevity. Science 280:855–860. [DOI] [PubMed] [Google Scholar]
- Vaupel JW, Yashin AI. 1985. Heterogeneity’s ruses: some surprising effects of selection on population dynamics. Am Stat 39:176–185. [PubMed] [Google Scholar]
- Videan EN, Fritz J, Heward CB, Murphy J. 2006. The effects of aging on hormone and reproductive cycles in female chimpanzees (Pan troglodytes). Comp Med 56:275–283. [PubMed] [Google Scholar]
- vom Saal FS, Finch CE, Nelson JF. 1994. Natural history and mechanisms of reproductive aging in humans, laboratory rodents, and other selected vertebrates. In: Knobil E, Neill JD, editors. The physiology of reproduction, 2nd ed. New York: Raven Press; p 1213–1314. [Google Scholar]
- Wachter KW. 2003. Hazard curves and life span prospects. Pop Dev Rev 29:270–291. [PMC free article] [PubMed] [Google Scholar]
- Walker R, Hill K. 2003. Modeling growth and senescence in physical performance among the Ache of Eastern Paraguay. Am J Hum Biol 15:196–208. [DOI] [PubMed] [Google Scholar]
- Williams GC. 1957. Pleiotropy, natural selection, and the evolution of senescence. Evolution 11:398–411. [Google Scholar]
- Williams PD, Day T 2003. Antagonistic pleiotropy, mortality source interactions, and the evolutionary theory of senescence. Evolution 47:877–887. [DOI] [PubMed] [Google Scholar]
- Williams PD, Day T, Fletcher Q, Rowe L. 2006. The shaping of senescence in the wild. Trends Ecol Evol 21:458–463. [DOI] [PubMed] [Google Scholar]
- Wilmoth JR, Horiuchi S. 1999. Do the oldest old grow old more slowly? In: Forette B, Franceschi C, Robine JM, Allard M, editors. The paradoxes of longevity. Heidlberg: Springer-Verlag; p 25–60. [Google Scholar]
- Wood JW. 1987. The genetic demography of the Gainj of Paupa New Guinea, 2: Determinants of effective population size. Am Nat 129:165–187. [Google Scholar]
- Wood JW. 1994. Dynamics of human reproduction: biology, biometry, demography. New York: Aldine de Gruyter. [Google Scholar]
- Wood JW, Holman DL, Weiss KM, Buchanan AV, LeFore A. 1992. Hazards models for human population biology. Yearb Phys Anthropol 35:43–87. [DOI] [PubMed] [Google Scholar]
- Yashin AI, Begun AS, Boiko SI, Ukraintseva SV, Oeppen J. 2001. The new trends in survival improvement require a revision of traditional gerontological concepts. Exp Gerontol 37:157–167. [DOI] [PubMed] [Google Scholar]
- Yashin AI, Begun AS, Boiko SI, Ukraintseva SV, Oeppen J. 2002a. New age patterns of survival improvement in Sweden: do they characterize changes in individual aging? Mech Age Dev 123:637–647. [DOI] [PubMed] [Google Scholar]
- Yashin AI, Ukraintseva SV, Boiko SI, Arbeev KG. 2002b. Individual aging and mortality rate. Soc Biol 49:206–217. [DOI] [PubMed] [Google Scholar]
- Zens MS, Peart DR. 2003. Dealing with death data: individual hazards, mortality and bias. Trends Ecol Evol 18:366–373. [Google Scholar]