

Abstract
Objective
To examine the effect of supplementation with n-3 long chain polyunsaturated fatty acids (n-3 LCPUFA) in pregnancy on anthropometry and body composition in offspring.
Design
Double blinded, randomised controlled trial.
Setting
Copenhagen Prospective Studies on Asthma in Childhood2010 cohort.
Participants
736 pregnant women and their offspring.
Intervention
n-3 LCPUFA (fish oil) or control (olive oil) daily from pregnancy week 24 until one week after birth.
Main outcome measures
Height/length, weight, head, and waist measurements and body composition from dual energy x ray absorptiometry (all pre-specified secondary endpoints of the n-3 LCPUFA trial; the primary outcome for the trial was persistent wheeze/asthma).
Results
The mean body mass index (BMI) z score was increased between age 0 and 6 years in the fish oil supplementation group compared with the control group (0.14 (95% confidence interval 0.04 to 0.23); P=0.006). At 6 years, supplementation was associated with a higher BMI z score (0.19 (0.06 to 0.32); P=0.004), a higher weight/height (3.48 (0.38 to 6.57) g/cm; P=0.03), and a larger waist circumference (0.6 (0.0 to 1.2) cm; P=0.04) but not a higher proportion of obese children, using International Obesity Task Force grades. The dual energy x ray absorptiometry scan at age 6 years showed a higher total mass (395.4 (86.6 to 704.3) g; P=0.01) in the supplementation versus the control group, explained by a higher lean mass (280.7 (98.9 to 462.4) g; P=0.002), a higher bone mineral content (10.3 (2.3 to 18.1) g; P=0.01), and a non-significantly higher fat mass (116.3 (−92.9 to 325.5) g; P=0.28), but no differences were seen in total body fat or lean mass percentage.
Conclusion
Fish oil supplementation from the 24th week of pregnancy led to a higher BMI in the offspring from 0 to 6 years of age but not an increased risk of obesity at age 6. The body composition at age 6 years in children given fish oil supplementation was characterised by a proportional increase in lean, bone, and fat mass suggesting a general growth stimulating effect of n-3 LCPUFA.
Trial registration
Clinicaltrials.gov NCT00798226

Introduction
Diet during pregnancy and infancy is an important determinant for children’s development and health.1 In particular, intake of fish containing n-3 long chain polyunsaturated fatty acids (LCPUFA) is important for adequate development.2 In humans, both observational studies on dietary intake of fish and randomised controlled trials of n-3 LCPUFA (fish oil) supplementation in pregnancy and during lactation have consistently shown higher birth weight in children born to women with higher n-3 LCPUFA intake; this is mainly explained by an increase in gestational age, but an increase in size for gestational age has not been excluded.3 4 5 6 However, the long term effect on anthropometry during childhood is uncertain.7 8 9 10 Mechanistic studies in rats have shown that n-3 LCPUFA supplementation both during pregnancy and in the postnatal period affects the proliferation and differentiation of pre-adipocytes, which theoretically could prevent adiposity through inhibition of fat tissue.11 12 Despite these possible mechanisms, a recent systematic review of animal studies concluded that the evidence was insufficient to draw any definite conclusions on the role of n-3 LCPUFA supplied during pregnancy, lactation, or both on fat mass development in the offspring.13
Randomised controlled trials with n-3 LCPUFA supplementation in pregnancy and/or during lactation have shown diverging results but mainly no effects on anthropometric outcomes. Recent reviews have concluded that no evidence exists for n-3 LCPUFA supplementation affecting body mass index (BMI) or growth development in childhood.14 15 16 However, the amount of n-3 LCPUFA supplied varies widely, as does the combination of fatty acids used in the trials.
We had the opportunity to examine the question in the population based mother-child cohort Copenhagen Prospective Studies on Asthma in Childhood2010 (COPSAC2010), in which we did a double blind, randomised controlled trail of n-3 LCPUFA (fish oil) versus control (olive oil) supplementation from week 24 of pregnancy to one week postpartum.14 The primary endpoint of asthma or persistent wheeze showed a 31% reduction in risk in the group receiving fish oil.15 As a secondary endpoint, we aimed to investigate the effect of n-3 LCPUFA supplementation on growth and body composition in the offspring. We assessed BMI development at 11 clinical visits from birth to age 6 years and measured body composition from dual energy x ray absorptiometry scans at 3.5 and 6 years of age.
Methods
Trial design
This was a single centre, double blind, placebo controlled, parallel group study of 700 mother-child pairs.15 The recruitment procedure is detailed in the supplementary methods. The primary outcome of the n-3 LCPUFA trial was persistent wheeze/asthma.14 15 As a pre-defined secondary endpoint, we investigated anthropometric measurements through childhood and body composition by dual energy x ray absorptiometry scans.15
Trial intervention
The women were randomised 1:1 in a double blind design at pregnancy week 24 to either daily supplementation of 2.4 g n-3 LCPUFA (55% eicosapentaenoic acid (20:5 n-3) and 37% docosahexaenoic acid (22:6 n-3), Incromega TG33/22, Croda Health Care, UK) in triacylglycerol form or lookalike control supplementation capsules of olive oil (72% n-9 oleic acid and 12% n-6 linoleic acid, Pharmatech A/S, Norway). The supplementation was continued until one week after birth, and the trial was unblinded when the youngest child reached age 3 years.
Maternal fatty acid desaturase genotype
Maternal fatty acid desaturase gene variation was tagged by genotyping of the single nucleotide polymorphism rs1535 (LGC Limited, Hoddesdon, UK) in mothers of European descent (supplementary methods).15 16 We used the FADS genotype to do a genetic validation of our findings.
Adherence
We assessed adherence to the intervention by comparing the number of returned capsules against the expected number.
Anthropometry
Anthropometry was assessed at the COPSAC research unit at age 1 week, 1 month, 3 months, and 6 months, then every sixth month until age 2 years, and thereafter every year until age 6 years. The total number of visits to our clinic was 11.
Weight was measured without clothes by using calibrated digital weight scales. Length was measured until age 2 years by using an infantometer (Kiddimeter; Raven Equipment Ltd, Dunmow, Essex, England). Height from age 2 years and parental height were measured with a stadiometer (Harpenden, Holtain Ltd, Crymych, Dyfed, Wales), which was calibrated yearly.
Head circumference was measured with a tape, using the largest diameter as the endpoint. Waist circumference was measured with a tape, using the navel as a fix point; we used the mean of two measures during inspiration and expiration. We calculated World Health Organization age and sex specific BMI z scores for all measurements from 1 week to 6 years of age.16 We used International Obesity Task Force (IOTF) cut-offs for BMI to determine risk of overweight and obesity (above grade zero) and underweight (below grade zero).17
We obtained birth length and weight at the first clinical visit after birth by personal interview and validated the values against data from the Danish National Birth Registry. If the difference was larger than 10 g and 5 cm, we further validated data against the length and weight measures at 1 week from the research clinic. We derived size for gestational age from Marsál’s ultrasound based intrauterine growth curves.18 We used this standardized fetal growth curve to find the difference between each child’s birth weight and the expected birth weight given the gestational age and then calculated the percentage of expected birth weight. Percentage for gestational age is a sensitive measure for all ages.
Dual energy x ray absorptiometry scans
We did whole body scans with a Lunar iDXA densitometer (GE Healthcare, Fairfield, CT, USA) at 3.5 and 6 years of age. We analysed data on fat mass, lean mass (total mass minus bone mineral content and fat mass), bone mineral content, and bone mineral density for the total body less head.19 In addition, for fat mass and lean mass, we analysed specific regions of interest.20 21 22 We also calculated the percentage of fat mass and lean mass for total body mass less head and regions of interest. All analyses on dual energy x ray absorptiometry scan data were adjusted for sex and age at measurement. All analyses on body composition from the scans were adjusted for height+height^2 with regards to fat mass and lean mass and adjusted for height with regards to bone mineral content and bone mineral density. All dual energy x ray absorptiometry scan data were validated by an experienced specialist and analysed with enCore software.
Baseline characteristics
Collection and definition of baseline characteristics of the participants are described in the supplementary methods.
Statistical analysis
We included children with at least one anthropometric measurement at age 0-6 years and excluded twin pregnancies. We analysed the effect of n-3 LCPUFA supplementation on cross sectional anthropometric outcomes at 6 years of age (defined as the specific anthropometric measurement closest to 6 years±6 months) by using Student’s t test for normally distributed continuous variables and χ2 tests for categorical variables.
We analysed changes in BMI over time in a random intercept mixed model with BMI z scores as the outcome. Age related trends in the association between intervention and BMI were investigated in the mixed models by inclusion of an interaction term between age and intervention group. We treated missing observations as missing data and excluded them from analyses. The analyses were done for all children and stratified by sex. We found no interaction between the intervention with n-3 LCPUFA and an intervention with high dose vitamin D (data not shown).
We used R v3.1.0 (R Foundation for Statistical Computing, Vienna, Austria) for all data analyses and considered results with a P value below 0.05 to be statistically significant. The trial was powered according to the primary outcome of persistent wheeze/asthma. Therefore, the power of the randomised controlled trial on BMI was calculated post hoc on the basis of the 605 children who had six year BMI data available. This resulted in 80% power to detect a mean difference of 0.19 in BMI z score, with a standard deviation of 0.82. The power/sample size calculation and testing were based on a two sample, two tailed t test with an α of 0.05.
We analysed for interaction with regards to sex, age, size for gestational age, fatty acid desaturase genotype, and maternal pre-intervention blood concentrations of eicosapentaenoic acid and docosahexaenoic acid. A subgroup from this pregnancy cohort also participated in a nested, factorial designed, double blind, randomised controlled trial of 2400 IU/day of vitamin D3 supplementation (n=576). We did a sub-analysis excluding children with asthma at age 6 years and/or with lower respiratory tract infections before age 3 years. In a sub-analysis, we adjusted our primary outcomes for size for gestational age and birth weight.
Patient involvement
No patients were involved in setting the research question or the outcome measures, nor were they involved in developing plans for recruitment, design, or implementation of the study. No patients were asked to advise on interpretation or writing up of results. We ill disseminate the results of the research to study participants and the general public.
Results
Baseline characteristics
Enrolment ran from November 2008 to November 2010. We randomised 736 women at pregnancy week 24 to either n-3 LCPUFA or control supplementation (supplementary figure A); after excluding twin pregnancies, we included 688 children with at least one available anthropometric measurement in the trial, 341 (49%) in the n-3 LCPUFA supplementation group and 347 (51%) in the control group. Of these children, 605 (88%) had anthropometric measurements at the 6 years visit. Table 1 shows baseline characteristics of the pregnant women and their children, indicating successful randomisation.
Table 1.
Baseline characteristics of COPSAC2010 mother-child pairs who participated in n-3 long chain polyunsaturated fatty acids (n-3 LCPUFA) randomised controlled trial. Values are percentages (numbers) unless stated otherwise
| Characteristics | All (n=688) | n-3 LCPUFA (n=341; 49%) | Control (n=347; 51%) |
|---|---|---|---|
| Children | |||
| Male sex | 51 (351) | 49 (166) | 53 (185) |
| White ethnicity | 96 (660) | 97 (330) | 95 (330) |
| Season of birth: | |||
| Winter | 31 (210) | 28 (96) | 33 (114) |
| Spring | 27 (184) | 28 (94) | 26 (90) |
| Summer | 21 (147) | 21 (73) | 21 (74) |
| Autumn | 21 (147) | 23 (78) | 20 (69) |
| Mean (SD) exclusive breast feeding, days | 103 (60) | 104 (59) | 103 (60) |
| Mean (SD) difference in Marsál percentage* | 49.6 (28.4) | 51.5 (28.4) | 47.8 (28.3) |
| Born before week 37 | 4 (26) | 4 (12) | 4 (14) |
| Mean (SD) age at 6 years BMI measurement, years | 6.0 (0.2) | 6.0 (0.2) | 6.0 (0.2) |
| Mean (SD) age at 6 years DXA scanning, years | 6.2 (0.2) | 6.2 (0.2) | 6.2 (0.2) |
| Parents | |||
| Mean (SD) maternal age at birth, years | 32.2 (4.5) | 32.3 (4.4) | 32.1 (4.5) |
| Mean (SD) social circumstances† | 0.0 (1.0) | 0.0 (1.0) | 0.0 (1.0) |
| Mean (SD) maternal pre-pregnancy BMI | 24.6 (4.4) | 24.7 (4.2) | 24.4 (4.6) |
| Maternal asthma‡ | 26 (181) | 25 (84) | 28 (97) |
| Mean (SD) paternal height, cm | 181 (6.7) | 181 (6.3) | 181 (7.1) |
| Mean (SD) daily fish intake before inclusion, g | 28 (18) | 28 (17) | 28 (18) |
| Mean (SD) maternal pre-treatment blood concentrations of EPA+DHA§, % | 4.9 (1.2) | 4.9 (1.3) | 4.9 (1.2) |
| Pregnancy | |||
| Primiparity | 46 (314) | 44 (151) | 47 (163) |
| Pre-eclampsia | 4 (30]) | 4 (15) | 4 (15) |
| Smoking in pregnancy | 8 (52) | 6 (20) | 9 (32) |
| Antibiotics in pregnancy | 35 (239) | 35 (119) | 35 (120) |
| Mean (SD) Hadlock calculated in utero weight, g | 322.9 (53.4) | 320.7 (49.2) | 325.2 (57.2) |
| High dose vitamin D intervention | 42 (291) | 41 (141) | 43 (150) |
BMI=body mass index; DHA=docosahexaenoic acid; DXA=dual energy x ray absorptiometry; EPA=eicosapentaenoic acid.
Calculation was based on Marsál’s intrauterine growth curves.
Social circumstances in household defined as first component of principal component analysis on household income, maternal age, and maternal level of education (see supplementary methods).
History of asthma diagnosed by doctor.
Relative percentage of measured blood fatty acids.
Adherence
We estimated adherence to the study supplementation, defined as an intake of more than 80% of the prescribed dose based on capsule count, to be 71%. We found no differences between the n-3 LCPUFA (n=242) and control group (n=245).
n-3 LCPUFA supplementation and BMI development during childhood
The n-3 LCPUFA supplementation group had a significantly higher BMI z score from 1 week to 6 years of age compared with the control group, estimated using a mixed effects model of the repeated measurements of BMI (mean z score difference 0.14 (95% confidence interval 0.04 to 0.23); P=0.006). We observed a significant interaction between age and intervention group (P for interaction=0.03). Figure 1 (top) illustrates development of BMI from birth to age 6 years according to intervention group, showing that children in the n-3 LCPUFA group had a higher BMI at age 1 week and a higher BMI from 1 year to 6 years, whereas no clear separation in BMI z score existed in the age range 1 week to 6 months (fig 1, bottom).
Fig 1.
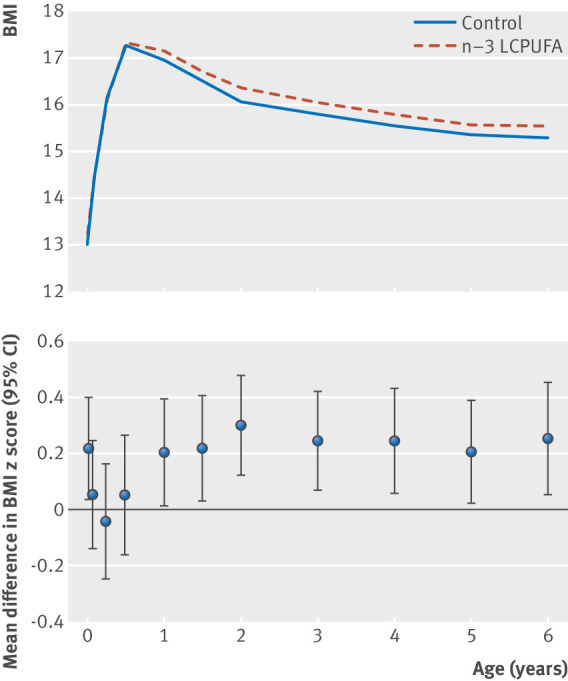
Top: curves showing mean body mass index (BMI) according to visit age for children in n-3 long chain polyunsaturated fatty acid (n-3 LCPUFA) supplementation group and control group up to age 6 years. Bottom: effects of n-3 LCPUFA supplementation on BMI through infancy and childhood, illustrated by mean difference in BMI z score at each visit and 95% confidence intervals
A sensitivity analysis restricted to children with more than 11 growth measurements (n=414) showed similar results (mean z score difference 0.18 (0.06 to 0.31); P=0.004). The effects of the intervention on BMI z score development was similar in boys and girls (supplementary figure B), and no significant interaction existed between sex and intervention group (P=0.79).
Because n-3 LCPUFA supplementation also reduced the risk of asthma and lower respiratory tract infections,15 we did a sub-analysis excluding children with asthma at age 6 years, lower respiratory tract infections before age 3 years, or both. This did not affect the association between n-3 LCPUFA supplementation and BMI development (data not shown).
n-3 LCPUFA supplementation and anthropometric measurements at 6 years of age
Children in the n-3 LCPUFA supplementation group had a significantly higher BMI z score at age 6 years compared with the control group (sex and age adjusted: mean difference 0.19 (0.06 to 0.32); P=0.004), a higher weight/height (3.48 (0.38 to 6.57) g/cm; P=0.03), and a larger waist circumference (0.6 (0.0 to 1.2) cm; P=0.04), whereas no differences existed in height or head circumference (table 2).
Table 2.
Effects of n-3 long chain polyunsaturated fatty acids (n-3 LCPUFA) on anthropometric measurements at 6 years of age
| Measurement | n-3 LCPUFA (n=304) | Control (n=301) | P value |
|---|---|---|---|
| Mean (SD) BMI z score | 0.1 (0.8) | −0.1 (0.8) | 0.004 |
| Mean (SD) waist circumference, cm | 55.5 (3.8) | 54.8 (3.7) | 0.04 |
| Mean (SD) weight, kg | 21.8 (2.9) | 21.4 (2.9) | 0.11 |
| Mean (SD) height, cm | 118.2 (4.6) | 118.2 (5.1) | 0.97 |
| Mean (SD) weight/height, g/cm | 183.7 (19.1) | 180.7 (18.7) | 0.03 |
| Mean (SD) head circumference, cm | 52.1 (1.4) | 52.1 (1.4) | 0.83 |
| % BMI z score <10/>90th centile | 9/11 | 11/10 | 0.63 |
| % (No) BMI z score <25th centile | 22 (66) | 30 (90) | 0.02 |
| % (No) BMI z score >75th centile | 30 (91) | 21 (62) | 0.02 |
| % (No) IOTF grade>0* | 5 (16) | 5 (14) | 0.89 |
| % (No) IOTF grade<0† | 9 (26) | 10 (30) | 0.62 |
BMI=body mass index; IOTF=International Obesity Task Force.
IOTF above grade zero means child is at risk of adulthood overweight and obesity.
IOTF below grade zero means child is at risk of adulthood underweight.
A higher proportion of children from the n-3 LCPUFA supplementation group had a BMI z score in the highest quarter (29% (n=91) v 21% (n=62); P=0.02) and fewer had a z score in the lowest quarter (21% (n=66) v 30% (n=90); P=0.02) compared with the control group. However, no significant differences existed between the intervention groups among children with the highest or lowest 10% of BMI z score or in the prevalence of overweight or underweight children according to IOTF grades (table 2). Sex stratified analysis yielded no difference (supplementary table A). Adjusting the analyses for size for gestational age yielded comparable results (data not shown).
We found no interaction between the intervention and sex, size for gestational age, or maternal pre-intervention blood concentrations of eicosapentaenoic acid and docosahexaenoic acid in relation to the anthropometric outcomes (data not shown). Furthermore, no interaction existed between the intervention with n-3 LCPUFA and the intervention with high dose vitamin D (data not shown).
We did a sub-analysis on the primary anthropometric outcomes in which we adjusted the analyses for size for gestational age; this yielded comparable results (data not shown). Furthermore, we adjusted the primary anthropometric outcomes for birth weight, and this also yielded comparable significant results, although with a small reduction in the effect of n-3 LCPUFA supplementation (data not shown).
n-3 LCPUFA supplementation and body composition
At 6 years of age, 523 (76%) of 688 children completed a dual energy x ray absorptiometry scan. The n-3 LCPUFA group had a higher total body mass in the total body less head compartment compared with controls (19 361.0 v 18 967.0 g; height adjusted mean difference 395.4 (86.6 to 704.3) g; P=0.01). This was similar to the measured weight difference at age 6 years.
Sub-analyses on tissue type showed that the children in the n-3 LCPUFA supplementation group had a significantly higher lean mass in the total body less head compartment (mean difference 280.7 (98.9 to 462.4) g; P=0.002) and in the trunk (127.2 (29.4 to 242.9) g; P=0.01). Children in the n-3 LCPUFA supplementation group had a higher total body less head bone mineral content (10.3 (2.3 to 18.1) g; P=0.01) and a trend towards a higher bone mineral density (0.005 (−0.001 to 0.012) g/cm2; P=0.08). The n-3 LCPUFA supplementation group had a non-significantly higher fat mass in total body less head (116.3 (−92.9 to 325.5) g; P=0.28), but we found no difference in total body fat percentage or lean mass percentage (table 3). Figure 2 shows the proportional increase in lean, fat, and bone mass for children in the n-3 LCPUFA supplementation group at 6 years of age.
Table 3.
Effects of n-3 long chain polyunsaturated fatty acids (n-3 LCPUFA) on dual energy x ray absorptiometry measurements at 6 years of age. Values are mean (SD) unless stated otherwise
| Measurement | Crude | Adjusted* | |||
|---|---|---|---|---|---|
| n-3 LCPUFA (n=263) | Control (n=260) | Estimate (95% CI) | P value | ||
| Fat (TBLH), kg | 4.78 (1.56) | 4.64 (1.40) | 0.12* (−0.09 to 0.33) | 0.28 | |
| Fat % (TBLH) | 24.4 (5.0) | 24.2 (4.9) | 0.1 (−0.7 to 0.8) | 0.83 | |
| Fat (trunk), kg† | 1.80 (0.73) | 1.76 (0.68) | 0.02 (−0.08 to 0.13) | 0.69 | |
| Fat % (trunk) | 18.1 (5.2) | 18.0 (5.2) | 0.2 (−0.6 to 1.0) | 0.83 | |
| Fat (android), kg† | 0.21 (0.11) | 0.20 (0.11) | 0.003 (−0.01 to 0.02) | 0.71 | |
| Fat % (android) | 15.1 (5.7) | 14.9 (5.8) | 0.1 (−0.8 to 1.0) | 0.79 | |
| Lean mass (TBLH), kg† | 14.0 (2.02) | 13.8 (2.08) | 0.28 (0.10 to 0.46) | 0.02 | |
| Lean mass % (TBLH) | 72.8 (4.9) | 73.0 (4.8) | 0.0 (−0.7 to 0.7) | 0.94 | |
| Lean mass (trunk), kg† | 7.75 (1.03) | 7.65 (1.06) | 0.15 (0.03 to 0.22) | 0.01 | |
| Lean mass % (trunk) | 79.6 (5.2) | 79.7 (5.2) | −0.1 (−0.9 to 0.7) | 0.76 | |
| Total BMC (TBLH), kg‡ | 0.55 (0.09) | 0.54 (0.09) | 0.01 (0.002 to 0.02) | 0.01 | |
| Total BMD (TBLH), g/cm2 ‡ | 0.56 (0.05) | 0.56 (0.05) | 0.005 (−0.006 to 0.01) | 0.08 | |
BMC=bone mineral content; BMD=bone mineral density; TBLH=total body less head.
Adjusted for age and sex.
Additionally adjusted for height and height^2.
Additionally adjusted for height.
Fig 2.
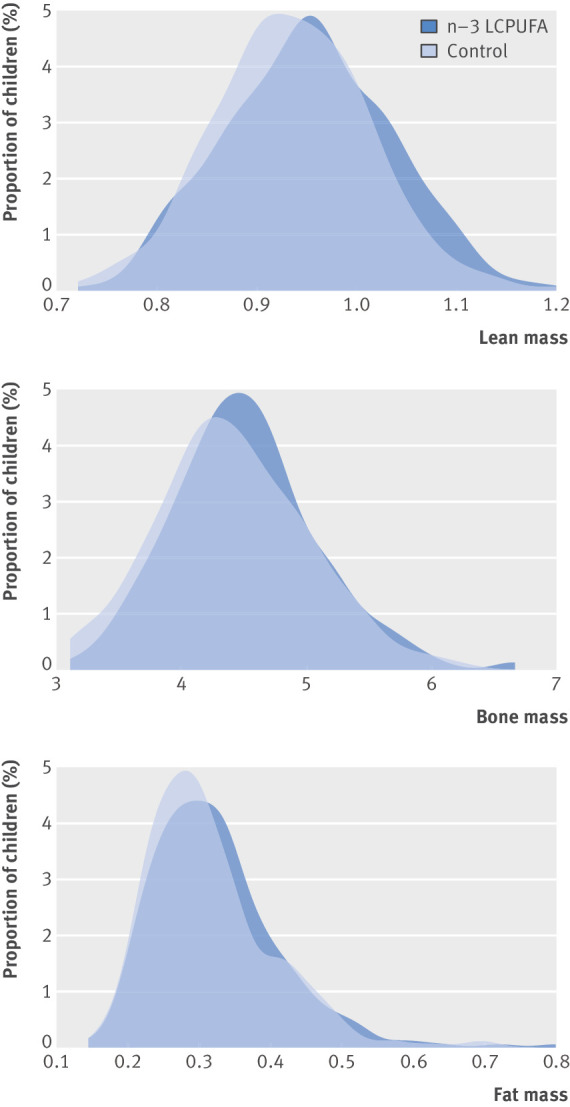
Density plot showing lean mass, bone mass, and fat mass stratified by supplementation groups: n-3 long chain polyunsaturated fatty acid (n-3 LCPUFA) and control. Lean mass and fat mass are adjusted for (height+height^2); g/cm+cm^2. Bone mass is adjusted for height; g/cm.
At 3.5 years of age, 356 (52%) of 688 children had available dual energy x ray absorptiometry scan data. No significant differences in body composition existed between the groups, but all estimates for lean mass, fat mass, and bone mineral content were higher in the n-3 LCPUFA supplementation group than the control group (supplementary table B). The number of participants completing the scans at 3.5 and 6 years was equal in the two supplementation groups (176 v 180 at 3.5 years; 263 v 260 at 6 years).
No interaction existed between the intervention and sex, size for gestational age, or maternal pre-intervention blood concentrations of eicosapentaenoic acid and docosahexaenoic acid in relation to the body composition outcomes at 6 years (data not shown).
Maternal FADS genotype and BMI development during childhood
In a sub-analysis, we investigated whether maternal FADS genotype was associated with BMI z score development and body composition of offspring. The maternal FADS gene variant rs1535 has been associated with blood concentrations of eicosapentaenoic acid and docosahexaenoic acid during pregnancy.23 24 We stratified the data by intervention groups and investigated the difference in BMI z score between children born to mothers with the FADS genotypes associated with higher concentrations of eicosapentaenoic acid and docosahexaenoic acid (AA/AG) and those with the genotype associated with lower concentrations (GG). In the control group, we found that the children born to mothers with the AA/AG genotype tended to have higher BMI z score values from 1 to 6 years of age (mean difference 0.2 (−0.0 to 0.5); P=0.08) and higher BMI z score at 6 years of age (mean difference 0.3 (0.1 to 0.5); P=0.01) compared with children born to mothers with the GG genotype (supplementary figure C and table C). In contrast, we found no association between FADS genotype and BMI z score or other anthropometrics outcomes in the n-3 LCPUFA supplemented group. No significant interactions existed between FADS genotype and effect from the intervention in relation to BMI z score or other anthropometric outcomes (table 3).
Discussion
Supplementation with n-3 LCPUFA in the third trimester of pregnancy resulted in a higher BMI in the children from age 1 to 6 years but no increase in the number of obese children. Body composition assessed by dual energy x ray absorptiometry scans confirmed that the higher BMI was not the result of a higher fat percentage but reflected a proportional increase in lean mass, bone mass, and fat mass, suggesting a general growth stimulating effect of the n-3 LCPUFA supplementation.
Strengths and limitations of study
Our trial is among the largest randomised controlled trials on n-3 LCPUFA supplementation in pregnancy. It is nested in a population based cohort, increasing the external validity of our findings. Adherence to both the supplementations (71%) and the trial was high, with 88% of the children having anthropometric measurements at age 6 years.
The longitudinal clinical follow-up with 11 visits during the first six years of life, including a broad range of anthropometric measures, is a significant strength of the trial. Each growth measurement was made using the same equipment by trained COPSAC assistants on the basis of standard operating procedures, and the observed growth curves were similar to previous reports.20
Another strength is the dual energy x ray absorptiometry scans providing objective measures of fat mass, lean mass, and bone mass, which enabled us to disentangle which tissues were affected by the intervention. The dual energy x ray absorptiometry estimates showed the same tendency at 3.5 years as at 6 years.
The observation of a higher BMI and higher weight in children born to mothers with the FADS genotypes causing higher concentrations of eicosapentaenoic acid and docosahexaenoic acid in the control group provides indirect support for our findings from the n-3 LCPUFA intervention, as this genetic variation is a marker not confounded by maternal eicosapentaenoic acid and docosahexaenoic acid intake.
The main limitation of the study is the follow-up to only 6 years of age, but the cohort is still being followed. Furthermore, we are reporting results on a secondary outcome. The power calculation was performed on our primary outcome: persistent wheeze or asthma. Therefore, we did not have the statistical power to examine the risk of developing either underweight or overweight according to IOTF grades. This makes interpretation of potential long term clinical implications difficult.
Interpretation
This trial is the first to show that n-3 LCPUFA supplementation in the third trimester of pregnancy leads to a higher BMI in offspring through childhood, whereas previous trials and systematic reviews showed no effect of n-3 LCPUFA supplementation during pregnancy and/or lactation on BMI or growth development in childhood.7 8 9 21 22 Potential explanations for the discrepancy between our findings and previous studies include differences in the dose and type of n-3 LCPUFA supplied, the timing of the supplementation, the trial design, and the accuracy of measurements. The dose of n-3 LCPUFA in our trial was 2.4 g per day, which is higher than in most previous studies, in which 900 mg or 1.5 g was administered,7 9 25 26 and the high number of participants increased the statistical power to detect effects on growth and body composition compared with previous studies.27 One other trial supplemented with a dose similar to ours from week 30 of pregnancy and completed follow-up for 243 participants at age 19 years, finding no effect on waist circumference or BMI, which could be caused by low numbers.28 In line with our findings, one previous trial supplementing mothers with 1.5 g n-3 LCPUFA (40% eicosapentaenoic acid) during the first four months of lactation showed a significantly higher BMI and increased waist circumference in the n-3 LCPUFA supplemented children at 2.5 years,29 but no differences were seen at 7 or 13 years of age.8 We previously reported that persistent wheeze/asthma in the first years of life was reduced by approximately one third in the n-3 LCPUFA supplemented group.15 We could therefore speculate that the higher BMI through childhood might be mediated by an effect on asthma/airway diseases. However, we did not find any changes in the effect when we excluded children with asthma and/or lower respiratory tract infections.
The BMI development curves and the significant interaction with age suggest that the effect of n-3 LCPUFA supplementation on BMI was most prominent after age 1 year. Risk of later obesity has been associated with early onset of peak BMI in infancy,30 which usually occurs at age 6 months. The lack of an effect of n-3 LCPUFA in the first year of life in our trial could therefore reflect that n-3 LCPUFA supplementation has a general growth stimulating effect, which does not increase the risk of overweight or obesity.
We have previously reported that n-3 LCPUFA supplementation resulted in a prolongation of pregnancy duration by two days, a higher birth weight, and increased size for gestational age (manuscript in review). However, adjusting the main analysis for size for gestational age did not change the results, so the increased BMI through childhood does not seem to be driven by the increased intrauterine growth. Furthermore, we did not find any differences between boys and girls, which is in line with most other studies.21
The n-3 LCPUFA supplementation in pregnancy led to a 0.4 kg higher weight at age 6 years, but our dual energy x ray absorptiometry data obtained at 3.5 and 6 years showed no difference in bone mass, fat mass, or lean mass percentages. Instead, we observed a proportional increase in all three compartments in the children from the n-3 LCPUFA supplemented group. Furthermore, we did not find any differences between the intervention groups with regard to IOTF grades or children in the highest or lowest 10% of BMI at 6 years. This suggests that mainly children with a BMI in the normal range were affected by the n-3 LCPUFA intervention. Also, the effect of n-3 LCPUFA supplementation on bone mineral content and bone mineral density might imply a positive health benefit in terms of decreased risk of later fragile bones.31
Finally, we interpret the effect on BMI z score through childhood as a consequence of a healthy somatic growth stimulation to age 6. The cohort will be followed into adulthood to evaluate whether the effects on growth and body composition induced by n-3 LCPUFA supplementation in pregnancy are sustained.
Conclusion
Supplementation with n-3 LCPUFA in pregnancy led to a 0.4 kg higher weight in the first six years of life but not an increased risk of overweight or obesity. The n-3 LCPUFA supplementation resulted in a proportional increase in lean mass, bone mass, and fat mass, suggesting that n-3 LCPUFA supplementation in the third trimester of pregnancy stimulates healthy somatic growth to age 6 years.
What is already known on this topic
Animal studies have shown that n-3 long chain polyunsaturated fatty acids (n-3 LCPUFA) supplementation both during pregnancy and in the postnatal period affects adipogenesis
However, in humans, randomised trials with n-3 LCPUFA supplementation in pregnancy have shown ambiguous results regarding anthropometric outcomes later in childhood
What this study adds
n-3 LCPUFA supplementation in pregnancy led to increased body mass index (BMI) in childhood, with sustained elevated BMI from age 1 year to 6 years
No difference was seen in fat percentage, but a proportional increase in lean mass, bone mass, and fat mass was seen at 6 years
These findings confirm that n-3 LCPUFA affects fetal programming leading to changed growth
Acknowledgments
We express our deepest gratitude to the children and families of the COPSAC2010 cohort study for all their support and commitment. We acknowledge and appreciate the unique efforts of the COPSAC research team. We are grateful for the efforts of the Department of Clinical Physiology and Nuclear Medicine in Gentofte Hospital in conducting all the dual energy x ray absorptiometry scans on the children.
Web Extra.
Extra material supplied by the author
Supplementary materials
Contributors: HB was involved in the conception, design, and conduct of the trial and in acquisition, analysis, and interpretation of the data. All co-authors contributed substantially to the analysis and interpretation of the data and provided important intellectual input. RKV wrote the first draft of the manuscript. All authors agreed that the accuracy and integrity of the work has been appropriately investigated and resolved, and all approved the final version of the manuscript. The corresponding author had full access to the data and had final responsibility for the decision to submit for publication. The corresponding author attests that all listed authors meet authorship criteria and that no others meeting the criteria have been omitted. HB is the guarantor.
Funding: All funding received by COPSAC is listed on www.copsac.com. The Lundbeck Foundation (grant no R16-A1694), the Ministry of Health (grant no 903516), the Danish Council for Strategic Research (grant no 0603-00280B), and the Capital Region Research Foundation have provided core support to the COPSAC research centre. LDH is funded by a UK Medical Research Council career development award (MR/M020894/1) and works in a unit funded by the UK Medical Research Council and the University of Bristol (MC_UU_12013/5). The funding agencies did not have any role in the design and conduct of the trial; the collection, management, and interpretation of the data; or the preparation, review, or approval of the manuscript. No pharmaceutical company was involved in the trial.
Competing interests: All authors have completed the ICMJE uniform disclosure form at www.icmje.org/coi_disclosure.pdf (available on request from the corresponding author) and declare: no support from any organisation for the submitted work other than that described above; no financial relationships with any organisations that might have an interest in the submitted work in the previous three years; no other relationships or activities that could appear to have influenced the submitted work.
Ethical approval: The trial was conducted in accordance with the guiding principles of the Declaration of Helsinki and was approved by the local ethics committee (H-B-2008-093), and the Danish Data Protection Agency (2015-41-3696). Both parents gave written informed consent before enrolment.
Data sharing: Technical appendix, statistical code, and dataset available from the corresponding author at bisgaard @copsac.com. Participants’ consent was not obtained, but the presented data are anonymised and risk of identification is low.
Transparency statement: The lead author (the manuscript’s guarantor) affirms that this manuscript is an honest, accurate, and transparent account of the study being reported; that no important aspects of the study have been omitted; and that any discrepancies from the study as planned (and, if relevant, registered) have been explained.
References
- 1. Black RE, Allen LH, Bhutta ZA, et al. Maternal and Child Undernutrition Study Group Maternal and child undernutrition: global and regional exposures and health consequences. Lancet 2008;371:243-60. 10.1016/S0140-6736(07)61690-0 [DOI] [PubMed] [Google Scholar]
- 2. Lauritzen L, Hansen HS, Jørgensen MH, Michaelsen KF. The essentiality of long chain n-3 fatty acids in relation to development and function of the brain and retina. Prog Lipid Res 2001;40:1-94. 10.1016/S0163-7827(00)00017-5 [DOI] [PubMed] [Google Scholar]
- 3. Olsen SF, Grandjean P, Weihe P, Viderø T. Frequency of seafood intake in pregnancy as a determinant of birth weight: evidence for a dose dependent relationship. J Epidemiol Community Health 1993;47:436-40. 10.1136/jech.47.6.436 [DOI] [PMC free article] [PubMed] [Google Scholar]
- 4. Olsen SF, Sørensen JD, Secher NJ, et al. Randomised controlled trial of effect of fish-oil supplementation on pregnancy duration. Lancet 1992;339:1003-7. 10.1016/0140-6736(92)90533-9 [DOI] [PubMed] [Google Scholar]
- 5. Carlson SE, Colombo J, Gajewski BJ, et al. DHA supplementation and pregnancy outcomes. Am J Clin Nutr 2013;97:808-15. 10.3945/ajcn.112.050021 [DOI] [PMC free article] [PubMed] [Google Scholar]
- 6. Makrides M, Gibson RA, McPhee AJ, Yelland L, Quinlivan J, Ryan P, DOMInO Investigative Team Effect of DHA supplementation during pregnancy on maternal depression and neurodevelopment of young children: a randomized controlled trial. JAMA 2010;304:1675-83. 10.1001/jama.2010.1507 [DOI] [PubMed] [Google Scholar]
- 7. Muhlhausler BS, Yelland LN, McDermott R, et al. DHA supplementation during pregnancy does not reduce BMI or body fat mass in children: follow-up of the DHA to Optimize Mother Infant Outcome randomized controlled trial. Am J Clin Nutr 2016;103:1489-96. 10.3945/ajcn.115.126714 [DOI] [PubMed] [Google Scholar]
- 8. Lauritzen L, Eriksen SE, Hjorth MF, et al. Maternal fish oil supplementation during lactation is associated with reduced height at 13 years of age and higher blood pressure in boys only. Br J Nutr 2016;116:2082-90. 10.1017/S0007114516004293 [DOI] [PubMed] [Google Scholar]
- 9. Helland IB, Smith L, Blomén B, Saarem K, Saugstad OD, Drevon CA. Effect of supplementing pregnant and lactating mothers with n-3 very-long-chain fatty acids on children’s IQ and body mass index at 7 years of age. Pediatrics 2008;122:e472-9. 10.1542/peds.2007-2762 [DOI] [PubMed] [Google Scholar]
- 10. Imhoff-Kunsch B, Briggs V, Goldenberg T, Ramakrishnan U. Effect of n-3 long-chain polyunsaturated fatty acid intake during pregnancy on maternal, infant, and child health outcomes: a systematic review. Paediatr Perinat Epidemiol 2012;26(Suppl 1):91-107. 10.1111/j.1365-3016.2012.01292.x [DOI] [PubMed] [Google Scholar]
- 11. Kim H-K, Della-Fera M, Lin J, Baile CA. Docosahexaenoic acid inhibits adipocyte differentiation and induces apoptosis in 3T3-L1 preadipocytes. J Nutr 2006;136:2965-9. 10.1093/jn/136.12.2965 [DOI] [PubMed] [Google Scholar]
- 12. Ailhaud G, Massiera F, Weill P, Legrand P, Alessandri J-M, Guesnet P. Temporal changes in dietary fats: role of n-6 polyunsaturated fatty acids in excessive adipose tissue development and relationship to obesity. Prog Lipid Res 2006;45:203-36. 10.1016/j.plipres.2006.01.003 [DOI] [PubMed] [Google Scholar]
- 13. Muhlhausler BS, Gibson RA, Makrides M. The effect of maternal omega-3 long-chain polyunsaturated fatty acid (n-3 LCPUFA) supplementation during pregnancy and/or lactation on body fat mass in the offspring: a systematic review of animal studies. Prostaglandins Leukot Essent Fatty Acids 2011;85:83-8. 10.1016/j.plefa.2011.04.027 [DOI] [PubMed] [Google Scholar]
- 14. Bisgaard H, Vissing NH, Carson CG, et al. Deep phenotyping of the unselected COPSAC2010 birth cohort study. Clin Exp Allergy 2013;43:1384-94. 10.1111/cea.12213 [DOI] [PMC free article] [PubMed] [Google Scholar]
- 15. Bisgaard H, Stokholm J, Chawes BL, et al. Fish Oil-Derived Fatty Acids in Pregnancy and Wheeze and Asthma in Offspring. N Engl J Med 2016;375:2530-9. 10.1056/NEJMoa1503734 [DOI] [PubMed] [Google Scholar]
- 16. WHO Multicentre Growth Reference Study Group WHO Child Growth Standards: Growth velocity based on weight, length and head circumference: Methods and development. World Health Organization, 2009. [Google Scholar]
- 17. Cole TJ, Bellizzi MC, Flegal KM, Dietz WH. Establishing a standard definition for child overweight and obesity worldwide: international survey. BMJ 2000;320:1240-3. 10.1136/bmj.320.7244.1240 [DOI] [PMC free article] [PubMed] [Google Scholar]
- 18. Marsál K, Persson PH, Larsen T, Lilja H, Selbing A, Sultan B. Intrauterine growth curves based on ultrasonically estimated foetal weights. Acta Paediatr 1996;85:843-8. 10.1111/j.1651-2227.1996.tb14164.x [DOI] [PubMed] [Google Scholar]
- 19. Gordon CM, Leonard MB, Zemel BS, International Society for Clinical Densitometry 2013 Pediatric Position Development Conference: executive summary and reflections. J Clin Densitom 2014;17:219-24. 10.1016/j.jocd.2014.01.007 [DOI] [PubMed] [Google Scholar]
- 20. Tinggaard J, Aksglaede L, Sørensen K, et al. The 2014 Danish references from birth to 20 years for height, weight and body mass index. Acta Paediatr 2014;103:214-24. 10.1111/apa.12468 [DOI] [PubMed] [Google Scholar]
- 21. Stratakis N, Gielen M, Chatzi L, Zeegers MP. Effect of maternal n-3 long-chain polyunsaturated fatty acid supplementation during pregnancy and/or lactation on adiposity in childhood: a systematic review and meta-analysis of randomized controlled trials. Eur J Clin Nutr 2014;68:1277-87. 10.1038/ejcn.2014.158 [DOI] [PubMed] [Google Scholar]
- 22. Delgado-Noguera MF, Calvache JA, Bonfill Cosp X, Kotanidou EP, Galli-Tsinopoulou A. Supplementation with long chain polyunsaturated fatty acids (LCPUFA) to breastfeeding mothers for improving child growth and development. Cochrane Database Syst Rev 2015;7:CD007901. [DOI] [PMC free article] [PubMed] [Google Scholar]
- 23. Lemaitre RN, Tanaka T, Tang W, et al. Genetic loci associated with plasma phospholipid n-3 fatty acids: a meta-analysis of genome-wide association studies from the CHARGE Consortium. PLoS Genet 2011;7:e1002193. 10.1371/journal.pgen.1002193 [DOI] [PMC free article] [PubMed] [Google Scholar]
- 24. Steer CD, Hibbeln JR, Golding J, Davey Smith G. Polyunsaturated fatty acid levels in blood during pregnancy, at birth and at 7 years: their associations with two common FADS2 polymorphisms. Hum Mol Genet 2012;21:1504-12. 10.1093/hmg/ddr588 [DOI] [PMC free article] [PubMed] [Google Scholar]
- 25. Much D, Brunner S, Vollhardt C, et al. Breast milk fatty acid profile in relation to infant growth and body composition: results from the INFAT study. Pediatr Res 2013;74:230-7. 10.1038/pr.2013.82 [DOI] [PubMed] [Google Scholar]
- 26. Bergmann RL, Bergmann KE, Richter R, Haschke-Becher E, Henrich W, Dudenhausen JW. Does docosahexaenoic acid (DHA) status in pregnancy have any impact on postnatal growth? Six-year follow-up of a prospective randomized double-blind monocenter study on low-dose DHA supplements. J Perinat Med 2012;40:677-84. 10.1515/jpm-2012-0080 [DOI] [PubMed] [Google Scholar]
- 27. Voortman T, van den Hooven EH, Braun KV, et al. Effects of polyunsaturated fatty acid intake and status during pregnancy, lactation, and early childhood on cardiometabolic health: A systematic review. Prog Lipid Res 2015;59:67-87. 10.1016/j.plipres.2015.05.001 [DOI] [PubMed] [Google Scholar]
- 28. Rytter D, Bech BH, Christensen JH, Schmidt EB, Henriksen TB, Olsen SF. Intake of fish oil during pregnancy and adiposity in 19-y-old offspring: follow-up on a randomized controlled trial. Am J Clin Nutr 2011;94:701-8. 10.3945/ajcn.111.014969 [DOI] [PMC free article] [PubMed] [Google Scholar]
- 29. Lauritzen L, Hoppe C, Straarup EM, Michaelsen KF. Maternal fish oil supplementation in lactation and growth during the first 2.5 years of life. Pediatr Res 2005;58:235-42. 10.1203/01.PDR.0000169978.92437.58 [DOI] [PubMed] [Google Scholar]
- 30. Ong KK. Size at birth, postnatal growth and risk of obesity. Horm Res 2006;65(Suppl 3):65-9. [DOI] [PubMed] [Google Scholar]
- 31. Bonjour JP, Theintz G, Law F, Slosman D, Rizzoli R. Peak bone mass. Osteoporos Int 1994;4(Suppl 1):7-13. 10.1007/BF01623429 [DOI] [PubMed] [Google Scholar]
Associated Data
This section collects any data citations, data availability statements, or supplementary materials included in this article.
Supplementary Materials
Supplementary materials