

Abstract
The present study aimed to identify differentially expressed genes (DEGs) and biological processes (BPs) associated with asthma. DEGs between allergic asthma and healthy controls were screened from GSE15823. Gene Ontology and Kyoto Encyclopedia of Genes and Genomes pathway enrichment analyses were performed using Database for Annotation, Visualization and Integrated Discovery. A protein-protein interaction network was constructed, followed by module mining and functional analysis. Additionally, GSE41649 was downloaded to validate the reliability of the results. In GSE41649, DEGs were identified and compared with key DEGs identified in GSE15823. A total of 43 upregulated and 275 downregulated DEGs were obtained from GSE15823. Upregulated DEGs, such as nitric oxide synthase 2 (NOS2), were enriched in BPs related to oxidation reduction. Downregulated DEGs, such as chemokine (C-C motif) ligand 19 (CCL21) and Cys-X-Cys ligand (CXCL9), were enriched in immune response-related BPs. Protein tyrosine phosphatase receptor type C (PTPRC), CCL21, and CXCL9 were identified as hub genes. The DEGs in module 1 were significantly involved in the chemokine signaling pathway (P<0.05). The expression of the key genes obtained in GSE15823 demonstrated the same variation directions in the two datasets. The immune response, oxidants and nitric oxide metabolic pathways may have important roles in the progression of asthma. DEGs of PTPRC, CCL21, CXCL9 and NOS2 may be the potential targets for asthma diagnosis and treatment.
Keywords: asthma, differentially expressed genes, biological process, protein-protein interaction network
Introduction
Asthma is a severe inflammatory disorder of the airways that is characterized by hyperresponsiveness, obstruction and inflammation of the airways (1). It is a serious global health problem and individuals of all ages may be affected by this chronic airway disorder (2). The prevalence of asthma is rising globally (from 183 million in 1990 to ~242 million in 2013), particularly among children in industrialized countries (3,4). However, there is no cure for asthma at present, although symptoms may be improved with certain medications (5). Therefore, an improved understanding of the molecular mechanisms of this disease is required to discover novel therapeutic targets for patients with asthma.
Asthma is believed to be caused by the interaction of environmental and genetic factors (1). It has been suggested that environmental exposure, such as smoking, and various home allergens, including mold, dust mites and pollen, are associated with asthma (6). Estimates of heritability indicate that 35–80% of the variation in risk of developing asthma is due to genetic variation (7). For example, glutathione S-transferase mu 1, interleukin 10 (IL-10), cytotoxic T-lymphocyte-associated protein 4, leukotriene C4 synthase, IL-4 receptor and ADAM metallopeptidase domain 33 have been implicated in asthma (8). T-box 21 has been suggested to have a vital role in asthma pathobiology via regulation of T-helper 1 lineage commitment and interferon-γ generation (9). Furthermore, intracellular signaling component-associated pathways have been implicated in asthma pathogenesis (10). Although some potential biomarkers and functional pathways associated with asthma have been studied, current knowledge is not adequate enough for the effective diagnosis and treatment of this disease.
Bioinformatics has a vital role in identifying the underlying genetic basis of human disease (11). A study by Laprise et al (10) compared the expression of genes and transcripts between healthy controls and allergic asthma subjects in 2004 and deposited the gene expression profile, GSE15823, in the Gene Expression Omnibus (ncbi.nlm.nih.gov/geo/). A study by Vaillancourt et al (12) verified several differentially expressed genes (DEGs) identified by Laprise et al (10) as well as by Chamberland et al (13). However, Gene Ontology (GO), pathway functional enrichment and protein-protein interaction (PPI) networks based on the DEGs were not analyzed.
In the present study, bioinformatics methods were employed to identify DEGs in lung tissue samples from patients with asthma based on the gene expression profile of GSE15823. In addition, GO functions, pathways and PPI networks were analyzed to explore the potential functions, pathways and key genes involved in asthma. Furthermore, module mining and functional analysis from PPI networks were conducted. Notably, data validation based on another gene expression profile dataset was performed in order to validate the findings of the present study.
Materials and methods
Analysis of Affymetrix microarray data
The gene expression profile of GSE15823, based on the GPL8300 platform of Affymetrix Human Genome U95 Version 2 Array, was downloaded from the National Center of Biotechnology Information GEO database (ncbi.nlm.nih.gov/geo/). According to the criteria of the American Thoracic Society for the diagnosis of asthma (14), A total of 4 healthy subjects without a history of allergy or asthma and 4 patients with asthma meeting the criteria were recruited to the study by Laprise et al (10). Lung tissue samples were obtained from bronchial biopsies of the 8 subjects. In the present study, gene expression data of the 8 lung tissue samples were used for further analysis.
Data preprocessing and identification of DEGs
Raw Affymetrix data (in the form of CEL files) were downloaded and converted into expression values, followed by background correction. Subsequently, gene expression data were normalized using the robust multiarray average algorithm (15) of the Affy package (16) in Bioconductor software (version 3.4; http://www.bioconductor.org/packages/release/bioc/), followed by probe summarization.
Student's t-tests (17) were used to identify DEGs between asthma and healthy control samples. Adjusted P-values were obtained after the t-tests were performed and the fold-change (FC) was also calculated. An adjusted P-value of P<0.1 and |log2FC|>0.5 were selected as the criteria for DEG screening.
GO and pathway functional enrichment analyses of DEGs
Database for Annotation, Visualization and Integrated Discovery (DAVID; david.ncifcrf.gov) (18) is a tool that provides an extensive set of functional annotation. GO database (geneontology.org) (19) is a tool used for functional unification of large-scale genomics and includes three categories: Biological process (BP), molecular function and cellular component. Kyoto Encyclopedia of Genes and Genomes (KEGG) pathway database (20) covers various biochemical pathways. In the present study, GO BP functional and KEGG pathway enrichment analysis for upregulated and downregulated DEGs were performed with DAVID. The modified Fisher's exact P-value of P<0.1 and count >2 were used as thresholds.
PPI network construction and module functional analysis
The Search Tool for the Retrieval of Interacting Genes (STRING) (21) database provides experimental and predicted interaction information. In the present study, the STRING online tool was used to analyze the PPI pairs of DEGs with a combined score of >0.4. The PPI network was then visualized by Cytoscape (version 3.2.0) (22) and the proteins (genes) with the highest connectivity degrees in the PPI network were regarded as hub proteins (genes).
Modules may be defined in a data-driven fashion by identifying subgroups of genes sharing similar expression patterns across multiple conditions (23). From the PPI network, the significant modules with the top three Molecular Complex Detection (MCODE) scores were extracted for analysis using MCODE of Cytoscape (24) with default thresholds. These thresholds included: Degree cutoff, 2; node score cutoff, 0.2; k-core, 2; and maximum depth, 100. Subsequently, the DEGs in modules underwent GO and pathway enrichment analyses.
Data validation
In order to validate the reliability of the results of the present study, expression profile data of GSE41649 (13) were downloaded from the GEO database, based on the platform of GPL96 (HG-U133A) Affymetrix Human Genome U133A (Affymetrix Inc., Santa Clara, CA, USA). Additionally, 8 samples, including 4 healthy controls without a history of allergy or asthma and 4 patients with allergic asthma, were included in the dataset. DEGs between allergic asthma and control samples were identified and compared with the key DEGs identified in GSE15823. The pathways and GO functions enriched by these DEGs were analyzed using DAVID. P<0.05 and a count of >2 were considered to indicate a statistically significant result.
Results
Identification of DEGs
As demonstrated in Fig. 1, the raw expression data were well-normalized after preprocessing. A total of 318 DEGs were obtained between asthma samples and healthy subjects after microarray analysis, including 43 upregulated and 275 downregulated DEGs.
Figure 1.

Box plots of the normalization of expression data. Data (A) prior to and (B) following normalization. Log intensity, gene expression values.
GO and KEGG pathway enrichment analysis
The enriched functions of upregulated and downregulated DEGs are demonstrated in Table I. The upregulated DEGs, such as nitric oxide synthase 2 inducible (NOS2), were enriched in the BPs associated with oxidation reduction and nitric oxide metabolism. The downregulated DEGs, such as chemokine (C-C motif) ligand 21 (CCL21) and Cys-X-Cys ligand (CXCL9), were predominantly enriched in the BPs associated with the immune response.
Table I.
GO functional enrichment of upregulated and downregulated DEGs.
| Category | Description | Count | P-value |
|---|---|---|---|
| Upregulated DEGs | |||
| BP | GO: 0055114: Oxidation reduction | 6 | 1.62E-02 |
| BP | GO: 0043523: Regulation of neuron apoptosis | 3 | 1.91E-02 |
| BP | GO: 0006809: Nitric oxide biosynthetic process | 2 | 2.80E-02 |
| BP | GO: 0046209: Nitric oxide metabolic process | 2 | 3.03E-02 |
| BP | GO: 0042981: Regulation of apoptosis | 6 | 3.88E-02 |
| BP | GO: 0043067: Regulation of programmed cell death | 6 | 4.03E-02 |
| BP | GO: 0010941: Regulation of cell death | 6 | 4.08E-02 |
| BP | GO: 0031214 Biomineral formation | 2 | 8.40E-02 |
| Downregulated DEGs | |||
| BP | GO: 0006955: Immune response | 44 | 1.89E-14 |
| BP | GO: 0002449: Lymphocyte mediated immunity | 11 | 1.86E-07 |
| BP | GO: 0016064: Immunoglobulin mediated immune response | 10 | 1.98E-07 |
| BP | GO: 0019724: B cell mediated immunity | 10 | 2.74E-07 |
| BP | GO: 0002252: Immune effector process | 14 | 2.87E-07 |
| BP | GO: 0002460: Adaptive immune response based on somatic recombination of immune receptors built from immunoglobulin superfamily domains | 11 | 4.66E-07 |
| BP | GO: 0002250: Adaptive immune response | 11 | 4.66E-07 |
| BP | GO: 0006952: Defense response | 29 | 8.73E-07 |
| BP | GO: 0002443: Leukocyte mediated immunity | 11 | 1.32E-06 |
| BP | GO: 0002684: Positive regulation of immune system process | 17 | 1.85E-06 |
GO, gene ontology; DEGs, differentially expressed genes; BP, biological process; Description, the enriched GO function of DEGs; Count, number of DEGs.
The KEGG pathways of upregulated and downregulated DEGs are demonstrated in Table II. Upregulated DEGs were enriched in caffeine metabolism. Downregulated DEGs were enriched in immune-associated pathways, such as systemic lupus erythematosus, allograft rejection, and complement and coagulation cascades.
Table II.
KEGG pathway enrichment of upregulated and downregulated DEGs.
| Category | Description | Count | P-value |
|---|---|---|---|
| Upregulated DEGs | |||
| KEGG | hsa00232: Caffeine metabolism | 2 | 1.91E-02 |
| Downregulated DEGs | |||
| KEGG | hsa05322: Systemic lupus erythematosus | 12 | 7.52E-06 |
| KEGG | hsa04672: Intestinal immune network for IgA production | 8 | 7.43E-05 |
| KEGG | hsa05330: Allograft rejection | 7 | 1.03E-04 |
| KEGG | hsa05416: Viral myocarditis | 9 | 1.27E-04 |
| KEGG | hsa05332: Graft-versus-host disease | 7 | 1.63E-04 |
| KEGG | hsa04940: Type I diabetes mellitus | 7 | 2.49E-04 |
| KEGG | hsa05310: Asthma | 6 | 3.39E-04 |
| KEGG | hsa04610: Complement and coagulation cascades | 8 | 6.54E-04 |
| KEGG | hsa05320: Autoimmune thyroid disease | 7 | 7.29E-04 |
| KEGG | hsa04612: Antigen processing and presentation | 8 | 1.96E-03 |
| KEGG | hsa04514: Cell adhesion molecules | 10 | 2.06E-03 |
| KEGG | hsa05340: Primary immunodeficiency | 5 | 6.48E-03 |
| KEGG | hsa00071: Fatty acid metabolism | 5 | 1.04E-02 |
| KEGG | hsa04060: Cytokine-cytokine receptor interaction | 13 | 1.05E-02 |
| KEGG | hsa04062: Chemokine signaling pathway | 10 | 1.92E-02 |
| KEGG | hsa04640: Hematopoietic cell lineage | 6 | 3.77E-02 |
| KEGG | hsa05020: Prion diseases | 4 | 3.91E-02 |
KEGG, Kyoto Encyclopedia of Genes and Genomes; DEGs, differentially expressed genes; Description, the enriched GO function of DEGs; Count, number of DEGs.
PPI network construction
In total, 220 DEGs with 381 PPI interaction pairs were identified in the PPI network (Fig. 2). The top 20 nodes with the highest degrees in the PPI networks are demonstrated in Table III and were defined as hub proteins (genes). These hub proteins (genes) included cluster of differentiation 8a molecule (CD8A; degree, 30), protein tyrosine phosphatase receptor type C (PTPRC; degree, 26), fibronectin 1 (FN1; degree, 14), CCL21 (degree, 13) and CXCL9 (degree, 10).
Figure 2.

Protein-protein interaction network of DEGs. Red node represents upregulated DEGs; green node represents downregulated DEGs; the different shade of color represents the significance of the difference, with deeper color indicating a more significant difference. DEGs, differentially expressed genes.
Table III.
Top 20 genes with the highest connectivity degrees in the protein-protein interaction network.
| Gene name | Degree | Adjusted P-value | Log2FC |
|---|---|---|---|
| CD8A | 30 | 0.23 | −0.66 |
| PTPRC | 26 | 0.22 | −0.50 |
| FN1 | 14 | 0.24 | −0.56 |
| CCL19 | 13 | 0.26 | −0.76 |
| CCL5 | 12 | 0.24 | −0.78 |
| CCL21 | 11 | 0.20 | −0.60 |
| CXCR4 | 11 | 0.20 | −1.04 |
| CXCL9 | 10 | 0.32 | −0.86 |
| ADCY7 | 10 | 0.17 | −0.80 |
| CXCR6 | 10 | 0.25 | −0.52 |
| CD2 | 10 | 0.20 | −0.60 |
| CXCL6 | 9 | 0.20 | −1.07 |
| ITK | 8 | 0.23 | −0.53 |
| CD247 | 8 | 0.23 | −0.55 |
| PENK | 8 | 0.22 | −0.65 |
| H2AFV | 8 | 0.21 | −0.56 |
| POSTN | 7 | 0.21 | 1.81 |
| SERPING1 | 7 | 0.21 | −0.72 |
| KLRB1 | 7 | 0.23 | −0.74 |
| COL3A1 | 7 | 0.29 | −0.61 |
Degree, connectivity degree; FC, fold-change.
Module mining and functional analysis
Module analysis demonstrated that there were 9, 6 and 6 nodes in the 3 modules, respectively, and the DEGs involved in these modules were all downregulated (Fig. 3). Their MCODE scores were 9, 6 and 8, respectively.
Figure 3.
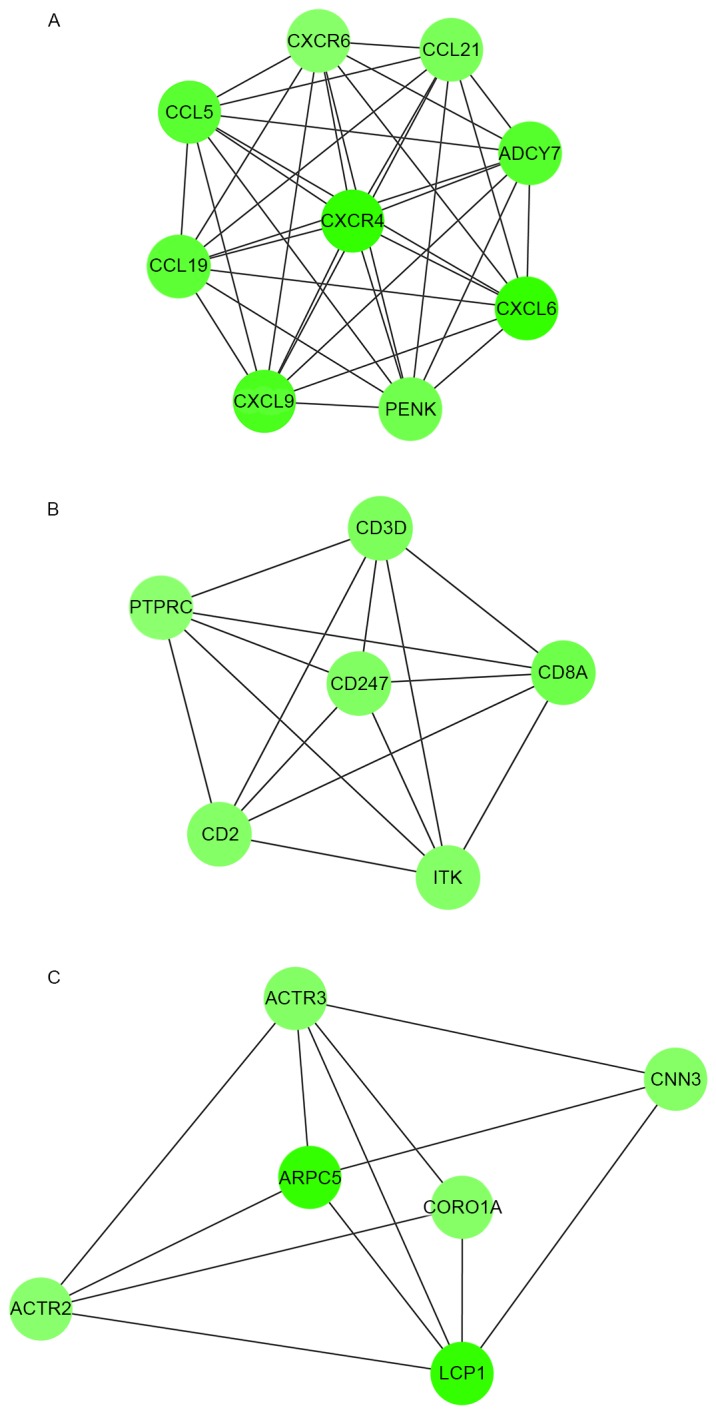
Modules in the protein-protein interaction network. There are (A) 9 nodes in module 1, (B) 6 nodes in module 2 and (C) 6 nodes in module 3.
As demonstrated in Table IV, DEGs in module 1 were linked with the G-protein coupled receptor protein signaling pathway, immune response and defense response. DEGs in module 2 were enriched in BPs related to T cell activation and differentiation, and lymphocyte activation and differentiation. DEGs in module 3 were enriched in actin cytoskeleton-related BPs.
Table IV.
GO and KEGG pathway functional enrichment of DEGs in modules.
| Category | Term | Description | Count | P-value | |
|---|---|---|---|---|---|
| Module 1 | |||||
| BP | GO: 0007186 | G-protein coupled receptor protein signaling pathway | 9 | 2.20E-09 | |
| BP | GO: 0006935 | Chemotaxis | 6 | 1.18E-08 | |
| BP | GO: 0042330 | Taxis | 6 | 1.18E-08 | |
| BP | GO: 0007610 | Behavior | 7 | 4.44E-08 | |
| BP | GO: 0007166 | Cell surface receptor linked signal transduction | 9 | 1.24E-07 | |
| BP | GO: 0007626 | Locomotory behavior | 6 | 1.75E-07 | |
| BP | GO: 0006952 | Defense response | 7 | 2.23E-07 | |
| BP | GO: 0006954 | Inflammatory response | 6 | 4.10E-07 | |
| BP | GO: 0009611 | Response to wounding | 6 | 4.60E-06 | |
| BP | GO: 0006955 | Immune response | 6 | 1.68E-05 | |
| KEGG | hsa04062 | Chemokine signaling pathway | 8 | 8.15E-11 | |
| KEGG | hsa04060 | Cytokine-cytokine receptor interaction | 7 | 1.19E-07 | |
| Module 2 | |||||
| BP | GO: 0042110 | T cell activation | 4 | 7.78E-06 | |
| BP | GO: 0046649 | Lymphocyte activation | 4 | 3.07E-05 | |
| BP | GO: 0045321 | Leukocyte activation | 4 | 5.51E-05 | |
| BP | GO: 0001775 | Cell activation | 4 | 9.16E-05 | |
| BP | GO: 0030217 | T cell differentiation | 3 | 2.25E-04 | |
| BP | GO: 0030098 | Lymphocyte differentiation | 3 | 5.66E-04 | |
| BP | GO: 0002521 | Leukocyte differentiation | 3 | 9.13E-04 | |
| BP | GO: 0007166 | Cell surface receptor linked signal transduction | 5 | 1.57E-03 | |
| BP | GO: 0045059 | Positive thymic T cell selection | 2 | 2.58E-03 | |
| BP | GO: 0030097 | Hemopoiesis | 3 | 2.93E-03 | |
| KEGG | hsa04660 | T cell receptor signaling pathway | 5 | 9.47E-07 | |
| KEGG | hsa05340 | Primary immunodeficiency | 3 | 4.54E-04 | |
| KEGG | hsa04640 | Hematopoietic cell lineage | 3 | 2.74E-03 | |
| KEGG | hsa04514 | Cell adhesion molecules | 3 | 6.35E-03 | |
| Module 3 | |||||
| BP | GO: 0030036 | Actin cytoskeleton organization | 4 | 4.49E-05 | |
| BP | GO: 0030029 | Actin filament-based process | 4 | 5.44E-05 | |
| BP | GO: 0030833 | Regulation of actin filament polymerization | 3 | 1.55E-04 | |
| BP | GO: 0008064 | Regulation of actin polymerization or depolymerization | 3 | 1.98E-04 | |
| BP | GO: 0030832 | Regulation of actin filament length | 3 | 2.12E-04 | |
| BP | GO: 0032271 | Regulation of protein polymerization | 3 | 2.47E-04 | |
| BP | GO: 0007010 | Cytoskeleton organization | 4 | 3.17E-04 | |
| BP | GO: 0006928 | Cell motion | 4 | 4.08E-04 | |
| BP | GO: 0032956 | Regulation of actin cytoskeleton organization | 3 | 4.23E-04 | |
| BP | GO: 0043254 | Regulation of protein complex assembly | 3 | 4.32E-04 |
GO, gene ontology; KEGG, Kyoto Encyclopedia of Genes and Genomes; DEGs, differentially expressed genes; BP, biological process; Description, the enriched GO function of DEGs; Count, number of DEGs.
Additionally, KEGG pathway analysis for DEGs (Table IV) in module 1 demonstrated that these DEGs predominantly participated in the pathways of chemokine signaling and cytokine-cytokine receptor interaction. DEGs in module 2 participated in T cell receptor signaling pathways, primary immunodeficiency, hematopoietic cell lineage and cell adhesion molecules. However, no pathway was observed to be enriched by the DEGs in module 3.
Data validation
Data validation demonstrated that the hub genes obtained in GSE15823, such as PTPRC, FN1 and CXCL9, were downregulated. The downregulation of these genes was also observed in GSE41649. Additionally, the expression of CCL21 (enriched in BPs associated with immune response) and NOS2 (enriched in BPs related to oxidation reduction and nitric oxide metabolism) demonstrated the same variation directions in the two datasets.
In addition, following functional enrichment analysis, the DEGs identified in GSE41649 were also demonstrated to be significantly enriched in pathways associated with immune responses (P<0.05), such as systemic lupus erythematosus, complement and coagulation cascades, cytokine-cytokine receptor interaction and chemokine signaling pathways. Furthermore, they were significantly enriched in BPs associated with immune responses and oxidoreductase activity (P<0.05; data not shown).
Discussion
In the present study, the GSE15823 gene expression profile was analyzed and the underlying molecular mechanisms of asthma were explored using bioinformatics methods. A total of 43 upregulated and 275 downregulated DEGs were identified in asthma samples compared with healthy subjects. Upregulated DEGs, such as NOS2, were enriched in BPs related to oxidation, reduction and nitric oxide metabolism. Downregulated DEGs, such as CCL21, CXCL9 and PTPRC, were enriched in immune response-associated BPs, and immune and inflammation-associated pathways. Additionally, 20 DEGs were considered as hub genes in the PPI network, such as PTPRC, CCL21 and CXCL9. The DEGs in module 1 were significantly involved in chemokine signaling pathways. Notably, the 4 DEGs (NOS2, PTPRC, CCL21 and CXCL9), pathways and BP terms were confirmed in GSE41649.
In asthmatic patients, impaired immune response to viral infections is a proposed mechanism for susceptibility to infection (25); however, the relationships between viral infections, innate immunity and asthma are complex and remain to be fully elucidated. In the present study, the majority of the downregulated DEGs were enriched in immune response-associated BPs and pathways, such as CCL21 and CXCL9. Additionally, PTPRC was enriched in BPs related to immune effector processes.
PTPRC was identified as a hub gene with the second highest degree in the PPI network. PTPRC encodes CD45 leukocyte common antigen, which is essential for normal lymphocyte function (26). A study by Trowbridge et al (27) suggested that CD45 has an important role in intracellular signal transduction in the immune system. As such, it has also been demonstrated that the absence of CD45 may result in severe combined immunodeficiency (28). CD45 may be expressed by all leucocytes, including eosinophils (29), which have been implicated as effector cells in asthma and other allergic diseases (30). In asthma, eosinophils and their secreted mediators are believed to be a major contributor to the inflammation underlying the pathophysiological changes in the airways (31). Therefore, we speculated that CD45 (PTPRC) may have an important role in the progression of asthma.
CCL21 and CXCL9 were also identified as hub genes in the PPI network. These genes were also involved in module 1, which was associated with the chemokine signaling pathway. Chemokines are significant regulators of immune cell trafficking, and malfunction of the chemokine signaling pathway has a key role in allergic asthma (32). In allergic asthma, mature dendritic cells migrate to lymph nodes through the interaction of chemokine (C-C motif) receptor 7 and CC chemokine ligands of CCL21, where they effectively present antigens to naive T cells (33). It has previously been demonstrated that the administration of antigen-pulsed dendritic cells induces allergic inflammation (34). CCL21 is understood to be crucial for lymphoid cell trafficking and for the structural organization of lymphoid tissues (35). A study by Xu et al (36) suggested that a lack of lymphoid chemokine ligand, CCL21, enhances allergic airway inflammation by modulating the recruitment of CD4+ T cells into the lungs. CXCL9 may be produced by eosinophils following stimulation with interferon-γ, indicating that CXCL9 may be involved in the downregulation of allergic inflammation (37,38). Taken together these findings suggest that CCL21 and CXCL9 may be involved in immune response-related BPs and have important roles in the progression of asthma.
In addition to immune responses, oxidants may also have a critical role in the pathogenesis of asthma (39). The lungs are highly susceptible to oxidative injury, which has been implicated in various lung diseases, including asthma (40). Increased levels of reactive oxygen species may induce apoptosis and result in increased airway reactivity and secretions, which may augment existing inflammation in asthma (41). In the present study, BPs related to oxidation reduction and nitric oxide metabolism were enriched by several upregulated DEGs, including NOS2. NOS2 is able to endogenously produce NO, which has been suggested to have an important role in the physiological regulation of airway functions (42,43). Notably, a previous study demonstrated that NOS2 was significantly associated with the fraction of exhaled NO in asthmatic children (44). Additionally, a study by Dweik (45) reported an increase in NOS2 expression during inflammation, which was in accordance with the results of the present study. Taken together these findings suggest that NOS2 may be a candidate molecular marker associated with asthma progression through oxidation reduction.
In the present study, there were 4 lung tissue samples obtained from bronchial biopsies of healthy controls and 4 from subjects with allergic asthma. All 4 of the asthmatic patients were women, whereas the 4 healthy subjects included 2 women and 2 men. Notably, Laprise et al (10) stated that gene expression measurements were similar in control subjects, which indicated that there was no gender difference in our data. Similarly, a study by Prescott et al (46) demonstrated that there was no gender difference in the prevalence of asthma.
The dataset of GSE41649 confirmed the key genes, pathways and GO functions identified in the present study; however, some limitations existed. In the process of data analysis, only 8 samples were used. Furthermore, the investigation was implemented by means of bioinformatics methods and the screened genes and pathways have not been validated by experiments, although the dataset of GSE41649 was used for verification.
In conclusion, the results of the present study demonstrate that the immune response, oxidants and nitric oxide metabolism may have important roles in the progression of asthma. Additionally, DEGs, such as PTPRC, CXCL9, CCL21 and NOS2, may have the potential to be used as targets for asthma diagnosis and treatment.
Acknowledgements
Not applicable.
Funding
No funding was received.
Availability of data and materials
The datasets used and/or analyzed during the current study are available from the corresponding author on reasonable request.
Authors' contributions
SQ, HC and GL conceived of and designed this study, and drafted the manuscript. NH acquired the data. XD analyzed and interpreted the data. WL performed the statistical analysis. HC revised the manuscript for important intellectual content and agreed to be accountable for all aspects of the work; ensuring that questions related to the accuracy or integrity of any part of the work are appropriately investigated and resolve. All authors have read and approved the manuscript, and ensure that the information is correct.
Ethics approval and consent to participate
Not applicable.
Consent for publication
Not applicable.
Competing interests
The authors declare that they have no competing interests.
References
- 1.Maddox L, Schwartz DA. The pathophysiology of asthma. Annu Rev Med. 2002;53:477–498. doi: 10.1146/annurev.med.53.082901.103921. [DOI] [PubMed] [Google Scholar]
- 2.Bateman ED, Hurd SS, Barnes PJ, Bousquet J, Drazen JM, FitzGerald JM, Gibson P, Ohta K, O'Byrne P, Pedersen SE, et al. Global strategy for asthma management and prevention: GINA executive summary. Eur Respir J. 2008;31:143–178. doi: 10.1183/09031936.00138707. [DOI] [PubMed] [Google Scholar]
- 3.Koehoorn M, Tamburic L, McLeod CB, Demers P, Lynd L, Kennedy SM. Population-based surveillance of asthma among workers in British Columbia, Canada. Chronic Dis Inj Can. 2013;33:88–94. [PubMed] [Google Scholar]
- 4.Lai C, Beasley R, Crane J, Foliaki S, Shah J, Weiland S. International Study of Asthma and Allergies in Childhood Phase Three Study Group: Global variation in the prevalence and severity of asthma symptoms: Phase three of the international study of asthma and allergies in childhood (ISAAC) Thorax. 2009;64:476–483. doi: 10.1136/thx.2008.106609. [DOI] [PubMed] [Google Scholar]
- 5.Leutholtz BC, Ripoll I. Exercise and disease management. 2nd edition. CRC Press; Boca Raton, FL: 2011. [Google Scholar]
- 6.Reponen T, Lockey J, Bernstein DI, Vesper SJ, Levin L, Hershey Khurana GK, Zheng S, Ryan P, Grinshpun SA, Villareal M, Lemasters G. Infant origins of childhood asthma associated with specific molds. J Allergy Clin Immunol. 2012;130:639–644.e5. doi: 10.1016/j.jaci.2012.05.030. [DOI] [PMC free article] [PubMed] [Google Scholar]
- 7.Torgerson DG, Ampleford EJ, Chiu GY, Gauderman WJ, Gignoux CR, Graves PE, Himes BE, Levin AM, Mathias RA, Hancock DB, et al. Meta-analysis of genome-wide association studies of asthma in ethnically diverse North American populations. Nat Genet. 2011;43:887–892. doi: 10.1038/ng.888. [DOI] [PMC free article] [PubMed] [Google Scholar]
- 8.Ober C, Hoffjan S. Asthma genetics 2006: The long and winding road to gene discovery. Genes Immun. 2006;7:95–100. doi: 10.1038/sj.gene.6364284. [DOI] [PubMed] [Google Scholar]
- 9.Wang G, Liu CT, Wang ZL, Jiang LL, Yan CL, Luo FM. Antisense oligonucleotides-induced local blockade of T-bet expression leads to airway inflammation in rats1. Acta Pharmacol Sin. 2006;27:561–567. doi: 10.1111/j.1745-7254.2006.00323.x. [DOI] [PubMed] [Google Scholar]
- 10.Laprise C, Sladek R, Ponton A, Bernier MC, Hudson TJ, Laviolette M. Functional classes of bronchial mucosa genes that are differentially expressed in asthma. BMC genomics. 2004;5:21. doi: 10.1186/1471-2164-5-21. [DOI] [PMC free article] [PubMed] [Google Scholar]
- 11.Moore JH, Asselbergs FW, Williams SM. Bioinformatics challenges for genome-wide association studies. Bioinformatics. 2010;26:445–455. doi: 10.1093/bioinformatics/btp713. [DOI] [PMC free article] [PubMed] [Google Scholar]
- 12.Vaillancourt VT, Bordeleau M, Laviolette M, Laprise C. From expression pattern to genetic association in asthma and asthma-related phenotypes. BMC Res Notes. 2012;5:630. doi: 10.1186/1756-0500-5-630. [DOI] [PMC free article] [PubMed] [Google Scholar]
- 13.Chamberland A, Madore AM, Tremblay K, Laviolette M, Laprise C. A comparison of two sets of microarray experiments to define allergic asthma expression pattern. Exp Lung Res. 2009;35:399–410. doi: 10.1080/01902140902745174. [DOI] [PubMed] [Google Scholar]
- 14.Standards for the diagnosis and care of patients with chronic obstructive pulmonary disease (COPD) and asthma. This official statement of the American Thoracic Society was adopted by the ATS Board of Directors, November 1986. Am Rev Respir Dis. 1987;136:225–244. doi: 10.1164/ajrccm/136.1.225. [DOI] [PubMed] [Google Scholar]
- 15.Irizarry RA, Hobbs B, Collin F, Beazer-Barclay YD, Antonellis KJ, Scherf U, Speed TP. Exploration, normalization, and summaries of high density oligonucleotide array probe level data. Biostatistics. 2003;4:249–264. doi: 10.1093/biostatistics/4.2.249. [DOI] [PubMed] [Google Scholar]
- 16.Gautier L, Cope L, Bolstad BM, Irizarry RA. affy-analysis of Affymetrix GeneChip data at the probe level. Bioinformatics. 2004;20:307–315. doi: 10.1093/bioinformatics/btg405. [DOI] [PubMed] [Google Scholar]
- 17.Dubitzky W, Wolkenhauer O, Yokota H, Cho KH, editors. Encyclopedia of Systems Biology. Springer; New York, NY: 2013. Student'st-Test; pp. 2023–2025. [DOI] [Google Scholar]
- 18.da Huang W, Sherman BT, Lempicki RA. Systematic and integrative analysis of large gene lists using DAVID bioinformatics resources. Nat Protoc. 2009;4:44–57. doi: 10.1038/nprot.2008.211. [DOI] [PubMed] [Google Scholar]
- 19.Ashburner M, Ball CA, Blake JA, Botstein D, Butler H, Cherry JM, Davis AP, Dolinski K, Dwight SS, Eppig JT, et al. Gene ontology: Tool for the unification of biology. The Gene Ontology Consortium. Nat Genet. 2000;25:25–29. doi: 10.1038/75556. [DOI] [PMC free article] [PubMed] [Google Scholar]
- 20.Kanehisa M, Goto S. KEGG: Kyoto encyclopedia of genes and genomes. Nucleic Acids Res. 2000;28:27–30. doi: 10.1093/nar/28.1.27. [DOI] [PMC free article] [PubMed] [Google Scholar]
- 21.Franceschini A, Szklarczyk D, Frankild S, Kuhn M, Simonovic M, Roth A, Lin J, Minguez P, Bork P, von Mering C, Jensen LJ. STRING v9.1: Protein-protein interaction networks, with increased coverage and integration. Nucleic Acids Res. 2013;41:D808–D815. doi: 10.1093/nar/gks1094. (Database Issue) [DOI] [PMC free article] [PubMed] [Google Scholar]
- 22.Shannon P, Markiel A, Ozier O, Baliga NS, Wang JT, Ramage D, Amin N, Schwikowski B, Ideker T. Cytoscape: A software environment for integrated models of biomolecular interaction networks. Genome Res. 2003;13:2498–2504. doi: 10.1101/gr.1239303. [DOI] [PMC free article] [PubMed] [Google Scholar]
- 23.Stuart JM, Segal E, Koller D, Kim SK. A gene-coexpression network for global discovery of conserved genetic modules. science. 2003;302:249–255. doi: 10.1126/science.1087447. [DOI] [PubMed] [Google Scholar]
- 24.Bader GD, Hogue CW. An automated method for finding molecular complexes in large protein interaction networks. BMC Bioinformatics. 2003;4:2. doi: 10.1186/1471-2105-4-2. [DOI] [PMC free article] [PubMed] [Google Scholar]
- 25.Wark PA, Johnston SL, Bucchieri F, Powell R, Puddicombe S, Laza-Stanca V, Holgate ST, Davies DE. Asthmatic bronchial epithelial cells have a deficient innate immune response to infection with rhinovirus. J Exp Med. 2005;201:937–947. doi: 10.1084/jem.20041901. [DOI] [PMC free article] [PubMed] [Google Scholar]
- 26.Differentiation CO. Protein tyrosine phosphatase receptor type C. Springer; New York, NY: 2012. [Google Scholar]
- 27.Trowbridge IS, Ostergaard HL, Johnson P. CD45: A leukocyte-specific member of the protein tyrosine phosphatase family. Biochim Biophys Acta. 1991;1095:46–56. doi: 10.1016/0167-4889(91)90043-W. [DOI] [PubMed] [Google Scholar]
- 28.Hermiston ML, Xu Z, Weiss A. CD45: A critical regulator of signaling thresholds in immune cells. Annu Rev Immunol. 2003;21:107–137. doi: 10.1146/annurev.immunol.21.120601.140946. [DOI] [PubMed] [Google Scholar]
- 29.Matsumoto K, Bochner BS, Wakiguchi H, Kurashige T. Altered expression of CD11b and CD62L after cross-linking of CD45 isoforms on human eosinophils. Int Arch Allergy Immunol. 1998;117(Suppl 1):S34–S39. doi: 10.1159/000053568. [DOI] [PubMed] [Google Scholar]
- 30.Blaylock MG, Lipworth BJ, Dempsey OJ, Duncan CJ, Lee DK, Lawrie A, Douglas JG, Walsh GM. Eosinophils from patients with asthma express higher levels of the pan-leucocyte receptor CD45 and the isoform CD45RO. Clin Exp Allergy. 2003;33:936–941. doi: 10.1046/j.1365-2222.2003.01697.x. [DOI] [PubMed] [Google Scholar]
- 31.Walsh GM. Advances in the immunobiology of eosinophils and their role in disease. Crit Rev Clin Lab Sci. 1999;36:453–496. doi: 10.1080/10408369991239277. [DOI] [PubMed] [Google Scholar]
- 32.Nguyen KD, Vanichsarn C, Fohner A, Nadeau KC. Selective deregulation in chemokine signaling pathways of CD4+CD25(hi)CD127(lo)/(−) regulatory T cells in human allergic asthma. J Allergy Clin Immunol. 2009;123:933–939.e10. doi: 10.1016/j.jaci.2008.11.037. [DOI] [PMC free article] [PubMed] [Google Scholar]
- 33.Yamashita N, Tashimo H, Matsuo Y, Ishida H, Yoshiura K, Sato K, Yamashita N, Kakiuchi T, Ohta K. Role of CCL21 and CCL19 in allergic inflammation in the ovalbumin-specific murine asthmatic model. J Allergy Clin Immunol. 2006;117:1040–1046. doi: 10.1016/j.jaci.2006.01.009. [DOI] [PubMed] [Google Scholar]
- 34.Lambrecht BN, Peleman RA, Bullock GR, Pauwels RA. Sensitization to inhaled antigen by intratracheal instillation of dendritic cells. Clin Exp Allergy. 2000;30:214–224. doi: 10.1046/j.1365-2222.2000.00818.x. [DOI] [PubMed] [Google Scholar]
- 35.Takamura K, Fukuyama S, Nagatake T, Kim DY, Kawamura A, Kawauchi H, Kiyono H. Regulatory role of lymphoid chemokine CCL19 and CCL21 in the control of allergic rhinitis. J Immunol. 2007;179:5897–5906. doi: 10.4049/jimmunol.179.9.5897. [DOI] [PubMed] [Google Scholar]
- 36.Xu B, Aoyama K, Kusumoto M, Matsuzawa A, Butcher EC, Michie SA, Matsuyama T, Takeuchi T. Lack of lymphoid chemokines CCL19 and CCL21 enhances allergic airway inflammation in mice. Int Immunol. 2007;19:775–784. doi: 10.1093/intimm/dxm046. [DOI] [PubMed] [Google Scholar]
- 37.Meller S, Lauerma AI, Kopp FM, Winterberg F, Anthoni M, Müller A, Gombert M, Haahtela A, Alenius H, Rieker J, et al. Chemokine responses distinguish chemical-induced allergic from irritant skin inflammation: Memory T cells make the difference. J Allergy Immuno. 2007;119:1470–1480. doi: 10.1016/j.jaci.2006.12.654. [DOI] [PubMed] [Google Scholar]
- 38.Tworek D, Kuna P, Młynarski W, Górski P, Pietras T, Antczak A. MIG (CXCL9), IP-10 (CXCL10) and I-TAC (CXCL11) concentrations after nasal allergen challenge in patients with allergic rhinitis. Arch Med Sci. 2013;9:849–853. doi: 10.5114/aoms.2013.37198. [DOI] [PMC free article] [PubMed] [Google Scholar]
- 39.Sackesen C, Ercan H, Dizdar E, Soyer O, Gumus P, Tosun BN, Büyüktuncer Z, Karabulut E, Besler T, Kalayci O. A comprehensive evaluation of the enzymatic and nonenzymatic antioxidant systems in childhood asthma. J Allergy Clin Immunol. 2008;122:78–85. doi: 10.1016/j.jaci.2008.03.035. [DOI] [PubMed] [Google Scholar]
- 40.Andreadis AA, Hazen SL, Comhair SA, Erzurum SC. Oxidative and nitrosative events in asthma. Free Radic Biol Med. 2003;35:213–225. doi: 10.1016/S0891-5849(03)00278-8. [DOI] [PubMed] [Google Scholar]
- 41.Nadeem A, Raj HG, Chhabra SK. Increased oxidative stress and altered levels of antioxidants in chronic obstructive pulmonary disease. Inflammation. 2005;29:23–32. doi: 10.1007/s10753-006-8965-3. [DOI] [PubMed] [Google Scholar]
- 42.Ghosh S, Erzurum SC. Nitric oxide metabolism in asthma pathophysiology. Biochim Biophys Acta. 2011;1810:1008–1016. doi: 10.1016/j.bbagen.2011.06.009. [DOI] [PMC free article] [PubMed] [Google Scholar]
- 43.Alderton WK, Cooper CE, Knowles RG. Nitric oxide synthases: Structure, function and inhibition. Biochem J. 2001;357:593–615. doi: 10.1042/0264-6021:3570593. [DOI] [PMC free article] [PubMed] [Google Scholar]
- 44.Salam MT, Bastain TM, Rappaport EB, Islam T, Berhane K, Gauderman WJ, Gilliland FD. Genetic variations in nitric oxide synthase and arginase influence exhaled nitric oxide levels in children. Allergy. 2011;66:412–419. doi: 10.1111/j.1398-9995.2010.02492.x. [DOI] [PMC free article] [PubMed] [Google Scholar]
- 45.Dweik RA. Nitric oxide, hypoxia, and superoxide: The good, the bad, and the ugly! Thorax. 2005;60:265–267. doi: 10.1136/thx.2004.038471. [DOI] [PMC free article] [PubMed] [Google Scholar]
- 46.Prescott E, Lange P, Vestbo J. Effect of gender on hospital admissions for asthma and prevalence of self-reported asthma: A prospective study based on a sample of the general population. Copenhagen City Heart Study Group. Thorax. 1997;52:287–289. doi: 10.1136/thx.52.3.287. [DOI] [PMC free article] [PubMed] [Google Scholar]
Associated Data
This section collects any data citations, data availability statements, or supplementary materials included in this article.
Data Availability Statement
The datasets used and/or analyzed during the current study are available from the corresponding author on reasonable request.