

Abstract
It has been widely reported that the serum anion gap is significantly associated with mortality in intensive care unit (ICU); however, it remains unknown whether the association is present in aortic aneurysm (AA) patients. The present study aimed to investigate the association between the admission serum anion gap and ICU mortality in AA patients. Data extracted from a publicly accessible clinical database using a modifiable data mining technique were analyzed retrospectively, mainly by employing multivariable logistic regression analysis. The primary study outcome was ICU mortality. A total of 273 patient records were analyzed. The ICU mortality was 8.79% (24/273). The median serum anion gap was significantly higher in non-survivors [17.50 mEq/l, interquartile range (IQR) 15.75–22.50 mEq/l] compared with survivors [13.00 mEq/l, IQR 11.00–15.00 mEq/l, P<0.001]. Multivariate analysis resulted in identification of a clear association between admission serum anion gap and ICU mortality in AA patients [odds ratio (OR) 1.38 per 1 mEq/l increase, 95% confidence interval (CI) 1.08–1.76]. The area under the receiver operating characteristic curve showed an outstanding discrimination ability in predicting ICU mortality (area under curve 0.8513, 95% CI 0.7698–0.9328). In conclusion, admission serum anion gap may serve as a strong predictor of ICU mortality for AA patients.
Keywords: acid-base equilibrium, intensive care units, aortic aneurysm, mortality, prognosis
Introduction
Aortic aneurysm (AA), defined as an enlargement of the aorta to greater than 1.5 times normal size (1) is usually asymptotic, but when rupture occurs, this may lead to internal bleeding, shock and mortality, unless treated immediately (2). Although AA is rather rare with an incidence of approximately 10 per 100,000 for thoracic aortic aneurysm (ΤΑΑ) (3) and 55–298 per 100,000 for abdominal aortic aneurysm (AAA) (4), the burden of the disease is heavy and may be underestimated (5–7). Given the high total mortality estimated at 80–100% for ruptured AA (8,9), the best way to reduce the overall mortality of the disease may be to detect and treat it prior to rupture. In fact, many predictors or predictive models of mortality risk in AA patients have been reported (10–14), but further validation is required. Herein, we focused on AA patients in intensive care unit (ICU) and investigated the predictive value of serum anion gap on ICU mortality, a routine clinical indicator which has been reported to be associated with mortality of several diseases (15–18). Although a few studies have reported the association between anion gap with ICU mortality (19,20), to the best of our knowledge, no research to date has specially investigated the association in AA patients admitted to ICU. Considering the extremely low incidence of AA, we performed a retrospective analysis on a large publicly accessible clinical database, hoping to clarify the association between anion gap and ICU mortality.
Patients and methods
Database introduction
The retrospective analysis was conducted using data from the Medical Information Mart for Intensive Care III (MIMIC-III) database (version 1.4) (21), a large and freely-available database comprising deidentified health-related data of patients admitted to ICU of the Beth Israel Deaconess Medical Center between 2001 and 2012. The database contains information including demographics, laboratory test results, and clinical outcomes. The access of the database was approved by the institutional review boards of both Beth Israel Deaconess Medical Center and Massachusetts Institute of Technology Affiliates.
Study design
Adult patients (age ≥18 years old) with first hospital admission and first ICU admission were considered for inclusion. AA patients were selected according to their primary diagnoses based on ICD-9 codes (4412–4415, and 4419), and patients with a length of ICU stay less than 24 h or a missing value of admission serum anion gap were excluded.
We used the codes from the MIMIC Code Repository (https://github.com/MIT-LCP/mimic-code) (22) to extract data from the database. Variables were extracted or calculated including admission serum anion gap (item ID=50868 in the database, detected within 24 h after ICU admission), severity scores including SOFA (23) and APACHE III (24), sepsis defined by ICD-9 codes (99592 and 78552), sepsis defined by Angus criteria (25) and comorbidities (26) based on ICD-9 codes. For patients >89 years old, date of birth had been shifted to exactly 300 years before by the database to obscure age, therefore this was corrected (age-300+89) prior to analysis. No informed consent was required as the data were anonymized.
Outcomes
ICU mortality was chosen as the primary study outcome before analysis. Hospital mortality, length of ICU stay, and length of hospital stay were also calculated. Although only patients of first hospital admission were included, it is possible for a patient to be transferred from one type of ICU to another. In this case, the primary outcome ICU mortality and length of ICU stay were determined only by the first ICU stay. Apart from statistical description, only the primary outcome was analyzed further.
Statistical analysis
Data are presented as median and interquartile range (IQR) for continuous variables and numbers and percentages for categorical variables. Kruskal Wallis and Chi-square (or Fisher's exact) tests were used to analyze continuous and categorical variables, respectively. Relationship between admission serum anion gap and ICU mortality was explored using the smoothing plot with an adjustment for potential confounders (age, sex, and SOFA were selected before analysis). A two-piecewise linear regression model was applied to examine the threshold effect of admission serum anion gap on ICU mortality according to the smoothing plot. Factors associated with ICU mortality were evaluated by univariate logistic analysis and variables that showed statistically significant association with ICU mortality in the univariate analysis (P<0.05) were included in the multivariable logistic regression model, but variables with missing values >10% were excluded. Considering that there was a certain overlap in the two severity scores and sepsis based on different criteria, we only selected SOFA and sepsis based on ICD-9 codes to be enrolled in the multivariable analysis if the variables were statistically significant in the univariate analysis. If a nonlinear relationship and a threshold effect were found in the previous analysis, then the subjects were stratified according to the threshold level and the logistic analysis was repeated. Receiver operating characteristic (ROC) curves were constructed and the area under the ROC curve (AUC) was calculated to evaluate the predictions. Consistency of the results in several subgroups was also explored using logistic regression models. To maximize statistical power and minimize potential bias that may have occurred if variables with missing values >10% were excluded from analyses, missing values of continuous and categorical covariates in outcome analysis were handled using multiple imputation with 5 imputed data sets, and results were pooled according to Rubin's rules (27). A multivariable analysis was also performed after excluding patients with ruptured AA. A P-value of <0.05 was considered statistically significant. Empower(R) (www.empowerstats.com; X&Y solutions, Inc., Boston, MA, USA) and R software, version 3.4.3 (http://www.r-project.org) were used for all statistical analyses.
Results
Population and baseline characteristics
A total of 273 patients were included and analyzed (Fig. 1). The number of missing values for all variables are presented in Table I. As shown in Table II, The median age of the study subjects was 73.16 years (IQR 65.14–80.06 years) and 154 of the 273 cases (56.41%) were male. The median admission serum anion gap was 13.00 mEq/l (IQR 11.00–15.00 mEq/l) with a median SOFA score of 5 (IQR 4–8). Among them, 8 (2.93%) patients were diagnosed as sepsis based on ICD-9 codes and 227 (83.15%) patients required ventilation. The five most common comorbidities were chronic pulmonary disease (28.94%), fluid and electrolyte disorders (27.84%), peripheral vascular disorder (26.01%), coagulopathy (17.22%), and uncomplicated diabetes (15.02%).
Figure 1.

Flow chart of the study population. ICU, intensive care unit; ICD-9, International Classification of Diseases, 9th Revision.
Table I.
Numbers of subjects with missing values.
| Variables | Numbers of subjects with specific missing value |
|---|---|
| Hemoglobin | 1 |
| Lactate | 61 |
| Platelet | 1 |
| PTT | 11 |
| INR | 12 |
| PT | 12 |
| WBC | 2 |
| Urine output in first day | 4 |
| Heartrate | 2 |
| Systolic pressure | 3 |
| Diastolic pressure | 3 |
| Respiratory rate | 2 |
| Temperature | 23 |
| SpO2 | 2 |
PTT, partial thromboplastin time; INR, international normalised ratio; PT, prothrombin time; WBC, white blood cell.
Table II.
Clinical characteristics of study subjects.
| Parameter | All (n=273) | Survivors (n=249) | Non-survivors (n=24) | P-value |
|---|---|---|---|---|
| Age (years) | 73.16 (65.14–80.06) | 72.58 (64.59–79.76) | 77.74 (72.11–82.80) | 0.009 |
| Sex (male), n (%) | 154 (56.41%) | 143 (57.43%) | 11 (45.83%) | 0.274 |
| Type of aortic aneurysm | 0.002 | |||
| Thoracic aneurysm without mention of rupture | 109 (39.93%) | 104 (41.77%) | 5 (20.83%) | |
| Abdominal aneurysm (ruptured) | 48 (17.58%) | 37 (14.86%) | 11 (45.83%) | |
| Abdominal aneurysm without mention of rupture | 116 (42.49%) | 108 (43.37%) | 8 (33.33%) | |
| Anion gap (mEq/l) | 13.00 (11.00–15.00) | 13.00 (11.00–15.00) | 17.50 (15.75–22.50) | <0.001 |
| ICU mortality | 24 (8.79%) | |||
| Hospital mortality | 27 (9.89%) | 3 (1.20%) | 24 (100.00%) | <0.001 |
| ICU length of stay (days) | 3.23 (1.90–9.22) | 3.16 (1.81–8.99) | 10.88 (2.58–15.06) | 0.008 |
| Hospital length of stay (days) | 9.32 (6.25–16.92) | 9.30 (6.39–17.04) | 10.84 (4.62–16.38) | 0.317 |
| Severity score | ||||
| SOFA | 5.00 (4.00–8.00) | 5.00 (3.00–7.00) | 9.00 (8.00–11.25) | <0.001 |
| APACHE III | 39.00 (29.00–54.00) | 38.00 (28.00–50.00) | 70.00 (52.00–85.75) | <0.001 |
| Vital signs | ||||
| Heartrate (bpm) | 80.60 (73.07–88.98) | 79.86 (72.69–87.77) | 88.60 (83.54–95.75) | 0.002 |
| Systolic pressure (mmHg) | 113.98 (106.58–124.29) | 114.80 (106.79–124.01) | 109.67 (104.60–124.98) | 0.273 |
| Diastolic pressure (mmHg) | 57.68 (52.97–62.38) | 57.32 (52.60–61.97) | 59.78 (57.10–65.19) | 0.036 |
| Respiratory rate (bpm) | 17.26 (14.96–19.27) | 17.02 (14.94–19.21) | 18.69 (16.13–21.00) | 0.040 |
| Temperature (°C) | 37.64 (37.10–38.10) | 37.67 (37.18–38.10) | 37.25 (36.72–37.82) | 0.041 |
| SpO2 (%) | 93.00 (91.00–95.00) | 93.00 (91.00–95.00) | 92.00 (86.75–94.00) | 0.023 |
| Urine output in first day (ml) | 1,670.00 (981.00–2,580.00) | 1,730.00 (1,071.50–2,602.50) | 450.00 (246.25–1,342.00) | <0.001 |
| RTT in first day | 5 (1.83%) | 2 (0.80%) | 3 (12.50%) | 0.005 |
| Ventilation in first day | 227 (83.15%) | 205 (82.33%) | 22 (91.67%) | 0.390 |
| Sepsis (based on ICD-9 codes) | 8 (2.93%) | 4 (1.61%) | 4 (16.67%) | 0.003 |
| Sepsis (based on Angus criteria) | 78 (28.57%) | 63 (25.30%) | 15 (62.50%) | <0.001 |
| Lab examination | ||||
| WBC (K/ul) | 12.50 (9.70–15.80) | 12.10 (9.60–15.65) | 14.75 (12.90–16.92) | 0.025 |
| Platelet (K/ul) | 147.50 (111.88–190.12) | 151.00 (112.38–192.75) | 132.00 (106.00–149.88) | 0.027 |
| Hemoglobin (g/dl) | 9.00 (7.80–10.30) | 9.25 (7.90–10.33) | 8.20 (6.97–8.80) | 0.002 |
| Creatinine (mg/dl) | 1.10 (0.80–1.60) | 1.00 (0.80–1.50) | 1.95 (1.45–2.20) | <0.001 |
| BUN (mg/dl) | 19.00 (15.00–26.00) | 18.00 (15.00–25.00) | 27.50 (21.75–35.75) | <0.001 |
| Glucose (mg/dl) | 172.00 (140.00–204.00) | 171.00 (138.00–200.00) | 215.00 (155.75–316.25) | 0.005 |
| Lactate (mmol/l) | 3.15 (1.98–5.30) | 2.80 (1.90–4.60) | 7.00 (5.20–10.80) | <0.001 |
| PTT (sec) | 35.57 (30.54–42.75) | 34.80 (30.16–42.21) | 42.72 (36.30–65.26) | 0.002 |
| INR | 1.30 (1.20–1.50) | 1.30 (1.16–1.45) | 1.45 (1.20–1.77) | 0.064 |
| PT (sec) | 14.45 (13.40–15.85) | 14.40 (13.35–15.64) | 15.85 (13.45–17.35) | 0.082 |
| Comorbidities | ||||
| Congestive heart failure | 11 (4.03%) | 10 (4.02%) | 1 (4.17%) | 1.000 |
| Cardiac arrhythmias | 12 (4.40%) | 11 (4.42%) | 1 (4.17%) | 1.000 |
| Valvular disease | 3 (1.10%) | 2 (0.80%) | 1 (4.17%) | 0.242 |
| Pulmonary circulation disorder | 2 (0.73%) | 2 (0.80%) | 0 (0.00%) | 1.000 |
| Peripheral vascular disorder | 71 (26.01%) | 64 (25.70%) | 7 (29.17%) | 0.808 |
| Hypertension | 23 (8.42%) | 19 (7.63%) | 4 (16.67%) | 0.130 |
| Paralysis | 7 (2.56%) | 6 (2.41%) | 1 (4.17%) | 0.479 |
| Other neurological disease | 4 (1.47%) | 2 (0.80%) | 2 (8.33%) | 0.040 |
| Chronic pulmonary disease | 79 (28.94%) | 72 (28.92%) | 7 (29.17%) | 1.000 |
| Uncomplicated diabetes | 41 (15.02%) | 39 (15.66%) | 2 (8.33%) | 0.549 |
| Complicated diabetes | 4 (1.47%) | 4 (1.61%) | 0 (0.00%) | 1.000 |
| Hypothyroidism | 26 (9.52%) | 23 (9.24%) | 3 (12.50%) | 0.487 |
| Renal failure | 31 (11.36%) | 26 (10.44%) | 5 (20.83%) | 0.167 |
| Liver disease | 8 (2.93%) | 6 (2.41%) | 2 (8.33%) | 0.150 |
| Lymphoma | 3 (1.10%) | 3 (1.20%) | 0 (0.00%) | 1.000 |
| Metastatic cancer | 2 (0.73%) | 2 (0.80%) | 0 (0.00%) | 1.000 |
| Solid tumor | 4 (1.47%) | 4 (1.61%) | 0 (0.00%) | 1.000 |
| Rheumatoid arthritis | 8 (2.93%) | 7 (2.81%) | 1 (4.17%) | 0.526 |
| Coagulopathy | 47 (17.22%) | 39 (15.66%) | 8 (33.33%) | 0.043 |
| Obesity | 21 (7.69%) | 21 (8.43%) | 0 (0.00%) | 0.233 |
| Weight loss | 7 (2.56%) | 7 (2.81%) | 0 (0.00%) | 1.000 |
| Fluid and electrolyte disorders | 76 (27.84%) | 67 (26.91%) | 9 (37.50%) | 0.339 |
| Blood loss anemia | 5 (1.83%) | 4 (1.61%) | 1 (4.17%) | 0.371 |
| Deficiency anemias | 35 (12.82%) | 34 (13.65%) | 1 (4.17%) | 0.333 |
| Alcohol abuse | 8 (2.93%) | 8 (3.21%) | 0 (0.00%) | 1.000 |
| Psychoses | 4 (1.47%) | 3 (1.20%) | 1 (4.17%) | 0.309 |
| Depression | 12 (4.40%) | 12 (4.82%) | 0 (0.00%) | 0.608 |
Data are expressed as median (interquartile range) or n (%). Kruskal Wallis and Chi-square (or Fisher's exact) tests were used to compare continuous and categorical variables of the two groups, respectively. Statistical significance (P<0.05) is shown in bold. ICU, intensive care unit; SOFA, Sepsis-related Organ Failure Assessment; APACHE III, Acute Physiology and Chronic Health Evaluation III; RTT, renal replacement therapy; ICD-9, International Classification of Diseases, 9th Revision; WBC, white blood cell; BUN, blood urea nitrogen; PTT, partial thromboplastin time; INR, international normalised ratio; PT, prothrombin time.
Survival status of the population
The ICU mortality was 8.79% with 24 non-survivors and 249 survivors and the hospital mortality was 9.89% (27/273). The median length of ICU stay and hospital stay was 3.23 (IQR 1.90–9.22) and 9.32 (IQR 6.25–16.92) days, respectively. As shown in Table II, non-survivors had significantly higher SOFA and APACHE (P<0.001). Furthermore, they were more likely to suffer from sepsis and require renal replacement therapy in first day. A significantly lower admission serum anion gap was observed in survivors (P<0.001).
Association between serum anion gap on admission and ICU mortality
Further analysis indicated that admission serum anion gap increased with increased ICU mortality when patients were stratified according to serum anion gap levels on admission (Table III), but no significant nonlinear relationship or threshold effect between them were observed (Fig. 2 and Table IV). After adjustment for potential confounders according to the univariate analysis (presented in Table V), admission serum anion gap was found to be significantly associated with ICU mortality [odds ratio (OR) 1.38 per 1 mEq/l increase, 95% confidence interval (CI), 1.08–1.76; P=0.0088] (Table VI). As shown in Fig. 3, AUC of serum anion gap for discrimination of survivors and non-survivors was 0.8513 (95% CI, 0.7698–0.9328), which suggested its potentially efficient predictive role in ICU mortality for AA patients.
Table III.
Clinical characteristics of study subjects stratified by anion gap levels on ICU admission.
| Parameter | Tertile 1 (n=81) | Tertile 2 (n=61) | Tertile 3 (n=131) | P-value |
|---|---|---|---|---|
| Age (years) | 69.77 (60.37–79.58) | 69.67 (63.65–78.14) | 76.14 (70.24–82.05) | <0.001 |
| Sex (male), n(%) | 39 (48.15%) | 35 (57.38%) | 80 (61.07%) | 0.180 |
| Type of aortic aneurysm | <0.001 | |||
| Thoracic aneurysm without mention of rupture | 45 (55.56%) | 31 (50.82%) | 33 (25.19%) | |
| Abdominal aneurysm (ruptured) | 5 (6.17%) | 7 (11.48%) | 36 (27.48%) | |
| Abdominal aneurysm without mention of rupture | 31 (38.27%) | 23 (37.70%) | 62 (47.33%) | |
| Anion Gap (mEq/l) | 10.00 (9.00–11.00) | 13.00 (12.00–13.00) | 16.00 (14.00–17.50) | <0.001 |
| ICU mortality | 1 (1.23%) | 2 (3.28%) | 21 (16.03%) | <0.001 |
| Hospital mortality | 2 (2.47%) | 3 (4.92%) | 22 (16.79%) | <0.001 |
| ICU length of stay (days) | 2.27 (1.33–4.10) | 3.11 (1.44–8.55) | 5.75 (2.20–12.60) | <0.001 |
| Hospital length of stay (days) | 7.84 (5.46–12.28) | 9.27 (6.26–14.63) | 12.22 (6.54–20.45) | 0.002 |
| Severity score | ||||
| SOFA | 5.00 (3.00–6.00) | 4.00 (3.00–7.00) | 6.00 (4.50–9.00) | <0.001 |
| APACHE III | 33.00 (24.00–44.00) | 36.00 (27.00–46.00) | 49.00 (36.00–64.00) | <0.001 |
| Vital signs | ||||
| Heartrate (bpm) | 79.79 (72.67–86.79) | 79.86 (73.07–87.19) | 81.90 (73.75–91.75) | 0.438 |
| Systolic pressure (mmHg) | 109.73 (105.03–118.55) | 117.89 (108.29–124.83) | 117.79 (107.62–128.83) | 0.002 |
| Diastolic pressure (mmHg) | 56.74 (52.82–61.74) | 57.59 (53.28–62.43) | 58.61 (53.25–63.48) | 0.508 |
| Respiratory rate (bpm) | 16.36 (14.63–18.54) | 17.31 (15.22–18.58) | 18.08 (15.21–19.91) | 0.029 |
| Temperature (°C) | 37.82 (37.40–38.18) | 37.60 (37.03–38.00) | 37.60 (37.03–38.06) | 0.115 |
| SpO2 (%) | 93.00 (91.00–95.00) | 93.00 (91.00–95.00) | 93.00 (91.00–95.00) | 0.357 |
| Urine output in first day (ml) | 2,200.00 (1,605.00–2,730.00) | 1,670.00 (1,087.00–2,515.00) | 1,172.00 (650.00–2,229.50) | <0.001 |
| RTT in first day | 0 (0.00%) | 0 (0.00%) | 5 (3.82%) | 0.085 |
| Ventilation in first day | 71 (87.65%) | 53 (86.89%) | 103 (78.63%) | 0.158 |
| Sepsis (based on ICD-9 codes) | 2 (2.47%) | 0 (0.00%) | 6 (4.58%) | 0.257 |
| Sepsis (based on Angus criteria) | 11 (13.58%) | 15 (24.59%) | 52 (39.69%) | <0.001 |
| Lab examination | ||||
| WBC (K/ul) | 13.00 (9.70–15.60) | 11.90 (10.10–13.83) | 12.10 (9.22–16.67) | 0.647 |
| Platelet (K/ul) | 153.50 (121.00–190.00) | 151.00 (108.00–184.00) | 137.50 (108.88–194.00) | 0.747 |
| Hemoglobin (g/dl) | 8.90 (7.90–10.00) | 9.30 (7.70–10.30) | 9.25 (7.82–10.28) | 0.612 |
| Creatinine (mg/dl) | 0.80 (0.70–1.10) | 1.00 (0.80–1.30) | 1.40 (1.00–1.95) | <0.001 |
| BUN (mg/dl) | 16.00 (13.00–19.00) | 17.00 (15.00–21.00) | 24.00 (18.00–30.00) | <0.001 |
| Glucose (mg/dl) | 160.00 (138.00–180.00) | 162.00 (139.00–191.00) | 185.00 (153.00–236.00) | <0.001 |
| Lactate (mmol/l) | 2.50 (2.00–3.90) | 3.15 (2.03–4.85) | 3.60 (1.95–6.65) | 0.034 |
| PTT (sec) | 35.42 (31.22–41.99) | 34.55 (30.40–41.95) | 36.80 (30.57–44.38) | 0.702 |
| INR | 1.30 (1.20–1.45) | 1.30 (1.15–1.40) | 1.30 (1.20–1.60) | 0.371 |
| PT (sec) | 14.50 (13.62–15.53) | 14.35 (13.20–15.22) | 14.55 (13.26–16.04) | 0.596 |
Data are expressed as median (interquartile range) or n (%). Kruskal Wallis and Chi-square (or Fisher's exact) tests were used to analyze continuous and categorical variables, respectively. Statistical significance (P<0.05) is shown in bold. ICU, intensive care unit; SOFA, Sepsis-related Organ Failure Assessment; APACHE III, Acute Physiology and Chronic Health Evaluation III; RTT, renal replacement therapy; ICD-9, International Classification of Diseases, 9th Revision; WBC, white blood cell; BUN, blood urea nitrogen; PTT, partial thromboplastin time; INR, international normalised ratio; PT, prothrombin time.
Figure 2.
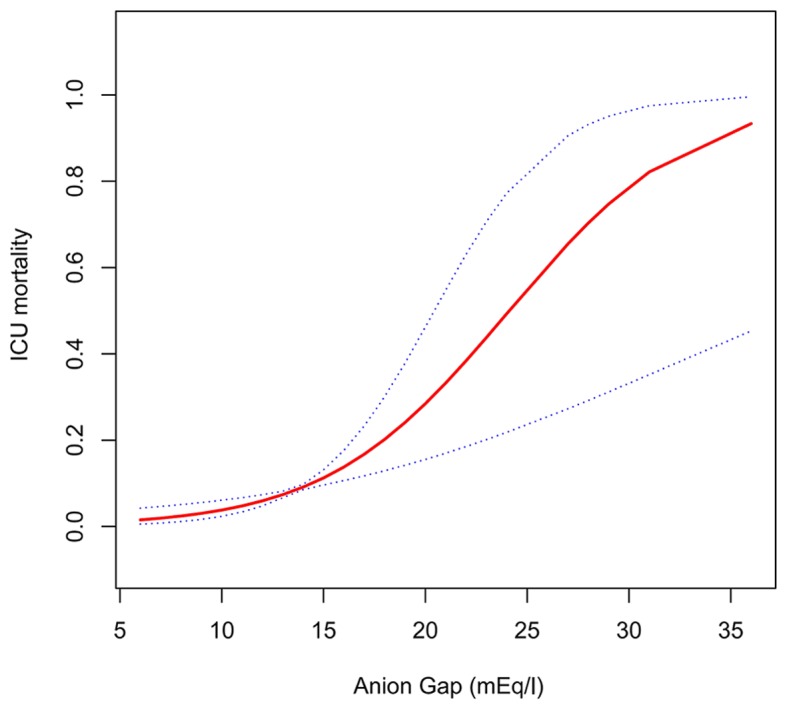
Non-linear curve fitting of the relationship between anion gap and ICU mortality. Adjusted for age, SOFA and sex. ICU, intensive care unit.
Table IV.
Threshold effect analysis of anion gap on ICU mortality using piecewise linear regression.
| Inflection point of anion gap on ICU mortality (mEq/l) | β (95% CI) | ∆β (95% CI) | P-value | P for ∆β |
|---|---|---|---|---|
| <17 | 1.51 (1.12, 2.04) | 0.0074 | ||
| >17 | 1.14 (0.97, 1.34) | 0.1148 | ||
| 0.76 (0.51–1.12) | 0.1580 |
Adjusted for age, SOFA, and sex. ICU, intensive care unit; CI, confidence interval; SOFA, Sepsis-related Organ Failure Assessment.
Table V.
Univariate analysis of intensive care unit mortality.
| Variable | OR (95% CI) | P-value |
|---|---|---|
| Age | 1.07 (1.01, 1.12) | 0.0116 |
| Sex | ||
| Male | 1.0 | |
| Female | 1.59 (0.69, 3.70) | 0.2772 |
| Type of aortic aneurysm | ||
| Thoracic aneurysm without mention of rupture | 1.0 | |
| Abdominal aneurysm (ruptured) | 6.18 (2.01, 18.98) | 0.0015 |
| Abdominal aneurysm without mention of rupture | 1.54 (0.49, 4.86) | 0.4610 |
| Anion Gap (mEq/l) | 1.36 (1.22, 1.52) | <0.0001 |
| Severity score | ||
| SOFA | 1.46 (1.26, 1.69) | <0.0001 |
| APSIII | 1.05 (1.03, 1.07) | <0.0001 |
| Vital signs | ||
| Heartrate (bpm) | 1.07 (1.03, 1.10) | 0.0004 |
| Systolic pressure (mmHg) | 0.98 (0.95, 1.02) | 0.3266 |
| Diastolic pressure (mmHg) | 1.04 (0.99, 1.10) | 0.1182 |
| Respiratory rate (bpm) | 1.15 (1.02, 1.29) | 0.0183 |
| Temperature (°C) | 0.59 (0.32, 1.09) | 0.0909 |
| SpO2 (%) | 0.97 (0.93, 1.01) | 0.0993 |
| Urine output in first day (ml) | 1.00 (1.00, 1.00) | 0.0014 |
| RTT in first day | ||
| No | 1.0 | |
| Yes | 17.64 (2.79, 111.52) | 0.0023 |
| Ventilation in first day | ||
| No | 1.0 | |
| Yes | 2.36 (0.54, 10.41) | 0.2564 |
| Sepsis (based on ICD-9 codes) | ||
| No | 1.0 | |
| Yes | 12.25 (2.85, 52.69) | 0.0008 |
| Sepsis (based on Angus criteria) | ||
| No | 1.0 | |
| Yes | 4.92 (2.05, 11.8) | 0.0004 |
| Lab examination | ||
| White blood cell (K/ul) | 1.05 (0.98, 1.13) | 0.1357 |
Table VI.
Multivariate logistic regression for effects of anion gap on intensive care unit mortality.
| Variable | Odds ratio | 95% confidence interval | P-value |
|---|---|---|---|
| Non-adjusted | 1.36 | 1.22–1.52 | <0.0001 |
| Model I | 1.26 | 1.11–1.42 | 0.0003 |
| Model II | 1.38 | 1.08–1.76 | 0.0088 |
Model I, adjusted for age, sex, and SOFA. Model II, adjusted for type of aortic aneurysm, age, SOFA, blood urea nitrogen, heartrate, international normalised ratio, platelet, prothrombin time, PTT, respiratory rate, RTT in first day, urine output in first day, coagulopathy, hemoglobin, other neurological disease, glucose, sepsis (based on ICD-9 codes), and creatinine. Statistical significance (P<0.05) is shown in bold. SOFA, Sepsis-related Organ Failure Assessment; PTT, partial thromboplastin time; RTT, renal replacement therapy; ICD-9, International Classification of Diseases, 9th Revision.
Figure 3.
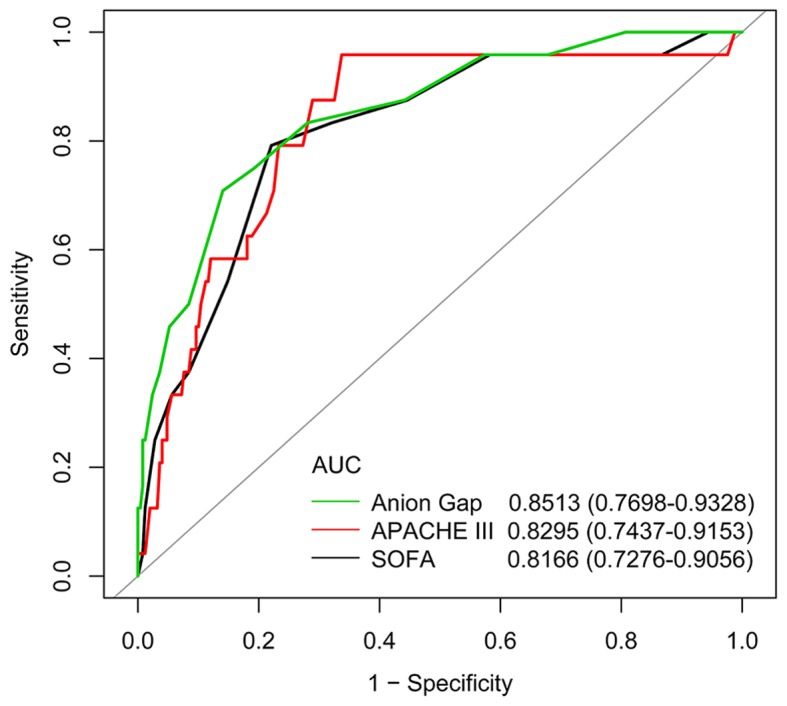
ROC curves of anion gap in the prediction of ICU mortality. The gray line represents the reference line. ROC curves, Receiver operating characteristic curves; ICU, intensive care unit; AUC, area under the ROC curves; APACHE III, Acute Physiology and Chronic Health Evaluation III; SOFA, Sepsis-related Organ Failure Assessment.
Subgroup analysis
The results of the stratified and interaction analyses of the association between admission serum anion gap and ICU mortality are presented in Fig. 4 and Table VII. The association appeared to be similar when compared with the results of the multivariable analysis shown in Table VI. A significant interaction (P<0.05) was found among subgroups of tertile of hemoglobin.
Figure 4.

Subgroup analysis of association between admission serum anion gap and ICU mortality. Horizontal lines represent 95% confidence intervals. P-values for interactions were calculated with the use of likelihood-ratio tests comparing logistic regression models (after adjusting for age, sex and SOFA) with and without cross-product terms for each level of baseline stratifying variables, with admission serum anion gap as an explanatory variable. Detailed data are shown in Table VII. ICU, intensive care unit; OR, odds ratio; CI, confidence interval.
Table VII.
Subgroup analysis of associations between anion gap and intensive care unit mortality.
| Variable | n | OR | 95% CI Low | 95% CI High | P-value | P-value (interaction) |
|---|---|---|---|---|---|---|
| Type of aortic aneurysm | 0.1361 | |||||
| Thoracic aneurysm without mention of rupture | 109 | 1.22 | 0.98 | 1.53 | 0.0781 | |
| Abdominal aneurysm (ruptured) | 48 | 1.25 | 1.00 | 1.57 | 0.0464 | |
| Abdominal aneurysm without mention of rupture | 116 | 2.02 | 1.19 | 3.42 | 0.0087 | |
| Sepsis (based on Angus criteria) | 0.8300 | |||||
| No | 195 | 1.29 | 1.07 | 1.55 | 0.0069 | |
| Yes | 78 | 1.25 | 1.03 | 1.52 | 0.0216 | |
| Coagulopathy | 0.2672 | |||||
| No | 226 | 1.39 | 1.15 | 1.67 | 0.0006 | |
| Yes | 47 | 1.19 | 0.98 | 1.44 | 0.0814 | |
| Hemoglobin | 0.0134 | |||||
| Low | 91 | 1.13 | 0.99 | 1.28 | 0.0727 | |
| Middle | 86 | 1.94 | 1.20 | 3.13 | 0.0065 | |
| High | 95 | 1.53 | 1.00 | 2.35 | 0.0522 | |
| Fluid and electrolyte disorders | 0.9546 | |||||
| No | 197 | 1.27 | 1.09 | 1.49 | 0.0022 | |
| Yes | 76 | 1.26 | 1.04 | 1.54 | 0.0197 |
Adjusted for: Age, sex and SOFA. Statistical significance (P<0.05) is shown in bold. OR, odds ratio; CI, confidence interval.
Sensitive analysis
The imputation of missing variables did not affect the results (Table VIII), which were virtually unchanged (<10%) after excluding ruptured AA patients (Table IX and X).
Table IX.
Univariate analysis of ICU mortality after excluding patients with ruptured aortic aneurysm.
| Variable | OR (95% CI) | P-value |
|---|---|---|
| Age | 1.07 (1.00, 1.14) | 0.0523 |
| Sex | ||
| Male | 1.0 | |
| Female | 3.36 (1.00, 11.27) | 0.0494 |
| Type of aortic aneurysm | ||
| Thoracic aneurysm without mention of rupture | 1.0 | |
| Abdominal aneurysm without mention of rupture | 1.54 (0.49, 4.86) | 0.4610 |
| Anion gap (mEq/l) | 1.44 (1.19, 1.75) | 0.0002 |
| Severity score | ||
| SOFA | 1.38 (1.16, 1.65) | 0.0002 |
| APSIII | 1.05 (1.02, 1.08) | 0.0003 |
| Vital signs | ||
| Heartrate (bpm) | 1.06 (1.01, 1.10) | 0.0161 |
| Systolic pressure (mmHg) | 0.98 (0.94, 1.03) | 0.4983 |
| Diastolic pressure (mmHg) | 1.02 (0.95, 1.09) | 0.5753 |
| Respiratory rate (bpm) | 1.12 (0.96, 1.31) | 0.1427 |
| Temperature (°C) | 0.52 (0.23, 1.18) | 0.1193 |
| SpO2 (%) | 0.97 (0.93, 1.01) | 0.1316 |
| Urine output in first day (ml) | 1.00 (1.00, 1.00) | 0.1029 |
| RTT in first day | ||
| No | 1.0 | |
| Yes | 8.75 (0.74, 103.44) | 0.0852 |
| Ventilation in first day | ||
| No | 1.0 | |
| Yes | 2.79 (0.35, 22.09) | 0.3309 |
| Sepsis (based on ICD-9 codes) | ||
| No | 1.0 | |
| Yes | 23.11 (4.96, 107.61) | 0.0001 |
| Sepsis (based on angus criteria) | ||
| No | 1.0 | |
| Yes | 5.62 (1.75, 17.98) | 0.0036 |
| Lab examination | ||
| WBC (K/ul) | 1.04 (0.94, 1.14) | 0.4594 |
| Platelet (K/ul) | 0.99 (0.98, 1.00) | 0.0758 |
| Hemoglobin (g/dl) | 0.70 (0.50, 0.98) | 0.0398 |
| Creatinine (mg/dl) | 1.66 (1.05, 2.64) | 0.0310 |
| BUN (mg/dl) | 1.06 (1.01, 1.10) | 0.0106 |
| Glucose (mg/dl) | 1.01 (1.00, 1.01) | 0.0585 |
| Lactate (mmol/l) | 1.53 (1.21, 1.93) | 0.0004 |
| PTT (sec) | 1.02 (0.99, 1.05) | 0.1386 |
| INR | 1.43 (0.26, 7.73) | 0.6795 |
| PT (sec) | 0.95 (0.72, 1.27) | 0.7441 |
| Comorbidities | ||
| Congestive heart failure | ||
| No | 1.0 | |
| Yes | 2.44 (0.28, 21.47) | 0.4213 |
| Cardiac arrhythmias | ||
| No | 1.0 | |
| Yes | 2.12 (0.25, 18.41) | 0.4938 |
| Valvular disease | ||
| No | 1.0 | |
| Yes | 8.75 (0.74, 103.44) | 0.0852 |
| Pulmonary circulation disorder | ||
| No | 1.0 | |
| Yes | 0.00 (0.00, Inf) | 0.9935 |
| Peripheral vascular disorder | ||
| No | 1.0 | |
| Yes | 1.92 (0.60, 6.14) | 0.2693 |
| Hypertension | ||
| No | 1.0 | |
| Yes | 3.67 (0.92, 14.71) | 0.0659 |
| Paralysis | ||
| No | 1.0 | |
| Yes | 0.00 (0.00, Inf) | 0.9908 |
| Other neurological disease | ||
| No | 1.0 | |
| Yes | 17.58 (1.04, 298.62) | 0.0473 |
| Chronic pulmonary disease | ||
| No | 1.0 | |
| Yes | 1.51 (0.48, 4.80) | 0.4832 |
| Uncomplicated diabetes | ||
| No | 1.0 | |
| Yes | 0.45 (0.06, 3.59) | 0.4529 |
| Complicated diabetes | ||
| No | 1.0 | |
| Yes | 0.00 (0.00, Inf) | 0.9908 |
| Hypothyroidism | ||
| No | 1.0 | |
| Yes | 1.85 (0.38, 8.95) | 0.4462 |
| Renal failure | ||
| No | 1.0 | |
| Yes | 2.59 (0.66, 10.13) | 0.1712 |
| Liver disease | ||
| No | 1.0 | |
| Yes | 3.45 (0.37, 31.91) | 0.2752 |
| Lymphoma | ||
| No | 1.0 | |
| Yes | 0.00 (0.00, Inf) | 0.9921 |
| Metastatic cancer | ||
| No | 1.0 | |
| Yes | 0.00 (0.00, Inf) | 0.9930 |
| Solid tumor | ||
| No | 1.0 | |
| Yes | 0.00 (0.00, Inf) | 0.9908 |
| Rheumatoid arthritis | ||
| No | 1.0 | |
| Yes | 2.44 (0.28, 21.47) | 0.4213 |
| Coagulopathy | ||
| No | 1.0 | |
| Yes | 2.80 (0.81, 9.7) | 0.1034 |
| Obesity | ||
| No | 1.0 | |
| Yes | 0.00 (0.00, Inf) | 0.9913 |
| Weight loss | ||
| No | 1.0 | |
| Yes | 0.00 (0.00, Inf) | 0.9921 |
| Fluid and electrolyte disorders | ||
| No | 1.0 | |
| Yes | 0.97 (0.26, 3.67) | 0.9666 |
| Blood loss anemia | ||
| No | 1.0 | |
| Yes | 0.00 (0.00, Inf) | 0.9921 |
| Deficiency anemias | ||
| No | 1.0 | |
| Yes | 0.00 (0.00, Inf) | 0.9895 |
| Alcohol abuse | ||
| No | 1.0 | |
| Yes | 0.00 (0.00, Inf) | 0.9916 |
| Psychoses | ||
| No | 1.0 | |
| Yes | 8.75 (0.74, 103.44) | 0.0852 |
| Depression | ||
| No | 1.0 | |
| Yes | 0.00 (0.00, Inf) | 0.9901 |
Statistical significance (P<0.05) is shown in bold. ICU, intensive care unit; OR, odds ratio; CI, confidence interval; SOFA, Sepsis-related Organ Failure Assessment; APACHE III, Acute Physiology and Chronic Health Evaluation III; RTT, renal replacement therapy; ICD-9, International Classification of Diseases, 9th Revision; WBC, white blood cell; BUN, blood urea nitrogen; PTT, partial thromboplastin time; INR, international normalised ratio; PT, prothrombin time.
Table X.
Multivariate logistic regression for effects of anion gap on ICU mortality after excluding patients with ruptured aortic aneurysm.
| Variable | OR | 95% CI | P-value |
|---|---|---|---|
| Non-adjusted | 1.44 | 1.19–1.75 | 0.0002 |
| Model I | 1.33 | 1.08–1.62 | 0.0064 |
| Model II | 1.46 | 1.09–1.97 | 0.0112 |
Model I, adjusted for age, sex, and SOFA. Model II, adjusted for sex, SOFA, BUN, heartrate, hemoglobin, sepsis (based on ICD-9 codes), other neurological disease, and creatinine. Statistical significance (P<0.05) is shown in bold. ICU, intensive care unit; OR, odds ratio; CI, confidence interval.
Discussion
The present study examined for the first time the predictive value of serum anion gap on ICU mortality in AA patients, and the results suggested that the risk of ICU mortality may increase by 38% per 1 mEq/l increase in admission serum anion gap.
Many studies have explored the relationship between anion gap and clinical outcomes of critically ill patients. In fact, as early as 1987, Shackleton et al (14) noted that an elevation of the unmeasured anion gap was significantly and independently associated with mortality for ruptured AAA patients. Grist and Thomas (28) reported that anion gap is a risk factor in long-term extracorporeal support. Kim et al (19) found a similar association in a pediatric ICU. However, Rocktaeschel et al (29) concluded that unmeasured anions, irrespective of the calculated methods, were not practical predictors of hospital mortality in critically ill patients. In addition, the use of anion gap for risk stratification in critically ill patients is not supported for the significant statistical heterogeneity according to a recent systematic review and meta-analysis conducted by Glasmacher and Stones (20). Considering the urgent need for a practical and useful predictive model of AA (30), which is notorious for high mortality, it is essential to keep exploring predictors of clinical outcomes for AA patients. As anion gap is routinely determined in all patients admitted to ICU and there is no extra cost for this potential beneficial test, a study that specifically focused on AA patients was necessary, given the extremely low incidence of AA. The results of our study validated the association between serum anion gap and ICU mortality, which was in accordance with most previous studies (20), suggesting that serum anion gap may serve as a mortality predictor for AA patients in ICU. The AUC of anion gap was similar to the SOFA and APACHE III values in our study. As anion gap is a traditional tool used to assess acid-base status, most previous studies usually attribute the association to acid-base disorders, which contribute significantly to morbidity and mortality in critically ill patients (31). Taylor et al (32) reported that anion gap is independently associated with higher blood pressure, which is associated with negative outcomes for AA patients (33), thus the underlying mechanism requires further research.
Several limitations of our study should be noted. First, although hypoalbuminemia could affect its interpretation, anion gap was not corrected for serum albumin level in our study as most subjects analyzed lacked albumin records. Second, although attempts were taken to control bias and confounders, many other known or unknown factors may still exist and have contributed to bias. For example, although we took into consideration fluid and electrolyte disorders (identified by ICD-9 codes) as a potential confounder, the quantities and types of intravenous infusion fluids before ICU admission may have affected the value of serum anion gap on ICU admission. Other potential confounders including smoking status, diameters of the aorta, and surgical procedures were not considered in the study. In addition, given the observational nature of our study, it is not possible to conclude that the relationship between admission serum anion gap and ICU mortality reflects cause and effect.
In summary, the present retrospective observational study provided confirmation of the association between serum anion gap on admission and ICU mortality of AA patients. However, further prospective clinical studies are still required, particularly to explore the potential value of anion gap in improving various predictive models for ICU outcomes.
Table V.
Univariate analysis of ICU mortality.
| Variable | OR (95% CI) | P-value |
|---|---|---|
| Platelet (K/ul) | 0.99 (0.98, 1.00) | 0.0248 |
| Hemoglobin (g/dl) | 0.71 (0.56, 0.89) | 0.0035 |
| Creatinine (mg/dl) | 2.00 (1.39, 2.90) | 0.0002 |
| Blood urea nitrogen (mg/dl) | 1.06 (1.03, 1.10) | 0.0003 |
| Glucose (mg/dl) | 1.01 (1.00, 1.01) | 0.0005 |
| Lactate (mmol/l) | 1.41 (1.22, 1.61) | <0.0001 |
| PTT (sec) | 1.03 (1.01, 1.05) | 0.0017 |
| INR | 3.24 (1.30, 8.1) | 0.0116 |
| Prothrombin time (sec) | 1.08 (1.01, 1.16) | 0.0270 |
| Comorbidities | ||
| Congestive heart failure | 0.9714 | |
| No | 1.0 | |
| Yes | 1.04 (0.13, 8.48) | |
| Cardiac arrhythmias | 0.9543 | |
| No | 1.0 | |
| Yes | 0.94 (0.12, 7.62) | |
| Valvular disease | 0.1767 | |
| No | 1.0 | |
| Yes | 5.37 (0.47, 61.50) | |
| Pulmonary circulation disorder | 0.9897 | |
| No | 1.0 | |
| Yes | 0.00 (0.00, Inf) | |
| Peripheral vascular disorder | 0.7121 | |
| No | 1.0 | |
| Yes | 1.19 (0.47, 3.00) | |
| Hypertension | 0.1389 | |
| No | 1.0 | |
| Yes | 2.42 (0.75, 7.81) | |
| Paralysis | 0.6076 | |
| No | 1.0 | |
| Yes | 1.76 (0.20, 15.27) | |
| Other neurological disease | 0.0182 | |
| No | 1.0 | |
| Yes | 11.23 (1.51, 83.62) | |
| Chronic pulmonary disease | 0.9793 | |
| No | 1.0 | |
| Yes | 1.01 (0.40, 2.54) | |
| Uncomplicated diabetes | 0.3465 | |
| No | 1.0 | |
| Yes | 0.49 (0.11, 2.17) | |
| Complicated diabetes | 0.9905 | |
| No | 1.0 | |
| Yes | 0.00 (0.00, Inf) | |
| Hypothyroidism | 0.6046 | |
| No | 1.0 | |
| Yes | 1.40 (0.39, 5.07) | |
| Renal failure | 0.1343 | |
| No | 1.0 | |
| Yes | 2.26 (0.78, 6.55) | |
| Liver disease | 0.1235 | |
| No | 1.0 | |
| Yes | 3.68 (0.70, 19.34) | |
| Lymphoma | ||
| No | 1.0 | |
| Yes | 0.00 (0.00, Inf) | 0.9918 |
| Metastatic cancer | ||
| No | 1.0 | |
| Yes | 0.00 (0.00, Inf) | 0.9897 |
| Solid tumor | ||
| No | 1.0 | |
| Yes | 0.00 (0.00, Inf) | 0.9905 |
| Rheumatoid arthritis | ||
| No | 1.0 | |
| Yes | 1.50 (0.18, 12.76) | 0.7088 |
| Coagulopathy | ||
| No | 1.0 | |
| Yes | 2.69 (1.08, 6.72) | 0.0339 |
| Obesity | ||
| No | 1.0 | |
| Yes | 0.00 (0.00, Inf) | 0.9909 |
| Weight loss | ||
| No | 1.0 | |
| Yes | 0.00 (0.00, Inf) | 0.9875 |
| Fluid and electrolyte disorders | ||
| No | 1.0 | |
| Yes | 1.63 (0.68, 3.90) | 0.2725 |
| Blood loss anemia | ||
| No | 1.0 | |
| Yes | 2.66 (0.29, 24.83) | 0.3899 |
| Deficiency anemias | ||
| No | 1.0 | |
| Yes | 0.27 (0.04, 2.10) | 0.2135 |
| Alcohol abuse | ||
| No | 1.0 | |
| Yes | 0.00 (0.00, Inf) | 0.9913 |
| Psychoses | ||
| No | 1.0 | |
| Yes | 3.57 (0.36, 35.67) | 0.2793 |
| Depression | ||
| No | 1.0 | |
| Yes | 0.00 (0.00, Inf) | 0.9893 |
Statistical significance (P<0.05) is shown in bold. OR, odds ratio; CI, confidence interval; SOFA, Sepsis-related Organ Failure Assessment; APACHE III, Acute Physiology and Chronic Health Evaluation III; RTT, renal replacement therapy; ICD-9, International Classification of Diseases, 9th Revision; PTT, partial thromboplastin time; INR, international normalised ratio.
Table VIII.
Multivariate logistic regression for effects of anion gap on ICU mortality using imputed datasets.
| Variable | OR | 95% CI | P-value |
|---|---|---|---|
| Dataset 1 | |||
| Non-adjusted | 1.36 | 1.22–1.52 | <0.0001 |
| Model I | 1.26 | 1.11–1.42 | 0.0003 |
| Model II | 1.26 | 1.01–1.59 | 0.0440 |
| Dataset 2 | |||
| Non-adjusted | 1.36 | 1.22–1.52 | <0.0001 |
| Model I | 1.26 | 1.11–1.42 | 0.0003 |
| Model II | 1.35 | 1.06–1.71 | 0.0141 |
| Dataset 3 | |||
| Non-adjusted | 1.36 | 1.22–1.52 | <0.0001 |
| Model I | 1.26 | 1.11–1.42 | 0.0003 |
| Model II | 1.36 | 1.07–1.74 | 0.0125 |
| Dataset 4 | |||
| Non-adjusted | 1.36 | 1.22–1.52 | <0.0001 |
| Model I | 1.26 | 1.11–1.42 | 0.0003 |
| Model II | 1.39 | 1.10–1.76 | 0.0052 |
| Dataset 5 | |||
| Non-adjusted | 1.36 | 1.22–1.52 | <0.0001 |
| Model I | 1.26 | 1.11–1.42 | 0.0003 |
| Model II | 1.44 | 1.12–1.84 | 0.0043 |
| Pooled | |||
| Non-adjusted | 1.36 | 1.22–1.52 | <0.0001 |
| Model I | 1.26 | 1.11–1.43 | 0.0002 |
| Model II | 1.36 | 1.05–1.76 | 0.0195 |
Model I, adjusted for age and SOFA. Model II, adjusted for type of aortic aneurysm, age, SOFA, BUN, heartrate, INR, platelet, PT, PTT, respiratory rate, RTT in first day, urine output in first day, hemoglobin, other neurological disease, glucose, sepsis (based on ICD-9 codes), creatinine, and lactate. Dataset 3–5 were adjusted for model II and coagulopathy. Statistical significance (P<0.05) is shown in bold. OR, odds ratio; CI, confidence interval; ICU, intensive care unit; SOFA, Sepsis-related Organ Failure Assessment; BUN, blood urea nitrogen; INR, international normalised ratio; PT, prothrombin time; PTT, partial thromboplastin time; RTT, renal replacement therapy; ICD-9, International Classification of Diseases, 9th Revision.
Acknowledgements
Not applicable.
Glossary
Abbreviations
- ICU
intensive care unit
- AA
aortic aneurysm
- IQR
interquartile range
- OR
odds ratio
- CI
confidence interval
- TAA
thoracic aortic aneurysm
- AAA
abdominal aortic aneurysm
- MIMIC-III
Medical Information Mart for Intensive Care III
- ROC
receiver operating characteristic
- AUC
area under the ROC curve
- SOFA
Sepsis-related Organ Failure Assessment
- APACHE III
Acute Physiology and Chronic Health Evaluation III
- ICD-9
International Classification of Diseases, 9th Revision
Funding
This work was supported by the Natural Science Foundation of Guangdong Province China (grant number 2015A030310346); the Special Funds for the Cultivation of Guangdong College Students' Scientific and Technological Innovation (‘Climbing Program’ Special Funds).
Availability of data and materials
The datasets generated and analyzed during the current study are available in the PhysioBank repository, https://mimic.physionet.org/.
Authors' contributions
KH, QCC, and QGC designed the study. QCC, QGC, LL, XL, and SIC performed data extraction and the data were analyzed by QCC, QGC, YL, ZT, and WL. The manuscript draft was prepared by LL and revised by KH, QCC and QGC. All authors approved the final manuscript.
Ethics approval and consent to participate
The access of the database was approved by the institutional review boards of both Beth Israel Deaconess Medical Center and Massachusetts Institute of Technology Affiliates. No informed consent was required because the data are anonymized.
Patient consent for publication
Not applicable.
Competing interests
The authors declare that they have no competing interests.
References
- 1.Johnston KW, Rutherford RB, Tilson MD, Shah DM, Hollier L, Stanley JC. Suggested standards for reporting on arterial aneurysms. Subcommittee on reporting standards for arterial aneurysms, Ad Hoc Committee on Reporting Standards, Society for Vascular Surgery and North American Chapter, International Society for Cardiovascular Surgery. J Vasc Surg. 1991;13:452–458. doi: 10.1067/mva.1991.26737. [DOI] [PubMed] [Google Scholar]
- 2.Isselbacher EM. Thoracic and abdominal aortic aneurysms. Circulation. 2005;111:816–828. doi: 10.1161/01.CIR.0000154569.08857.7A. [DOI] [PubMed] [Google Scholar]
- 3.Elefteriades JA, Sang A, Kuzmik G, Hornick M. Guilt by association: Paradigm for detecting a silent killer (thoracic aortic aneurysm) Open Heart. 2015;2:e000169. doi: 10.1136/openhrt-2014-000169. [DOI] [PMC free article] [PubMed] [Google Scholar]
- 4.Howard DP, Banerjee A, Fairhead JF, Handa A, Silver LE, Rothwell PM. Oxford Vascular Study: Age-specific incidence, risk factors and outcome of acute abdominal aortic aneurysms in a defined population. Br J Surg. 2015;102:907–915. doi: 10.1002/bjs.9838. [DOI] [PMC free article] [PubMed] [Google Scholar]
- 5.Stuntz M. Modeling the burden of abdominal aortic aneurysm in the USA in 2013. Cardiology. 2016;135:127–131. doi: 10.1159/000446871. [DOI] [PubMed] [Google Scholar]
- 6.Nair N, Shaw C, Sarfati D, Stanley J. Abdominal aortic aneurysm disease in New Zealand: Epidemiology and burden between 2002 and 2006. N Z Med J. 2012;125:10–20. [PubMed] [Google Scholar]
- 7.Robertson EN, Jeremy RW. Abstract 10144: Uncovering the burden of familial thoracic aortic aneurysm disease. Circulation. 2013;128:A10144. [Google Scholar]
- 8.Johansson G, Markström U, Swedenborg J. Ruptured thoracic aortic aneurysms: A study of incidence and mortality rates. J Vasc Surg. 1995;21:985–988. doi: 10.1016/S0741-5214(95)70227-X. [DOI] [PubMed] [Google Scholar]
- 9.Soden PA, Schermerhorn ML. The epidemiology of ruptured abdominal aortic aneurysm (rAAA) In: Starnes BW, Mehta M, Veith FJ, editors. Ruptured abdominal aortic aneurysm: The definitive manual. Cham: Springer International Publishing; 2017. pp. 15–48. [DOI] [Google Scholar]
- 10.Polzer S, Gasser TC. Biomechanical rupture risk assessment of abdominal aortic aneurysms based on a novel probabilistic rupture risk index. J R Soc Interface. 2015;12:20150852. doi: 10.1098/rsif.2015.0852. [DOI] [PMC free article] [PubMed] [Google Scholar]
- 11.Tambyraja A, Murie J, Chalmers R. Predictors of outcome after abdominal aortic aneurysm rupture: Edinburgh ruptured aneurysm score. World J Surg. 2007;31:2243–2247. doi: 10.1007/s00268-007-9181-5. [DOI] [PubMed] [Google Scholar]
- 12.Marković M, Davidović L, Maksimović Z, Kostić D, Cinara I, Cvetković S, Sindjelic R, Seferović PM, Ristić AD. Ruptured abdominal aortic aneurysm. Predictors of survival in 229 consecutive surgical patients. Herz. 2004;29:123–129. doi: 10.1007/s00059-004-2540-1. [DOI] [PubMed] [Google Scholar]
- 13.Gutiérrez-Morlote J, Llorca J, de Elejalde Ibáñez E, Lobato A, José San JM. Predictors of mortality in patients undergoing surgery for ruptured aortic aneurysm. Vasa. 2002;31:265–268. doi: 10.1024/0301-1526.31.4.265. [DOI] [PubMed] [Google Scholar]
- 14.Shackleton CR, Schechter MT, Bianco R, Hildebrand HD. Preoperative predictors of mortality risk in ruptured abdominal aortic aneurysm. J Vasc Surg. 1987;6:583–589. doi: 10.1067/mva.1987.avs0060583. [DOI] [PubMed] [Google Scholar]
- 15.Lee SW, Kim S, Na KY, Cha RH, Kang SW, Park CW, Cha DR, Kim SG, Yoon SA, Han SY, et al. Serum anion gap predicts all-cause mortality in patients with advanced chronic kidney disease: A retrospective analysis of a randomized controlled study. PLoS One. 2016;11:e0156381. doi: 10.1371/journal.pone.0156381. [DOI] [PMC free article] [PubMed] [Google Scholar]
- 16.Leskovan JJ, Justiniano CF, Bach JA, Cook CH, Lindsey DE, Eiferman DS, Papadimos TJ, Steinberg SM, Bergese SD, Stawicki SP, Evans DC. Anion gap as a predictor of trauma outcomes in the older trauma population: Correlations with injury severity and mortality. Am Surg. 2013;79:1203–1206. [PubMed] [Google Scholar]
- 17.Honore PM, Joannes-Boyau O, Boer W. Strong ion gap and outcome after cardiac arrest: Another nail in the coffin of traditional acid-base quantification. Intensive Care Med. 2009;35:189–191. doi: 10.1007/s00134-008-1316-0. [DOI] [PubMed] [Google Scholar]
- 18.Sahu A, Cooper HA, Panza JA. The initial anion gap is a predictor of mortality in acute myocardial infarction. Coron Artery Dis. 2006;17:409–412. doi: 10.1097/00019501-200608000-00002. [DOI] [PubMed] [Google Scholar]
- 19.Kim MJ, Kim YH, Sol IS, Kim SY, Kim JD, Kim HY, Kim KW, Sohn MH, Kim KE. Serum anion gap at admission as a predictor of mortality in the pediatric intensive care unit. Sci Rep. 2017;7:1456. doi: 10.1038/s41598-017-01681-9. [DOI] [PMC free article] [PubMed] [Google Scholar]
- 20.Glasmacher SA, Stones W. Anion gap as a prognostic tool for risk stratification in critically ill patients-a systematic review and meta-analysis. BMC Anesthesiol. 2016;16:68. doi: 10.1186/s12871-016-0241-y. [DOI] [PMC free article] [PubMed] [Google Scholar]
- 21.Johnson AE, Pollard TJ, Shen L, Lehman LW, Feng M, Ghassemi M, Moody B, Szolovits P, Celi LA, Mark RG. MIMIC-III, a freely accessible critical care database. Sci Data. 2016;3:160035. doi: 10.1038/sdata.2016.35. [DOI] [PMC free article] [PubMed] [Google Scholar]
- 22.Johnson AE, Stone DJ, Celi LA, Pollard TJ. The MIMIC Code Repository: Enabling reproducibility in critical care research. J Am Med Inform Assoc. 2018;25:32–39. doi: 10.1093/jamia/ocx084. [DOI] [PMC free article] [PubMed] [Google Scholar]
- 23.Vincent JL, Moreno R, Takala J, Willatts S, De Mendonça A, Bruining H, Reinhart CK, Suter PM, Thijs LG. The SOFA (Sepsis-related Organ Failure Assessment) score to describe organ dysfunction/failure. On behalf of the Working Group on Sepsis-Related Problems of the European Society of Intensive Care Medicine. Intensive Care Med. 1996;22:707–710. doi: 10.1007/BF01709751. [DOI] [PubMed] [Google Scholar]
- 24.Knaus WA, Wagner DP, Draper EA, Zimmerman JE, Bergner M, Bastos PG, Sirio CA, Murphy DJ, Lotring T, Damiano A, et al. The APACHE III prognostic system. Risk prediction of hospital mortality for critically ill hospitalized adults. Chest. 1991;100:1619–1636. doi: 10.1378/chest.100.6.1619. [DOI] [PubMed] [Google Scholar]
- 25.Angus DC, Linde-Zwirble WT, Lidicker J, Clermont G, Carcillo J, Pinsky MR. Epidemiology of severe sepsis in the United States: Analysis of incidence, outcome, and associated costs of care. Crit Care Med. 2001;29:1303–1310. doi: 10.1097/00003246-200107000-00002. [DOI] [PubMed] [Google Scholar]
- 26.Steiner C, Elixhauser A, Schnaier J. The healthcare cost and utilization project: An overview. Eff Clin Pract. 2002;5:143–151. [PubMed] [Google Scholar]
- 27.Donders AR, van der Heijden GJ, Stijnen T, Moons KG. Review: A gentle introduction to imputation of missing values. J Clin Epidemiol. 2006;59:1087–1091. doi: 10.1016/j.jclinepi.2006.01.014. [DOI] [PubMed] [Google Scholar]
- 28.Grist G, Thomas D. Blood anion gaps and venoarterial carbon dioxide gradients as risk factors in long-term extracorporeal support. J Extra Corpor Technol. 1997;29:6–10. [PubMed] [Google Scholar]
- 29.Rocktaeschel J, Morimatsu H, Uchino S, Bellomo R. Unmeasured anions in critically ill patients: Can they predict mortality? Crit Care Med. 2003;31:2131–2136. doi: 10.1097/01.CCM.0000079819.27515.8E. [DOI] [PubMed] [Google Scholar]
- 30.Thompson PC, Dalman RL, Harris EJ, Chandra V, Lee JT, Mell MW. Predictive models for mortality after ruptured aortic aneurysm repair do not predict futility and are not useful for clinical decision making. J Vasc Surg. 2016;64:1617–1622. doi: 10.1016/j.jvs.2016.07.121. [DOI] [PubMed] [Google Scholar]
- 31.Al-Jaghbeer M, Kellum JA. Acid-base disturbances in intensive care patients: Etiology, pathophysiology and treatment. Nephrol Dial Transplant. 2015;30:1104–1111. doi: 10.1093/ndt/gfu289. [DOI] [PubMed] [Google Scholar]
- 32.Taylor EN, Forman JP, Farwell WR. Serum anion gap and blood pressure in the national health and nutrition examination survey. Hypertension. 2007;50:320–324. doi: 10.1161/HYPERTENSIONAHA.107.092643. [DOI] [PubMed] [Google Scholar]
- 33.Kent KC, Zwolak RM, Egorova NN, Riles TS, Manganaro A, Moskowitz AJ, Gelijns AC, Greco G. Analysis of risk factors for abdominal aortic aneurysm in a cohort of more than 3 million individuals. J Vasc Surg. 2010;52:539–548. doi: 10.1016/j.jvs.2010.05.090. [DOI] [PubMed] [Google Scholar]
Associated Data
This section collects any data citations, data availability statements, or supplementary materials included in this article.
Data Availability Statement
The datasets generated and analyzed during the current study are available in the PhysioBank repository, https://mimic.physionet.org/.