

Abstract
Enolizations of highly substituted acyclic ketones used in the syntheses of tetrasubstituted olefin-based anticancer agents are described. Lithium hexamethyldisilazide (LiHMDS)-mediated enolizations are moderately Z-selective in neat tetrahydrofuran (THF) E-selective in 2.0 M THF/hexane. The results of NMR spectroscopy show the resulting enolates to be statistically distributed ensembles of E,E-, E,Z-, and Z,Z-enolate dimers with subunits that reflect the selectivities. The results of rate studies trace the preference for E and Z isomers to tetrasolvated- and pentasolvated-monomer-based transition structures, respectively. Enolization using LiHMDS in N,N-dimethylethylamine or triethylamine in toluene affords a 65:1 mixture of LiHMDS–lithium enolate mixed dimers containing E and Z isomers, respectively. Spectroscopic studies show that condition-dependent complexation of ketone to LiHMDS occurs in trialkylamine/toluene. Rate study findings attribute the high selectivity exclusively to monosolvated-dimer-based transition structures.
TOC Graphic
Introduction
As part of our program to develop GDC-0810, a selective estrogen receptor degrader currently in clinical trials for the treatment of breast cancer,1 we required an efficient and stereoselective synthesis of a tetrasubstituted acyclic all-carbon olefin, a structural motif central to a number of anticancer agents including tamoxifen,2 idoxifene,3 and etacstil.4 Our strategy, outlined in Scheme 1, was fraught with challenges, not the least of which was the requisite E-selective enolization en route to desired olefin E-4.5
Scheme 1.

Strategy for the stereoselective synthesis of tetrasubstituted acyclic all-carbon olefins.
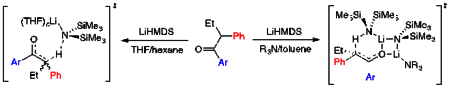
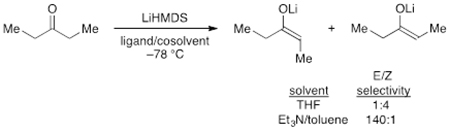
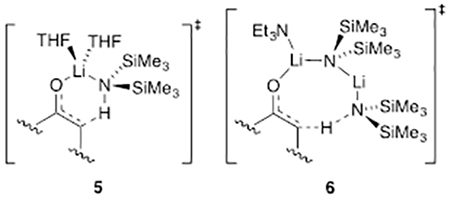
The plan was founded on lithium hexamethyldisilazide (LiHMDS)-mediated enolizations of much simpler ketones showing highly solvent-dependent E/Z selectivities (eq 1).6 The dependencies in such uncongested cases derive from markedly different mechanisms corresponding to monomer- and dimer-based transition structures 5 and 6,7,8 which offered the possibility that the stereoselectivity would extend to the stereochemically demanding case in Scheme 1. Indeed, 65:1 E/Z selectivity exceeded expectations.5 In this paper, we describe the combination of spectroscopic, kinetic, and computational methods used to ascertain the origins of the low selectivities observed with LiHMDS/tetrahydrofuran (THF) and the high selectivities observed with LiHMDS/trialkylamine/toluene.
 |
(1) |
Results
General.
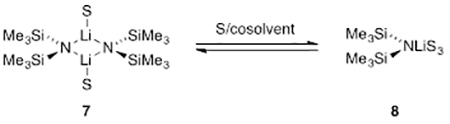
LiHMDS, [6Li]LiHMDS, and [6Li,15N]LiHMDS were prepared and purified as white crystalline solids.9 Previous studies of LiHMDS described solvent-dependent dimer-monomer mixtures (eq 2), although the equilibrium was surprisingly sensitive to the choice of hydrocarbon cosolvent (vide infra).10,11 Rate studies were undertaken using the tactics described in two reviews.12 Density functional theory (DFT) computations were carried out at the B3LYP/6–31G(d) level of theory13 with single-point MP2 calculations.
 |
(2) |
Enolate Structures: THF.
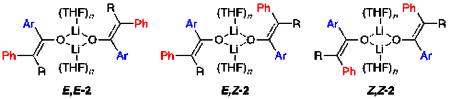
The enolization of 1 using [6Li,15N]LiHMDS in neat THF at 0 °C afforded an ensemble of three resonances recorded at –80 °C and designated E,E-2, E,Z-2, and Z,Z-2 (1:32:67; Figure 1A). This result was consistent with the approximate 1:6 E/Z selectivity shown with tosylation and subsequent high-performance liquid chromatography analysis.5 The absence of resonances displaying 6Li–15N coupling confirmed that detectable mixed aggregates were not present. As the THF concentration decreased, the distribution of enolates shifted to favor E-2 (Figure 1B–D) with a concurrent shift in the distribution of isomeric trapped tosylates. The method of continuous variation,14 was used to plot of the relative populations of E,E-2, E,Z-2, and Z,Z-2 versus measured mole fraction15 of the E-2 subunit (χE) and obtain a Job plot16 (Figure 2) confirming the dimer assignment.
Figure 1.

6Li NMR spectra of mixtures containing E,E-2, E,Z-2, and Z,Z-2 from 0.10 M [6Li,15N] LiHMDS (showing no coupling) and 0.10 M 1 in THF/hexane at –80 °C after aging at 0 °C for 48 h: (A) neat THF (12.2 M); (B) 6.0 M THF/hexane; (C) 4.5 M THF/hexane; and (D) 3.0 M THF/hexane. The measured mole fractions (χE) of E-2 in A–D are 0.17, 0.30, 0.56, and 0.66, respectively.
Figure 2.

Job plot showing the relative integration of the 6Li resonances versus the measured mole fraction (XE)15 of E-2 for 0.10 M mixtures of E- 2 and Z-2 at –80 °C at varying THF concentrations in hexane (see Figure 1).
At <3.0 M THF (the right side of Figure 2), enolate insolubility became a problem. On a positive note, we obtained an X-ray crystal structure that, although of marginal quality, showed a trisolvated tetramer (Figure 3).
Figure 3.

Low-resolution X-ray crystal structure of 2 crystallized from 0.10 M enolate generated in 2.0 M THF/hexane solutions. The compound is a trisolvated tetramer composed of four E-2 subunits.17
Computational studies at the B3LYP level of theory with the 6–31G(d) basis set and MP2 correction13,14 were used to probe some of the inherent properties of the enolate dimers. Serial solvation showed that E,E-2, E,Z-2, and Z,Z-2 saturated at tetrasolvation (n = 2). The heterodimer E,Z-2 showed a small (0.4 kcal/mol) net stabilization, as observed experimentally.
Mechanism of Enolization: THF.
Enolizations of 1 (0.010 M) with LiHMDS (0.020–0.20 M) in THF/hexane mixtures (2.0–12.2 M THF) were followed at 0 °C. The results of in situ IR spectroscopy18 showed that the loss of 1 (1687 cm–1) followed a first-order decay. The pseudo-first-order rate constants (kobsd) were independent of the initial concentration of 1, consistent with a first-order ketone dependence. Ketone 1 deuterated at the 2-position (1-d1) afforded an isotope effect (kH/kD = 6) consistent with rate-limiting proton transfer.
A plot of initial rates19 versus THF concentration revealed a deceptively simple dependence; a fit to rate = a[THF]n afforded n = 2.8 (Figure 4, inset). The deception stemmed from the shift of >95% disolvated dimer in 2.0 M THF/hexane to >95% trisolvated monomer in neat THF (eq 2).10 A simple power function did not account for the dimer-monomer equilibrium or the affiliated change in solvation per Li. If the reaction had proceeded via a single mechanism involving disolvated monomer (AS2), such as transition structure 5, a maximum in the plot at intermediate THF concentrations would have been observed.20 That the rates continue rising even as trisolvated monomer becomes dominant demands that an even more highly solvated form be involved in the enolization. By monitoring the THF-dependent E/Z selectivities over the analogous range of THF concentrations, we separated the components of the two pathways and showed that they contribute to second- and third-order dependencies (see Figure 4, curves A and B, respectively). Once again, these orders, which are consistent with the measured ratios, were not trivial to extract from the data and required fitting to the model discussed below and described in the supporting information. Using toluene in place of hexane resulted in no measurable difference in the THF dependence, which seems self-evident except that pronounced hydrocarbon effects on LiHMDS/THF-mediated enolizations have been observed.20
Figure 4.

Plot of initial rate vs THF concentration in hexane for the enolization of 1 (0.010 M) with LiHMDS (0.10 M) at 0 °C measured with IR spectroscopy (1687 cm–1). The inset depicts an unweighted least-squares fit to y = axn [a = 0.05 ± 0.03, n = 2.8 ± 0.2]. Curves A and B represent unweighted least-squares fits to each half of eq 3 (k1 and k2, respectively) with A2(THF)2 described in eq 4. The initial rates for the formation of E-2 were determined by multiplying the proportion of E-2 at a given THF concentration by the total initial rate at that concentration. The initial rates of Z-2 formation were calculated similarly.
A plot of initial rates versus LiHMDS concentration in neat THF, conditions in which trisolvated monomer 8 (eq 2, S = THF) dominated (97%), showed a first-order dependence (Figure 5), confirming that the observable monomer reacts as a monomer. The analogous plot in 2.0 M THF/hexane, which favored dimer (96%), revealed an approximate half-order dependence (Figure 6) consistent with a dimer–monomer pre-equilibrium followed by a monomer-based metalation.
Figure 5.

Plot of initial rate vs LiHMDS concentration in neat THF (12.2 M) for the enolization of 1 (0.010 M) at 0 ºC measured with IR spectroscopy (1687 cm–1). The curve depicts an unweighted least-squares fit to y = axn [a = 6.3 ± 0.5, n = 1.01 ± 0.04].
Figure 6.

Plot of initial rate vs LiHMDS concentration in 2.0 M THF/hexane for the enolization of 1 (0.010 M) at 0 ºC measured with IR spectroscopy (1687 cm–1). The curve depicts an unweighted least-squares fit to y = axn [a = 4.4 ± 0.2, n = 0.58 ± 0.02].
The rate data are consistent with the rate law in eq 3 and the mechanism illustrated in eqs 4–7.21 The complexity stems from solving for [A2(THF)2] while accounting for both the shifting ground state—dimer to monomer—and the corresponding change in solvation number per Li. The underlying math is beyond the scope of this paper and is relegated to the supporting information.
| (3) |
| (4) |
| (5) |
| (6) |
| (7) |
Structures of LiHMDS/ketone complexes: Trialkylamines.
The rate studies of LiHMDS/trialkylamine-mediated enolizations were necessarily founded on the structural assignments of LiHMDS in the various trialkylamines with ketone present (Scheme 2). In weakly coordinating trialkylamines, LiHMDS–ketone complexes were readily observed. They differed quantitatively from analogous complexes formed from 2-methylcyclohexanone or 3-pentanone owing to weaker binding.8
Scheme 2.

Condition-dependent equilibria for LiHMDS/ketone in DMEA with toluene hydrocarbon cosolvent.
In the absence of trialkylamines at –100 °C, ketone 1 complexed to LiHMDS dimer 9 to afford mono- and dicomplexed dimers 10 and 11. Complex 10 displayed an IR absorbance at 1671 cm–1 and, in the NMR spectra, two 6Li triplets (1:1) coupled to a single 15N quintet. Complex 11 appeared as a 6Li triplet and 15N quintet. Complexation in the presence of trialkylamines depended on the structure of the amine. Triethylamine failed to convert 10 to 12 even at 5.0 M triethylamine (Et3N). The less sterically demanding N,N-dimethylethylamine (DMEA), by contrast, readily afforded amine solvate 12 at >0.30 M DMEA. Elevated concentrations of DMEA converted 12 to LiHMDS monomer 14 and free ketone 1, as shown with IR and NMR spectroscopies. Of importance to the rate studies was that complex 12 persisted as the dominant form of the ketone at elevated LiHMDS concentrations. Notably, ketone 1 was more easily dissociated than less hindered ketones.8
On first inspection, the inclusion of toluene-solvated monomer 13 may seem unusual. However, previous studies of LiHMDS/trialkylamines showed substantial hydrocarbon cosolvent effects.11 Resolution precluded such investigations of DMEA/hydrocarbon mixtures. The results from spectroscopic studies using Et2NMe/toluene mixtures illustrate qualitatively the magnitude of such toluene effects on the dimer-monomer equilibria (Figure 7).
Enolate Structures: DMEA.
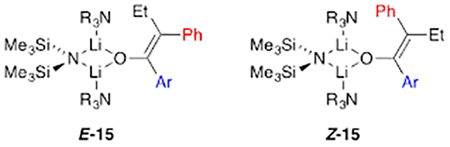
Enolization of 1 using 1.0 equiv of LiHMDS in DMEA/toluene afforded homoaggregated enolates as broad mounds, which suggested oligomerization (possibly laddering22). By contrast, enolization using ≥2.0 equiv of [6Li,15N]LiHMDS afforded lithium enolate–LiHMDS mixed aggregate8 E-15 along with traces of Z-15, consistent with the 65:1 E/Z selectivity observed with tosylation.6 The dimeric mixed aggregates displayed characteristic 6Li–15N coupling (3.6 Hz) and offered an independent measure of the E/Z selectivity. Treating the mixed dimers with THF afforded E,E-2, traces of E,Z-2, and free LiHMDS monomer. DFT computations were used to probe the solvation of LiHMDS–enolate mixed aggregates, and the E- and Z-enolate mixed dimers were shown to be disolvated E-15 and Z-15, respectively.
Enolization Mechanism: Et3N.
LiHMDS/Et3N-mediated enolizations are mechanistically simple and familiar from previous studies.8 The results of in situ IR spectroscopy showed that enolizations of 1 with LiHMDS in Et3N/toluene at 0 °C involved first-order decays of complex 10 (1671 cm–1). A kinetic isotope effect (kH/kD = 7) confirmed rate-limiting proton transfer. A plot of kobsd versus Et3N concentration (Figure 8) and free LiHMDS concentration (Figure 9) showed first and zeroth orders, respectively. Unsolvated complex 10 was observed spectroscopically. The rate law in eq 9 is consistent with the mechanism described by eqs 10 and 11. Replacing toluene with hexane caused a limited (1.3-fold) rate increase.
| (8) |
| (9) |
| (10) |
Figure 8.

Plot of kobsd vs Et3N concentration in toluene for the enolization of 1 (0.0050 M) with LiHMDS (0.10 M) at 0 °C measured with IR spectroscopy (1671 cm–1). The curve depicts an unweighted least-squares fit to y = axn [a = 0.53 ± 0.03, n = 1.00 ± 0.03]. Analogous linearity and reaction order are replicated by the more complex function described in the text.
Figure 9.

Plot of kobsd vs LiHMDS concentration in 1.10 M Et3N/toluene for the enolization of 1 (0.0025 M) at 0 ºC measured with IR spectroscopy (1671 cm–1). The curve depicts an unweighted least-squares fit to y = ax + b [a = 0.60 ± 0.02, b = 0.1 ± 0.1].
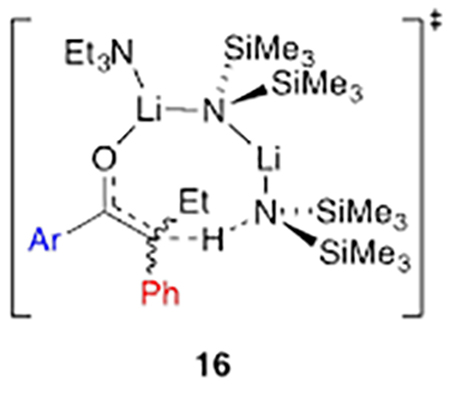
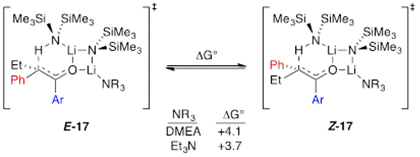
DFT computations of the dimer-based metalation were an attempt to probe open dimer-based transition structures (16) bearing 8-membered rings that allowed for optimal collinear proton transfer (eq 12). In all cases, however, the computations converged on closed structures E-17 and Z-17 (eq 12). The relative energies were congruent with those of a highly E-selective enolization.
 |
(11) |
Enolization Mechanism: DMEA.
Rate studies using DMEA were significantly more challenging owing to condition-dependent solution structures, as shown in Scheme 2. The enolizations of 1 with LiHMDS in 0.60 M DMEA/toluene at –40 °C—conditions favoring solvated complex 12—showed first-order decays of 12 (1671 cm–1), and the measured isotope effect (kH/kD = 8) confirmed rate-limiting proton transfer. Plotting kobsd versus DMEA concentration (Figure 10) was complex, but the results were consistent with the observed structural changes: a first-order dependence at the low-DMEA-concentration limit akin to that observed for Et3N abruptly gave way to inhibition owing to facile decomplexation (vide infra). Swapping toluene with hexane as the cosolvent (see Figure 10, inset) revealed an analogous result but with the maximum shifted to higher DMEA concentrations consistent with the relative stabilization of uncomplexed LiHMDS monomer with toluene versus hexane.
Figure 10.

Plot of kobsd vs DMEA concentration with toluene cosolvent for the enolization of 1 (0.0050 M) with LiHMDS (0.10 M) at –40 °C measured with IR spectroscopy (1687 cm−1). The inset shows analogous data for hexane cosolvent. The curves depict unweighted least-squares fits to eq 13, which is described fully in the supporting information. Notably, the function describing the dependence of complex 12 in eq 13 changes with the choice of cosolvent.
A plot of kobsd versus LiHMDS concentration (Figure 11) at 0.60 M DMEA revealed a zeroth-order dependence consistent with the direct reaction of complex 12. Thus, the rate law at low DMEA concentration was consistent with that of a monosolvated-dimer-based enolization as observed for Et3N (eq 9). A plot of kobsd versus LiHMDS concentration in neat DMEA, conditions in which uncomplexed ketone dominated at low LiHMDS concentration and became complexed as dimer 12 at high LiHMDS concentration, showed second-order saturation (Figure 12). This result, in conjunction with the high E/Z selectivities determined with NMR spectroscopy and high-performance liquid chromatography analysis under these conditions, confirmed that monomer 14 reaggregated to complex 12 before reacting. The rate law and mechanism are described by eqs 13–15 below.
Figure 11.

Plot of kobsd vs LiHMDS concentration in 0.60 M DMEA/toluene for the enolization of 1 (0.0025 M) at –40 ºC measured with IR spectroscopy (1671 cm–1). The curve depicts an unweighted least-squares fit to y = ax + b [a = 0.74 ± 0.02, b = 0.12 ± 0.02].
Figure 12.

Plot of kobsd vs LiHMDS concentration in neat DMEA (9.2 M) for the enolization of 1 (0.0050 M) at –40 °C measured with IR spectroscopy (1687 cm−1). The curve depicts an unweighted least-squares fit to eq 13, which is described fully in the supporting information.
Mathematical Model.
The rate of enolization is described by eq 13. The challenges of solving for the concentration of 12 were acute because this value is a function of the concentrations of four components (eq 13). The overall equation that describes the concentration of 12 is cumbersome (huge) and relegated to the supporting information. In brief, the model accounts for the complex curvatures shown in Figure 10. The flattening at high DMEA concentrations is not only demanded by the rate data but also by the known toluene dependence illustrated in Figure 7. The second-order saturation behavior in Figure 12 is also not unassailable from inspection but is required by the observable LiHMDS-concentration-dependent reaggregation of monomer 14 to form complexed LiHMDS dimer 12 at the saturation plateau. Finally, the model includes provisions for the simple dependencies in Figures 8, 9, and 11, which call for much simpler functions in the absence of knowledge of the shifting structures.
| (12) |
| (13) |
| (14) |
Figure 7.

Simulated plot of LiHMDS aggregate concentrations— A2S2-AS2T-AS3—as a function of Et2NMe concentration in toluene highlighting the influence of toluene.11
Discussion
Tetrasubstituted alkene moieties as central motifs of GDC-0810 and a number of key anticancer agents pose particularly daunting synthetic challenges.1–4 The potentially general solution to the problem presented in Scheme 1 is notable, yet the mediocre stereoselectivity obtained using LiHMDS/THF for the enolization of 1 underscores a central challenge. LiHMDS in DMEA/toluene solves the problem of stereoselectivity. Reversing the roles of the Ar and Ph moieties offers the final puzzle piece—full stereocontrol.5
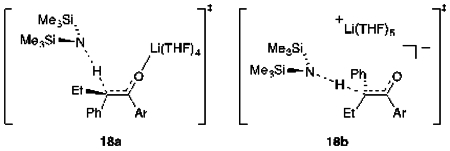
Structural and mechanistic studies of the enolizations are summarized in Scheme 1. Enolization with LiHMDS in neat THF affords an ensemble of E,E-2, E,Z-2, and Z,Z-2 dimeric enolates that reflect the 1:6 E/Z selectivity confirmed by the trapping with Ts2O described in a previous paper.5 Reduced THF concentrations reverse the selectivity, promoting a slight (2:1) preference for E-2. The results of rate studies reveal that the E selectivity stems from a dominant tetrasolvated-monomer-based pathway, whereas the Z selectivity arises from a pentasolvated-monomer-based pathway. The different selectivities may originate from closed and open transition structures (respectively) or even contact- and solvent-separated ion pairs, but such highly solvated systems defy scrutiny with DFT methods. Attempts to compute transition structures with lower solvation numbers (18, n = 1–3) were not predictive and are relegated to the supporting information. Structures 18a and 18b are merely artists’ renditions. We also hasten to add that minor contributions from other solvates could easily go undetected, but the THF-concentration-dependent change in selectivity stems primarily from a differential solvation of only one THF (see Figure 4).
Previous studies showed that LiHMDS in trialkylamine/hydrocarbon mixtures enolize simple ketones (eq 1) with extraordinarily high selectivity via a dimer-based pathway suggested by MNDO computations to be 6.8 Indeed, the enolization of 1 with LiHMDS/DMEA or LiHMDS/Et3N afforded what may be an even more extraordinary 65:1 E/Z selectivity. The resulting enolates in poorly coordinating trialkylamines form mixed aggregates E-15 and Z-15 in proportions consistent with trapping experiments.5 Adding THF converted the mixed aggregates to an ensemble of dimers dominated by homodimer E,E-2.
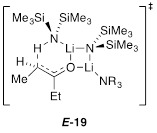
The results of structural and mechanistic studies using Et3N show that ketone complex 11 is not observably solvated to form 12. However, rate study findings clearly implicate monosolvated-dimer-based transition structure E-17 analogous to results with the less congested ketones.8 The developing mixed dimer motif in E-17—the developing transannular Li–O contact—was observed computationally to the exclusion of the 8-membered ring depicted in 6. We reinvestigated 6 with 3-pentanone using DFT and found that the transition structure converged on the closed motif E-19 analogous to E-17. In all cases, intrinsic reaction coordinate calculations in the reverse direction reveal a lengthening on the transannular Li–O contact toward a structure resembling that of 6.
This summary seems neat and tidy and almost simple, but the structural and mechanistic complexity should not be underestimated. Ketone complex 11 is readily converted to the corresponding solvate 12 at low concentrations of the relatively unhindered DMEA. Elevated DMEA concentrations, however, deaggregate 12 to form LiHMDS monomer with the concomitant liberation of free ketone. Moreover, LiHMDS deaggregation is remarkably sensitive to the choice of hydrocarbon cosolvent, as noted previously for LiHMDS/N,N-diethylmethylamine. In DMEA/hexane, the sole observable monomer is trisolvate 14. Toluene, by contrast, stabilizes the monomer and promotes deaggregation and decomplexation owing to the intervention of disolvated monomer 13 stabilized by a molecule of toluene. Whether toluene is explicitly bound is unknowable, but the fit to an explicit solvate is excellent.
At this point, the data analysis becomes gruesome. Although parallel pathways from a common ground state are readily deconvoluted, we are just beginning to develop the numerical skills to model systems with multiple condition-dependent reactants.20 The fit in Figure 10, for example, is based on a complex equation crudely outlined in eqs 13–15 and described thoroughly in the supporting information. The slight upward curvature at the high DMEA concentrations in Figure 10 stems from contributions by the toluene-solvated monomer. The model includes provisions for simple dependencies in the other figures as well.
We highlight an key observation about the role of aggregate-based reactivity for LiHMDS/DMEA. In neat DMEA, the dominant form of LiHMDS is trisolvated LiHMDS monomer 14 uncomplexed by ketone; however, highly E-selective enolization and saturation kinetics (see Figure 12) show that the preferred pathway involves reaggregation to complexed dimer 12 (observable at the saturation plateau) and enolization via dimer-based transition structure E-17. The notion that a monomer would reaggregate to react seems blasphemous, but evidence supporting such processes has begun to accumulate (including a LiHMDS/THF-mediated enolization).12b,20,23
Conclusion
The preceding analyses presented a particularly interesting problem in which a pharmaceutical need for an acutely challenging stereoselective enolization aligned with an academic interest in solvation and aggregation effects on enolizations. The application of LiHMDS/trialkylamine mixtures to enolizations have been largely (although not entirely) of academic interest until now. LiHMDS in trialkylamine-hydrocarbon mixtures is a highly efficacious, cost-effective base-solvent combination.
The notion that stereoselectivity stems from (at least) two discrete pathways is a truism with implications that can be overlooked. The idea that selectivity can be controlled by diverting a monomer-based enolization to a dimer-based pathway or by merely decreasing the solvation number by a single solvent is more nuanced. To this end, we emphasize that it is not only constructive to vary solvents during optimizations but also to vary solvent concentrations and even the hydrocarbon cosolvent.12a
Experimental
Reagents and solvents.
THF, toluene, hexane, and the trialkylamines were distilled from blue or purple solutions containing sodium benzophenone ketyl. LiHMDS, [6Li]LiHMDS, and [6Li,15N]LiHMDS were prepared as ligand- and LiCl-free recrystallized solids.9 Ketone 1 was prepared as described in a preceding paper.5 Air- and moisture-sensitive materials were manipulated under argon using standard glovebox, vacuum line, and syringe techniques.
2-Deutero-1-(4-fluorophenyl)-2-phenylbutan-1-one (1-d1).
Following a literature procedure,24 we charged a small vial with 1.0 g of 1 in 2.5 mL MeOD under positive argon flow. To the vial was added 1.0 mL of 2.60 M NaOD/D2O. The solution was stirred for 30 min. The vial was opened, and 35% DCl was added until the solution was neutralized. Three extractions were performed with pentane, followed by solvent removal in vacuo. The oil was further purified via column chromatography (10% ether/pentane) to afford 0.86 grams 1-d1 (86% yield) as a clear, slightly yellow oil. The results of 1H NMR spectroscopy and gas chromatography-mass spectroscopy showed >99% 1–d1.
IR spectroscopic analyses.
IR spectra were recorded using an in situ IR spectrometer fitted with a 30-bounce, silicon-tipped probe. The spectra were acquired in 16 scans at a gain of 1 and a resolution of 4 cm–1. A representative reaction was carried out as follows: The IR probe was inserted through a nylon adapter and O-ring seal into an oven-dried, cylindrical flask fitted with a magnetic stir bar and a T-joint. The T-joint was capped with a septum for injections and a nitrogen line. After evacuation under full vacuum, heating, and flushing with nitrogen, the flask was charged with LiHMDS (84 mg, 0.50 mmol) in THF/hexane (4.9 mL total volume) and cooled to 0 °C with a stirred ice bath. After recording a background spectrum, we added ketone 1 (0.050 mmol in 0.10 mL) with stirring. The carbonyl absorbance at 1687 cm–1 was monitored over the course of the reaction.
NMR spectroscopic analyses.
All NMR samples for reaction monitoring and structure elucidation were prepared using stock solutions and sealed under partial vacuum. Standard 1H, 6Li, 13C, and 15N NMR spectra were recorded at 500, 73.57, 125.79, and 36.14 MHz, respectively.
Supplementary Material
Scheme 3.

Summary of mechanisms for the enolization of ketone 1 using LiHMDS.
Acknowledgments
Acknowledgements. In memory of Dr. Andrew McClory who tragically passed away on February 19, 2017. DBC and KAM thank the National Institutes of Health (GM077167 and GM039764) for financial support and the National Science Foundation (NSF-MRI, CHE-1531632) for support of the Cornell NMR facility.
Footnotes
Supporting Information. Spectroscopic, kinetic, and computational data and complete reference 13. This material is available free of charge via the Internet at http://pubs.acs.org.
Notes
The authors declare no competing financial interests.
References and Footnotes
- 1.Lai A; Kahraman M; Govek S; Nagasawa J; Bonnefous C; Julien J; Douglas K; Sensintaffar J; Lu N; Lee K.-j; Aparicio A; Kaufman J; Qian J; Shao G; Prudente R; Moon MJ; Joseph JD; Darimont B; Brigham D; Grillot K; Heyman R; Rix PJ; Hager JH; Smith ND J. Med. Chem 2015, 58, 4888. [DOI] [PubMed] [Google Scholar]
- 2.(a) DeGregorio MW; Wiebe VJ Tamoxifen and Breast Cancer, 2nd ed.; Yale University Press: New Haven, CT, 1999. [Google Scholar]; (b) Levenson AS; Jordan VC Eur. J. Cancer 1999, 35, 1628. [DOI] [PubMed] [Google Scholar]
- 3.McCague R; Leclercq G; Legros N; Goodman J; Blackburn GM; Jarman M; Foster AB J. Med. Chem 1989, 32, 2527. [DOI] [PubMed] [Google Scholar]
- 4.Connor CE; Norris JD; Broadwater G; Willson TM; Gottardis MM; Dewhirst MW; McDonnell DP Cancer Res 2001, 61, 2917. [PubMed] [Google Scholar]
- 5.Li BX; Le DN; Mack KA; McClory A; Lim N-K; Cravillion T; Savage S; Han C; Collum DB; Zhang H; Gosselin FJ Am. Chem. Soc 2017, 139, 10777. [DOI] [PMC free article] [PubMed] [Google Scholar]
- 6.(a) Masamune S; Ellingboe JW; Choy WJ Am. Chem. Soc 1982, 104, 5526. [Google Scholar]; (b) Gaudemar M; Bellassoued M Tetrahedron Lett 1989, 30, 2779. [Google Scholar]; (c) Heathcock CH; Buse CT; Kleschick WA; Pirrung MC; Sohn JE; Lampe JJ Org. Chem 1980, 45, 1066. [Google Scholar]; (d) McCarthy PA; Kageyama MJ Org. Chem 1987, 52, 4681. [Google Scholar]; (j) Davis FA; Sheppard AC; Chen B-C; Haque MS J. Am. Chem. Soc 1990, 112, 6679. [Google Scholar]
- 7.Zhao P; Condo A; Keresztes I; Collum DB J. Am. Chem. Soc 2004, 126, 3113. [DOI] [PubMed] [Google Scholar]
- 8.(a) Godenschwager P; Collum DB J. Am. Chem. Soc 2008, 130, 8726. [DOI] [PMC free article] [PubMed] [Google Scholar]; (b) Zhao P; Collum DB J. Am. Chem. Soc 2003, 125, 14411. [DOI] [PubMed] [Google Scholar]; (c) Snaddon TN; Buchgraber P; Schulthoff S; Wirtz C; Mynott R; Furstner A Chem. Eur. J 2010, 16, 12133. [DOI] [PubMed] [Google Scholar]
- 9.(a) Tomasevich LL; Collum DB J. Am. Chem. Soc 2014, 136, 9710. [DOI] [PMC free article] [PubMed] [Google Scholar]; (b) Romesberg FE; Bernstein MP; Gilchrist JH; Harrison AT; Fuller DJ; Collum DB J. Am. Chem. Soc 1993, 115, 3475. [Google Scholar]
- 10.Lucht BL; Collum DB J. Am. Chem. Soc 1995, 117, 9863. [Google Scholar]
- 11.Lucht BL; Collum DB J. Am. Chem. Soc 1996, 118, 2217. [Google Scholar]
- 12.(a) Collum DB; McNeil AJ; Ramírez A Angew. Chem., Int. Ed 2007, 46, 3002. [DOI] [PubMed] [Google Scholar]; (b) Algera RF; Gupta L; Hoepker AC; Liang J; Ma Y; Singh KJ; Collum DB J. Org. Chem 2017, 139, xxASAP. [DOI] [PMC free article] [PubMed] [Google Scholar]
- 13.Gaussian 09, Revision A.02, Frisch MJ, Trucks GW, Schlegel HB, Scuseria GE, Robb MA, Cheeseman JR, Scalmani G, Barone V, Petersson GA, Nakatsuji H, Li X, Caricato M, Marenich A, Bloino J, Janesko BG, Gomperts R, Mennucci B, Hratchian HP, Ortiz JV, Izmaylov AF, Sonnenberg JL, Williams-Young D, Ding F, Lipparini F, Egidi F, Goings J, Peng B, Petrone A, Henderson T, Ranasinghe D, Zakrzewski VG, Gao J, Rega N, Zheng G, Liang W, Hada M, Ehara M, Toyota K, Fukuda R, Hasegawa J, Ishida M, Nakajima T, Honda Y, Kitao O, Nakai H, Vreven T, Throssell K, Montgomery JA, Peralta JE, Ogliaro F, Bearpark M, Heyd JJ, Brothers E, Kudin KN, Staroverov VN, Keith T, Kobayashi R, Normand J, Raghavachari K, Rendell A, Burant JC, Iyengar SS, Tomasi J, Cossi M, Millam JM, Klene M, Adamo C, Cammi R, Ochterski JW, Martin RL, Morokuma K, Farkas O, Foresman JB, and Fox DJ, Gaussian, Inc., Wallingford CT, 2016. [Google Scholar]
- 14.(a) Renny JS; Tomasevich LL; Tallmadge EH; Collum DB Angew. Chem., Int. Ed 2013, 52, 11998. [DOI] [PMC free article] [PubMed] [Google Scholar]; (b) Liou LR; McNeil AJ; Ramírez A; Toombes GES; Gruver JM; Collum DB J. Am. Chem. Soc 2008, 130, 4859. [DOI] [PMC free article] [PubMed] [Google Scholar]
- 15.Measuring the mole fraction within only the ensemble of interest rather than the overall mole fraction of lithium alkoxides added to the samples eliminates the distorting effects of impurities.
- 16.Job P Ann. Chim 1928, 9, 113. [Google Scholar]
- 17.“CYLview, 1.0b; Legault CY, Université de Sherbrooke, 2009. (http://www.cylview.org)”
- 18.Rein AJ; Donahue SM; Pavlosky MA Curr. Opin. Drug Discovery Dev 2000, 3, 734. [PubMed] [Google Scholar]
- 19.Casado J; Lopez-Quintela MA; Lorenzo-Barral FM J. Chem. Educ 1986, 63, 450. [Google Scholar]
- 20.Reyes-Rodríguez GJ; Algera RF; Collum DB J. Am. Chem. Soc 2017, 116, 1233. [DOI] [PMC free article] [PubMed] [Google Scholar]
- 21.The rate law provides the stoichiometry of the transition structure relative to that of the reactants: Edwards JO; Greene EF; Ross J J. Chem. Educ 1968, 45, 381. [Google Scholar]
- 22.(a) Gregory K; Schleyer P. v. R.; Snaith R Adv. Inorg. Chem 1991, 37, 47. [Google Scholar]; (b) Mulvey RE Chem. Soc. Rev 1991, 20, 167. [Google Scholar]
- 23.(a) Lucht BL; Bernstein MP; Remenar JF; Collum DB J. Am. Chem. Soc 1996, 118, 10707. [Google Scholar]; (b) Liang J; Hoepker AC; Algera RF; Ma Y; Collum DB J. Am. Chem. Soc 2015, 137, 6292. [DOI] [PMC free article] [PubMed] [Google Scholar]; (c) Plessel KN; Jones AC; Wherritt DJ; Maksymowicz RM; Poweleit ET; Reich HJ Org. Lett 2015, 17, 2310. [DOI] [PubMed] [Google Scholar]
- 24.Tomioka H; Hayashi N; Izawa Y; Senthilnathan VP; Platz MS J. Am. Chem. Soc 1983, 105, 5053. [Google Scholar]
Associated Data
This section collects any data citations, data availability statements, or supplementary materials included in this article.