

Abstract
Parkinson's Disease (PD) is an age-related, chronic neurodegenerative disorder. At present, there are no disease-modifying therapies to prevent PD progression. Activated microglia and neuroinflammation are associated with the pathogenesis and progression of PD. Accumulation of α-synuclein (α-SYN) in the brain is a core feature of PD and leads to microglial activation, inflammatory cytokine/chemokine production, and ultimately to neurodegeneration. Given the importance of the JAK/STAT pathway in activating microglia and inducing cytokine/chemokine expression, we investigated the therapeutic potential of inhibiting the JAK/STAT pathway using the JAK1/2 inhibitor, AZD1480. In vitro, α-SYN exposure activated the JAK/STAT pathway in microglia and macrophages, and treatment with AZD1480 inhibited α-SYN-induced major histocompatibility complex Class II and inflammatory gene expression in microglia and macrophages by reducing STAT1 and STAT3 activation. For in vivo studies, we used a rat model of PD induced by viral overexpression of α-SYN. AZD1480 treatment inhibited α-SYN-induced neuroinflammation by suppressing microglial activation, macrophage and CD4+ T-cell infiltration and production of proinflammatory cytokines/chemokines. Numerous genes involved in cell–cell signaling, nervous system development and function, inflammatory diseases/processes, and neurological diseases are enhanced in the substantia nigra of rats with α-SYN overexpression, and inhibited upon treatment with AZD1480. Importantly, inhibition of the JAK/STAT pathway prevented the degeneration of dopaminergic neurons in vivo. These results indicate that inhibiting the JAK/STAT pathway can prevent neuroinflammation and neurodegeneration by suppressing activation of innate and adaptive immune responses to α-SYN. Furthermore, this suggests the feasibility of targeting the JAK/STAT pathway as a neuroprotective therapy for neurodegenerative diseases.
SIGNIFICANCE STATEMENT α-SYN plays a central role in the pathophysiology of PD through initiation of neuroinflammatory responses. Using an α-SYN overexpression PD model, we demonstrate a beneficial therapeutic effect of AZD1480, a specific inhibitor of JAK1/2, in suppressing neuroinflammation and neurodegeneration. Our findings document that inhibition of the JAK/STAT pathway influences both innate and adaptive immune responses by suppressing α-SYN-induced microglia and macrophage activation and CD4+ T-cell recruitment into the CNS, ultimately suppressing neurodegeneration. These findings are the first documentation that suppression of the JAK/STAT pathway disrupts the circuitry of neuroinflammation and neurodegeneration, thus attenuating PD pathogenesis. JAK inhibitors may be a viable therapeutic option for the treatment of PD patients.
Keywords: α-synuclein, JAK/STAT pathway, JAKinibs, neurodegeneration, neuroinflammation, Parkinson's disease
Introduction
Parkinson's Disease (PD) is the most common neurodegenerative movement disorder, and pathologically characterized by a profound loss of dopaminergic (DA) neurons in the substantia nigra pars compacta (SNpc), and accumulation of misfolded α-synuclein (α-SYN) inclusions called Lewy bodies and Lewy neurites (Roodveldt et al., 2008; Obeso et al., 2010; Irwin et al., 2013; Lee et al., 2014). Genetic missense mutations or duplications of the α-SYN gene lead to familial forms of PD by increased expression and aggregation (Polymeropoulos et al., 1997; Singleton et al., 2003). Oligomeric α-SYN can be released from neurons, allowing α-SYN to propagate to neighboring neurons and glia (Lee et al., 2010). Oligomeric α-SYN is a potent activator of microglia and macrophages via engagement of toll-like receptors, leading to production of proinflammatory mediators (Zhang et al., 2005; Béraud and Maguire-Zeiss, 2012; Fellner et al., 2013; Kim et al., 2013; Daniele et al., 2015). Recently, interest in the role of inflammatory processes in PD has grown (Kannarkat et al., 2013; Sanchez-Guajardo et al., 2015; Van der Perren et al., 2015). In human postmortem tissues and PD animal models, there is compelling evidence for reactive microgliosis in the SNpc, increased expression of proinflammatory cytokines/chemokines, and infiltration of macrophages and CD4+ T cells. There is heightened expression of major histocompatibility complex (MHC) Class II molecules on macrophages/microglia in both human and murine PD brains (McGeer et al., 1988; Hamza et al., 2010; Harms et al., 2013). Studies of PD patients and PD animal models document that neuroinflammatory processes exacerbate the toxicity of α-SYN both within neurons and extracellularly, and have a critical role in the pathophysiology of PD.
The JAK/STAT pathway is the predominant signaling pathway used by cytokines, and is critical for initiating innate immunity, orchestrating adaptive immune mechanisms, and ultimately constraining inflammatory and immune responses (O'Shea and Plenge, 2012; Benveniste et al., 2014; O'Shea et al., 2015). More than 70 cytokines use the JAK/STAT pathway; there are four JAKs (JAK1, JAK2, JAK3, and TYK2), and seven STATs (STAT 1, 2, 3, 4, 5a, 5b, and 6). Cytokines, through activation of the JAK/STAT pathway, are of paramount importance in regulating the development, differentiation, and function of myeloid and lymphoid cells (Weaver et al., 2007; Geissmann et al., 2010). Dysregulation of the JAK/STAT pathway, particularly by activating and polarizing myeloid cells and T cells to pathogenic phenotypes, has pathological implications for neuroinflammatory diseases (O'Shea and Plenge, 2012; Benveniste et al., 2014). The JAK/STAT pathway is a therapeutic target in autoimmune diseases and solid and liquid tumors (O'Shea and Plenge, 2012; O'Shea et al., 2015; Villarino et al., 2015). A new class of therapeutics that target JAKs, Jakinibs, have proven efficacious in various disease settings, and two have been FDA approved for treatment of myeloproliferative diseases and rheumatoid arthritis (O'Shea et al., 2015). Jakinibs interrupt signaling downstream of multiple cytokines to various degrees, which may be a useful approach for PD, which is characterized by elevated levels of numerous cytokines in the periphery, CSF, and CNS. Jakinibs have acceptable safety profiles, and recent data from long-term studies indicate that the risk of adverse events in Jakinib-treated patients are similar to those seen with other biologic therapies (Kontzias et al., 2012).
We undertook studies to address an unanswered question in PD: is activation of the JAK/STAT pathway an important contributor to neuroinflammation and neurodegeneration? We used the AAV2-α-SYN rat model, a relevant model of synucleinopathy, given that α-SYN is expressed in DA neurons, and increases the abundance of α-SYN phosphorylated at Ser129 as well as nitrosylated α-SYN, both markers of abnormal α-SYN (Daher et al., 2014). Additionally, AAV2-α-SYN expression leads to progressive loss of DA neurons in the SNpC (Decressac et al., 2012). We demonstrate that α-SYN overexpression mediates activation of the JAK/STAT pathway, which promotes dysregulation of innate and adaptive immunity, ultimately contributing to neurodegeneration. Treatment with JAKinibs has therapeutic benefit in the AAV2-α-SYN model. These findings collectively document that suppression of the JAK/STAT pathway disrupts the circuitry of neuroinflammation and neurodegeneration characteristic in models of PD.
Materials and Methods
Animals and PD Model.
Male Sprague-Dawley rats were purchased from Harlan Laboratories. Male C57BL/6 mice were bred in the animal facility at the University of Alabama at Birmingham (UAB). Construction and purification of the rAAV vectors, rAAV-CBA-IRES-EGFP-WPRE (AAV2-GFP) and rAAV-CBA-SYNUCLEIN-IRES-EGFP-WPRE (AAV2-α-SYN), are as described previously (Harms et al., 2013). Rats (8–10 weeks) were deeply anesthetized with isoflurane and unilaterally injected with 2 μl of AAV2-α-SYN or AAV2-GFP (4.0 × 10¹² viral genome/ml diluted in sterile PBS) into the right SNpc. Coordinates were anterior–posterior 3.2 mm from bregma, mediolateral 1.2 mm from midline, and dorsoventral 4.6 mm from dura. All research conducted on animals was approved by the Institutional Animal Care and Use Committee at the University of Alabama at Birmingham. The neuroinflammatory response was analyzed at 4 weeks post-transduction, whereas neurodegeneration was examined at 12 weeks post-transduction.
JAK Inhibitor and treatment with AZD1480.
AZD1480, a JAK1/JAK2 inhibitor, was synthesized and provided by AstraZeneca R&D, and resuspended in DMSO, as previously described (Hedvat et al., 2009; McFarland et al., 2011; Liu et al., 2014). To test the effect of AZD1480 on the neuroinflammatory response in the α-SYN-induced PD model, AZD1480 at 10 mg/kg or DMSO as vehicle control (VH) was administered by oral gavage daily at the time point of 2 weeks post-transduction for an additional 2 weeks. To test the effect of AZD1480 on neurodegeneration, AZD1480 at 5 mg/kg or VH was administered by oral gavage daily at the time point of 4 weeks post-transduction for an additional 4 weeks, and then rats were allowed to rest for 4 weeks until euthanized. Rats were weighed and examined daily.
Murine primary macrophage and microglial cultures and α-SYN treatment.
Bone marrow derived macrophages (BMDM) were cultured with macrophage colony-stimulating factor -conditioned medium and microglia were isolated from postnatal C57BL/6 mice as described previously (Qin et al., 2006). Purified human α-SYN (1 mg/ml, r-Peptide) was incubated at 37°C with agitation for 7 d as previously described (Cao et al., 2010; Harms et al., 2013) and pulse sonicated for 2 s before adding to primary macrophage or microglial cultures. The cells were treated with 500 nm of aggregated human α-SYN, which was previously determined to be the optimal concentration, for various time periods (Harms et al., 2013).
Immunohistochemistry.
For fluorescent analysis at 4 weeks postinjection, animals were deeply anesthetized and transcardially perfused with heparinized 0.01 m PBS, pH 7.4, followed by 4% paraformaldehyde (PFA) in PBS. Brains were postfixed for 24 h in 4% PFA and then cryoprotected in a 30% sucrose solution in PBS. Brains were frozen on dry ice and cryosectioned coronally on a sliding microtome (thickness, 40 μm); sections were collected serially throughout the striatum and SNpc, placed into tissue collection solution (50% 0.01 m PBS, 50% glycerol), and stored at −20°C for immunohistochemical analysis. Free-floating sections (4/animal) were labeled with anti-MHC Class II (M5/114.15.2; eBioscience, 1:100), anti-Iba1 (Serotec, 1:500), anti-CD3 (Serotec, 1:500), anti-glial fibrillary acidic protein (GFAP; Rockland, 1:1000) or anti-tyrosine hydroxylase (TH; Millipore, 1:2000) antibodies overnight at 4°C. Appropriate AlexaFluor-conjugated secondary antibodies diluted 1:1000 (Invitrogen) were used at room temperature for 2.5 h.
For TH neuron quantification using unbiased stereological analysis, sections were obtained at 12 weeks post-transduction. Free-floating sections were stained as previously described (Harms et al., 2013), coded, and analyzed with an Olympus BX51 microscope and MicroBrightfield software. A total of eight sections covering the rostrocaudal extent of the SNpc, both ipsilateral and contralateral to the injection site, were quantified using the optical fractionator method and StereoInvestigator software. TH-positive neurons were counted and weighted section thickness was used to correct for variations in tissue thickness at varying sites.
Imaging and quantification.
Confocal images were captured using a Leica TCS-SP5 laser-scanning confocal microscope as described previously (Harms et al., 2013). Images were processed using the Leica LASAF software and exported and processed using Adobe Photoshop. For quantification of MHC Class II, IbaI, CD3, and GFAP staining, slides were observed using a Nikon Eclipse E800 M fluorescent microscope. Intensity of MHC Class II, IbaI, CD3, and GFAP staining was quantified using integrated mean fluorescence intensity (MFI; area of selected cells × mean fluorescence of selected cells) with a single observer blind to the treatment paradigm. Staining within the vicinity of viral transduction (GFP) was considered for scoring while staining immediately surrounding the needle tract was ignored. Scores obtained from three rats per group were plotted and levels of significance for multiple-comparisons were analyzed with one-way ANOVA method.
Immunoblotting.
Lysates of the ventral midbrain or cultured cells were homogenized on ice in 200 μl of RIPA lysis buffer. Thirty micrograms of cell lysate or midbrain homogenate was separated by electrophoresis and probed with antibodies as described previously (Qin et al., 2012). Abs against phospho-STAT1 (Tyr701), phospho-STAT3 (Tyr705), STAT1, and STAT3 used for immunoblotting were from Cell Signaling Technology. Ab against GAPDH is from Abcam.
Flow cytometry.
MHC Class II expression by cultured BMDM and microglia was analyzed with anti-MHC Class II Ab by flow cytometry, as described previously (Adamski and Benveniste, 2005). Mononuclear cells were isolated from the midbrains of AAV2-GFP or AAV2-α-SYN transduced rats at 4 weeks using a 30/70% Percoll gradient, and cell phenotype was determined by surface staining with antibodies for CD45, CD11b, MHC Class II, and CD4 by flow cytometry as described previously (Qin et al., 2012; Liu et al., 2015).
RNA isolation, RT-PCR, and TaqMan gene expression analysis.
Total RNA was isolated from the midbrain or cultured cells, and RT reactions performed as described previously (Qin et al., 2012). Five-hundred nanograms of RNA was used to reverse transcribe into cDNA and subjected to qRT-PCR. The data were analyzed using the comparative Ct method to obtain relative quantitation values.
RNA-Seq library construction, sequencing, and data analysis.
RNA samples from the ventral midbrain were subjected to paired-end Illumina mRNA sequencing (RNA-seq). Library preparation and sequencing was conducted using Data2Bio LLC (2079, Roy J. Carver CoLaboratory) as described previously (Wang et al., 2009; Huynh et al., 2014). Indexed libraries were prepared using the Illumina protocol outlined in the TruSeq RNA Sample Prep Guide. The library size and concentration were determined using an Agilent Bioanalyzer. Genes/transcripts were identified/aligned in the samples. The quality of samples indicated that the sample had the appropriate number of aligned reads to determine whether they were significant (p value <0.05). Significance was determined as a fold-change ≥4 tab plus p < 0.05.
Densitometric and statistical analysis.
Densitometric quantitation of immunoblotting images in the linear range was performed using an image analysis program (ImageJ 1.41o; National Institutes of Health). Histogram analysis with mean ± SD are presented for multiple experiments. Levels of significance for comparison between two groups was determined by the Mann–Whitney rank sum test when sample size is <5, otherwise, Student's t test was used. Quantification of images was analyzed with one-way ANOVA. A conservative Bonferroni method was used to control for false discovery with an overall type I error of 0.05 (p < 0.05) considered statistically significant. Statistical software SAS v 9.3 was used for analysis.
Results
α-SYN induces STAT activation and downstream gene expression, which is inhibited by AZD1480
To investigate the potential of α-SYN to activate the JAK/STAT pathway, murine BMDM were treated with medium or 500 nm of aggregated human α-SYN for up to 4 h, and immunoblotting was performed for STAT1 and STAT3 tyrosine phosphorylation. α-SYN treatment induced STAT1 and STAT3 phosphorylation in a time-dependent manner (Fig. 1A). Furthermore, α-SYN-induced STAT activation was inhibited by inclusion of the JAK1/2 inhibitor AZD1480 (Fig. 1B). We next examined whether α-SYN induced expression of classically identified STAT-inducible genes (Lee and Benveniste, 1996; Van Wagoner et al., 1998). The results shown in Figure 1C reveal that α-SYN induced the expression of iNOS, IL-6, TNF-α, MHC Class II, CIITA, and IRF-1 in BMDM. Expression of some of these genes, including iNOS, IL-6, TNF-α, and MHC Class II, is indicative of polarization of macrophages to the proinflammatory phenotype (Benveniste et al., 2014), suggesting that α-SYN may function as an inflammatory stimulus. MHC Class II protein expression was increased on the cell surface of BMDM after α-SYN treatment in a time-dependent manner (Fig. 1D), and similar results were obtained in primary microglia (Fig. 1E). Importantly, α-SYN-induced MHC Class II protein expression was strongly inhibited by AZD1480 treatment (Fig. 1F). These results collectively demonstrate that α-SYN induces activation of STAT1 and STAT3 and downstream gene expression in macrophages and microglia indicative of the proinflammatory phenotype, which is inhibited by AZD1480.
Figure 1.

Effect of α-SYN on STAT activation and gene expression. A, Murine BMDMs were stimulated with aggregated α-SYN (500 nm) for up to 4 h, and cell lysates subjected to immunoblotting with the indicated Abs. Fold-induction was calculated using ImageJ 1.41o, National Institutes of Health, by quantification of immunoblotting images normalized to GAPDH. The average fold-induction was calculated and statistical significance determined using Student's t test (n = 6). *p < 0.05, **p < 0.001. B, BMDMs were incubated in the absence or presence of AZD1480 (0.5 μm) for 2 h, stimulated with medium (UN) or aggregated α-SYN (500 nm) for 3 h, and cell lysates were subjected to immunoblotting with the indicated Abs. C, BMDMs were stimulated with UN or aggregated α-SYN (500 nm) for 4 and 8 h, and then mRNA expression was analyzed by qRT-PCR. Mean ± SD and significance determined by the Mann–Whitney rank sum test (n = 3). *p < 0.05, **p < 0.001. D, BMDMs were stimulated with aggregated α-SYN (500 nm) for up to 48 h, and then MHC class II expression was analyzed by flow cytometry. E, Primary microglia were stimulated with aggregated α-SYN (500 nm) for up to 48 h, and then MHC class II expression was analyzed by flow cytometry. F, BMDMs were treated with VH or AZD1480 (0.5 μm) for 2 h, stimulated with UN or aggregated α-SYN (500 nm) for 48 h, and then MHC class II expression was analyzed by flow cytometry. Representative of three independent experiments.
JAKinib attenuation of microglial and macrophage presence in vivo
Activation of both innate and adaptive immunity plays critical roles in the pathogenesis of PD (Hirsch et al., 2012; Mosley et al., 2012; Raj et al., 2014). Given the striking effect of AZD1480 in inhibiting α-SYN-induced STAT activation and downstream gene expression in microglia and macrophages in vitro, we assessed the therapeutic potential of AZD1480 in a α-SYN overexpression rat PD model. Initially, we first examined tolerability of rats to AZD1480. Daily administration of AZD1480 (10 mg/kg) by oral gavage for 2 weeks to naive rats had no significant effect on hematological parameters, such as white blood cell counts, percentage of neutrophils, lymphocytes, and monocytes, red blood cell counts and hemoglobin levels (data not shown), which is consistent with our previous findings in mice (Liu et al., 2014). These results demonstrate that AZD1480 treatment is well tolerated.
Previous studies demonstrated that overexpression of human full-length α-SYN via adeno-associated virus (AAV) in the SNpc of mice and rats results in reactive microgliosis, elevated expression of proinflammatory cytokines/chemokines and infiltration of T cells as early as 2 weeks post-transduction (Gorbatyuk et al., 2008; Theodore et al., 2008; Blesa et al., 2012; Harms et al., 2013). We examined the influence of AZD1480 treatment on neuroinflammatory parameters 4 weeks post-transduction. Eight- to 10-week-old male Sprague-Dawley rats received a unilateral stereotactic injection of recombinant AAV2-encoding human full-length α-SYN (AAV2-α-SYN) or AAV2-GFP control virus (4 × 10¹² viral genome/ml) into the right SNpc. AZD1480 (AZD) (10 mg/kg) or VH was administered daily by oral gavage 2 weeks after AAV2-α-SYN or AAV2-GFP post-transduction for a total of 14 d (Fig. 2A). Waiting 2 weeks to start treatment eliminated concerns regarding the effect of the initial injection. To study the inflammatory response in the SN, mononuclear cells were isolated and pooled from the midbrains of VH or AZD1480-treated AAV2-α-SYN or AAV2-GFP transduced rats (n = 4). We observed a substantial number of mononuclear cells in the midbrains of AAV2-α-SYN (SYN-VH) rats compared with rats with AAV2-GFP (GFP-VH) at 4 weeks post-transduction (Fig. 2B). AZD1480 treatment (SYN-AZD) caused a decrease in the number of cells compared with vehicle treated AAV2-α-SYN transduced rats (SYN-VH; Fig. 2B). There was also a reduction of mononuclear cells in AAV2-GFP rats with AZD1480 treatment (Fig. 2B). Flow cytometry analysis of pooled mononuclear cells indicated the majority of CD11b+ cells are microglia (CD45intCD11b+, 22.9%), with minimal macrophage presence (CD45hiCD11b+, 0.9%) in naive rats (Fig. 2C). An increased percentage of CD45intCD11b+ microglia and CD45hiCD11b+ macrophages were observed in AAV2-α-SYN compared with AAV2-GFP transduced rats (Fig. 2C,D,E). AZD1480 treatment resulted in a decrease in the percentage of microglia and macrophages in AAV2-α-SYN transduced rats, comparable to the baseline levels observed in naive rats (Fig. 2C,D,E). These results indicate that inhibition of the JAK/STAT pathway restricts microglial and macrophage presence in the SN.
Figure 2.

AZD1480 treatment decreases microglial and macrophage infiltration. A, VH or AZD1480 (10 mg/kg/d) was administered by oral gavage for 2 weeks to AAV2-GFP or AAV2-α-SYN transduced rats, 2 weeks post-transduction. B, Mononuclear cells were isolated from midbrains (n = 4) of VH or AZD1480-treated AAV2-GFP or AAV2-α-SYN transduced rats at 4 weeks. Quantitative graph for absolute numbers of total mononuclear cells in the midbrain. *p < 0.05. C, Mononuclear cells were isolated from midbrains (n = 4) of naive, VH, or AZD1480-treated AAV2-GFP or AAV2-α-SYN transduced rats at 4 weeks. The cells were gated on CD45 and CD11b. Representative flow cytometry plot of microglia (CD45intCD11b+) and macrophages (CD45hiCD11b+) is shown (n = 4 rats/group). D, Quantitative graph for percentage of microglia of total CD45+ cells in the midbrain. *p < 0.05, **p < 0.001. E, Quantitative graph for percentage of macrophages of total CD45+ cells in the midbrain. *p < 0.05. F, Iba1 (red)-expressing cells were measured in the SNpc (blue, TH+ neurons; green, AAV2-GFP or AAV2-α-SYN; 4 sections/sample, n = 3) using immunohistochemistry in VH or AZD1480-treated AAV2-GFP or AAV2-α-SYN transduced rats at 4 weeks. IbaI+ cells were zoomed from white boxes as shown. G, Quantification of Iba1 staining in the SNpc of AAV2-GFP and AAV2-α-SYN rats at 4 weeks. n = 3/group. Statistical significance was determined by the Mann–Whitney rank sum test in B, D, and E (n = 3), and one-way ANOVA with Bonferroni selected comparison post hoc test in G (n = 12). *p < 0.05, **p < 0.001.
JAK inhibition suppresses α-SYN-induced microglial activation in vivo
We next examined the influence of AZD1480 treatment on the activation of microglia. Ionized calcium binding adaptor molecule 1 (Iba1) was used as marker for activated microglia (Barkholt et al., 2012; Noelker et al., 2013). There was a significant increase in the intensity of Iba+ cells in AAV2-α-SYN rats at 4 weeks compared with AAV2-GFP rats, which was inhibited by treatment with AZD1480 (Fig. 2F,G). These results indicate that inhibition of JAK/STAT pathway restricts the activation of microglia in the SN. Next, the expression of MHC Class II, an activation marker of microglia and macrophages and also a STAT-driven gene (Lee and Benveniste, 1996), was determined by IHC (Fig. 3A). There was a significant increase in staining for MHC Class II in AAV2-α-SYN transduced rats compared with AAV2-GFP transduced rats (Fig. 3B). Most strikingly, AZD1480 treatment resulted in a significant reduction in the intensity of MHC Class II+-expressing cells compared with vehicle-treated AAV2-α-SYN transduced rats (Fig. 3B; SYN-VH vs SYN-AZD). Next, flow cytometry analysis was conducted to examine MHC Class II expression by CD45hiCD11b+ macrophages pooled from four rats. There was an enhancement in MHC Class II+ macrophages from AAV2-α-SYN transduced rats (23.4%) compared with AAV2-GFP transduced rats (14.9%), and AZD1480 treatment suppressed the percentage of MHC Class II+ macrophages (12.1%) compared with vehicle-treated AAV2-α-SYN transduced rats (Fig. 3C). To further examine the expression of activation markers of myeloid cells, mRNA levels of the proinflammatory markers TNF-α, iNOS, IL-6, and CCL2 were examined (Benveniste et al., 2014; Moehle, 2015). Mononuclear cells from the midbrains of AAV2-GFP or AAV2-α-SYN transduced rats were isolated, and mRNA expression examined by qTR-PCR. Elevated levels of TNF-α, iNOS, IL-6, and CCL2 mRNA expression were detected from mononuclear cells obtained from AAV2-α-SYN transduced rats, and expression was significantly suppressed by AZD1480 treatment (Fig. 3D). These results indicate that in vivo, α-SYN induces expression of proinflammatory markers, such as MHC Class II, TNF-α, iNOS, IL-6, and CCL2, in myeloid cells obtained from the midbrain, and JAKinib treatment inhibits the proinflammatory phenotype.
Figure 3.

JAK/STAT inhibition reduces MHC Class II+ cells and proinflammatory marker expression. A, MHC Class II (red)-expressing cells were measured in the SNpc using immunohistochemistry in VH or AZD1480 (10 mg/kg/d)-treated AAV2-GFP or AAV2-α-SYN transduced rats at 4 weeks. B, Quantification of MHC Class II staining in the SNpc of AAV2-GFP and AAV2-α-SYN rats at 4 weeks (4 sections/sample, n = 3/group). C, Mononuclear cells were isolated and pooled from the midbrain of VH or AZD1480-treated AAV2-GFP or AAV2-α-SYN transduced rats at 4 weeks, and subjected to staining for the surface markers CD45, CD11b, and MHC Class II. The cells were gated on CD45 and CD11b, then MHC Class II. Representative flow cytometry plot of MHC Class II expression in macrophages (CD45hiCD11b+) is shown (n = 4/group). The quantitative graph for MFI of macrophages in the midbrains was calculated. D, RNA extracted from mononuclear cells isolated and pooled from the midbrain of naive, VH or AZD1480-treated AAV2-GFP or AAV2-α-SYN transduced rats was subjected to RT-qPCR. Expression of proinflammatory markers, including TNF-α, iNOS, IL-6, and CCL2 was analyzed (n = 4/group). Statistical significance was determined by one-way ANOVA with Bonferroni selected comparison post hoc test in B (n = 12), and Mann–Whitney rank sum test in C and D (n = 4). *p < 0.05, **p < 0.001.
Inhibition of the JAK/STAT pathway reduces infiltration of T cells in vivo
Chronic inflammatory responses increase blood–brain barrier permeability in PD, which contributes to increased T-cell ingress (Brochard et al., 2009; Mosley et al., 2012). As such, we examined T-cell infiltration in rats with AAV2-α-SYN overexpression. Our results indicate a significant enhancement of CD3+ T-cell infiltration in the SN of AAV2-α-SYN transduced rats, with perivascular localization (Fig. 4A,B; GFP-VH vs SYN-VH). AZD1480 treatment caused a significant reduction in recruitment of CD3+ T cells (Fig. 4A,B; SYN-VH vs SYN-AZD). To determine the type(s) of T-cell infiltrating the SN, flow cytometry was performed for CD4+ and CD8+ T cells. CD4+ T-cell infiltration was enhanced in the midbrain of AAV2-α-SYN transduced rats, and AZD1480 treatment resulted in a reduction in CD4+ T cells (Fig. 4C). Minimal CD8+ T-cell infiltration was detected (data not shown). These results demonstrate the presence of CD4+ T helper cells in the AAV2-α-SYN PD model, and that JAKinib treatment reduces infiltration. GFAP expression was assessed as a measure of astrogliosis. No significant changes were detected, indicating that α-SYN transduction did not influence the activation of astrocytes, nor did inhibition of the JAK/STAT pathway (Fig. 5).
Figure 4.

AZD1480 treatment inhibits the infiltration of CD3+ and CD4+ T cells. A, VH or AZD1480 (10 mg/kg/d) was administered by oral gavage for 2 weeks to AAV2-GFP or AAV2-α-SYN transduced rats, 2 weeks post-transduction. CD3 (red)-expressing cells were measured in the SNpc using immunohistochemistry at 4 weeks. B, Quantification of CD3 staining in the SNpc of AAV2-GFP and AAV2-α-SYN rats at 4 weeks (4 sections/sample, n = 3/group). C, Mononuclear cells were isolated from the midbrain of VH or AZD1480-treated AAV2-GFP or AAV2-α-SYN transduced rats at 4 weeks were subjected to staining for the surface markers CD45 and CD4. The cells were first gated on CD45, and then gated on CD4. Quantitative graph for infiltrating CD4+ T cells is shown (n = 4/group). Statistical significance was determined by one-way ANOVA with Bonferroni selected comparison post hoc test in B (n = 12), and Mann–Whitney rank sum test in C (n = 4). *p < 0.05, **p < 0.001.
Figure 5.

AZD1480 treatment does not influence GFAP expression in vivo. A, VH or AZD1480 (10 mg/kg/d) was administered by oral gavage for 2 weeks to AAV2-GFP or AAV2-α-SYN transduced rats, 2 weeks post-transduction. GFAP (red)-expressing cells were measured in the SNpc using immunohistochemistry at 4 weeks. B, Quantification of GFAP staining in the SNpc of AAV2-GFP and AAV2-α-SYN rats at 4 weeks (4 sections/sample, n = 3/group). Mean ± SD of MFI. Statistical significance was determined by one-way ANOVA with Bonferroni selected comparison post hoc test in (n = 12).
JAKinib treatment inhibits AAV2-α-SYN-induced STAT activation and STAT-induced gene expression in vivo
We next examined whether AZD1480 treatment had inhibitory effects on STAT activation and inflammatory gene expression in vivo. AAV2-α-SYN enhanced tyrosine phosphorylation of STAT3 in the midbrain (Fig. 6A, lanes 4–6) compared with normal tissue control (Fig. 6A, lane 1) and AAV-GFP transduced midbrain (Fig. 6A, lanes 2 and 3). In vivo treatment with AZD1480 for 2 weeks inhibited α-SYN-induced STAT3 activation (Fig. 6A, lanes 8 and 9). MHC Class II expression depends on the induction of CIITA, an essential transactivator of MHC Class II expression, and both CIITA and MHC Class II are STAT-inducible genes (Nikcevich et al., 1999; Dong and Benveniste, 2001). The levels of CIITA and MHC Class II mRNA were significantly enhanced with AAV2-α-SYN transduction, and markedly decreased by AZD1480 treatment (Fig. 6B).
Figure 6.

AZD1480 inhibits AVV2-α-SYN-induced STAT activation and CIITA and MHC Class II mRNA expression in vivo. A, VH or AZD1480 (10 mg/kg/d) was administered by oral gavage for 2 weeks to AAV2-GFP or AAV2-α-SYN transduced rats 2 weeks post-transduction. Lysates from midbrains obtained from nontransduced control rat (NC) or AAV2-GFP or AAV2-α-SYN rats at 4 weeks were subjected to immunoblotting with the indicated Abs. Fold-induction was calculated using ImageJ 1.41o, National Institutes of Health, by quantification of immunoblotting images normalized to GAPDH. The fold-induction was calculated from two separate experiments. B, RNA extracted from midbrains obtained from nontransduced control rat (NC) or AAV2-GFP or AAV2-α-SYN rats at 4 weeks was analyzed by qRT-PCR for CIITA and MHC Class II mRNA expression. Mean ± SD. Statistical significance was determined by Mann–Whitney rank sum test (n = 3). *p < 0.05, **p < 0.001.
Identification of α-SYN-regulated genes in vivo
To further assess how α-SYN-induced activation of the JAK/STAT pathway modulates gene expression in an unbiased manner, RNA-Seq analysis was performed. We found that 186 genes (purple) were significantly upregulated (>4-fold) in the midbrain of AAV2-α-SYN rats compared with AAV2-GFP rats (Fig. 7A,B). The top five diseases and disorders related to these upregulated genes are neurological disease, skeletal and muscular disorders, hereditary disorder, psychological disorders, and endocrine system disorders (Fig. 7C). The α-SYN upregulated genes are linked to five canonical pathways, including antigen presentation pathway, Ca2+-induced T-lymphocyte apoptosis, B-cell development, type I diabetes mellitus signaling and graft-versus-host disease signaling (Fig. 7C). Many of the genes identified are IFN-inducible genes, and are regulated by activation of JAK-STAT pathway (Hu and Ivashkiv, 2009; Ivashkiv and Donlin, 2014). As shown in Figure 7C, the top upstream regulators are IFNAR, STAT1, IFNB1, IRF7, and TRIM24. A number of genes related to cell-to-cell signaling and interaction, nervous system development and function and behavior, and inflammation are upregulated by α-SYN overexpression (Table 1). Furthermore, α-SYN overexpression also induced expression of Ccl2, Ccl12, Cxcl9, Cxcl10, Cxcl11, Cxcl13, Cxcl17, Irf1, Irf7, Isg15, and Mx1, which are inflammatory mediators (Table 1). These data indicate that α-SYN induces expression of numerous genes implicated in cell signaling, inflammatory, and neurological diseases and antigen presentation. The effect of AZD1480 treatment on AAV2-α-SYN-induced gene expression was evaluated. As shown in Figure 7, A and B, AZD1480 treatment inhibited the expression levels of 59 genes compared with vehicle control treatment (α-SYN-AZD1480 vs α-SYN-VH). Importantly, the majority of genes inhibited by AZD1480 were those induced by AAV2-α-SYN overexpression, including Cd74, RT1-Da, RT1-Db1, Icam5, and RT1-Ba (Fig. 7A,B; Table 2), which suggests that the inhibitory effect of AZD1480 has high specificity in suppressing genes that use the JAK/STAT signaling pathway for expression. In addition, AZD1480 treatment inhibited genes related to neuroinflammation, including C1q, Ccl12, and Rgs14 (Fig. 7B; Table 2).
Figure 7.
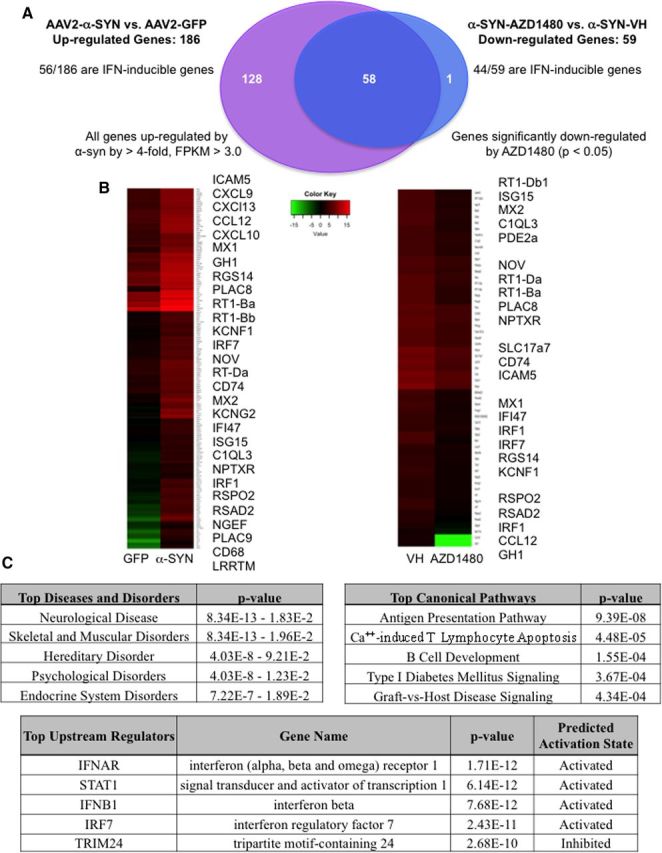
AZD1480 treatment inhibits α-SYN-induced JAK-STAT pathway related gene expression in vivo. A, VH or AZD1480 (10 mg/kg/d) was administered by oral gavage for 2 weeks to AAV2-GFP or AAV2-α-SYN transduced rats, 2 weeks post-transduction. Rats were perfused at 4 weeks, the SN removed, and mRNA was analyzed by RNA-Seq. Samples were aligned to the rat reference genome, fold-change and p values were calculated between AAV2-α-SYN-VH versus AAV2-GFP-VH or AAV2-α-SYN-VH versus AAV2-α-SYN-AZD1480 rats. Significance is defined by p < 0.05. B, Heat maps of RNA-Seq data on α-SYN-induced genes comparing AAV2-GFP and AAV2-α-SYN or AAV2-α-SYN-VH and AAV2-α-SYN-AZD1480 rats. Significance is defined as p < 0.05. C, Ingenuity pathways analysis of RNA-Seq data with genes having a fold-change >4 and p < 0.05. Top diseases and disorders, top canonical pathways and top upstream regulators are shown.
Table 1.
α-SYN-induced gene profiles
| Gene symbol | α-Syn-induced genes | Fold-induction |
|---|---|---|
| Foxg1 | Forkhead box G1 | 430.57 |
| Kcnh3 | Potassium voltage-gated channel, subfamily H-3 | 200.81 |
| Ddn | Dendrin | 178.14 |
| Ubd | Ubiquitin D | 174.00 |
| Lhx6 | LIM homeobox 6 | 150.28 |
| Scin | Scinderin | 116.38 |
| Arx | Aristaless-related homeobox | 85.51 |
| Dlx1 | Distal-less homeobox 1 | 83.26 |
| Itpka | Inositol-trisphosphate 3-kinase A | 73.78 |
| Dio3 | Deiodinase, iodothyronine, type III | 72.22 |
| Tbr1 | T-box, brain, 1 | 66.31 |
| Dapl1 | Death-associated protein-like 1 | 63.16 |
| Icam5 | Intercellular adhesion molecule 5, telencephalin | 51.05 |
| Cxcl9 | Chemokine (C-X-C motif) ligand 9 | 49.38 |
| Cxcl13 | Chemokine (C-X-C motif) ligand 13 | 43.49 |
| Ccl12 | Chemokine (C-X-C motif) ligand 12 | 43.03 |
| Cxcl10 | Chemokine (C-X-C motif) ligand 10 | 40.21 |
| Rprm | Reprimo-like | 38.46 |
| Crym | Crystallin, mu | 37.59 |
| Kcnj4 | Potassium inwardly-rectifying channel, subfamily J-4 | 36.95 |
| Egr3 | Early growth response 3 | 36.38 |
| Camk2a | Calcium/calmodulin-dependent protein kinase II alpha | 34.27 |
| Egr4 | Early growth response 4 | 32.64 |
| Mx1 | MX dynamin-like GTPase 1 | 27.98 |
| Fcnb | Ficolin B | 27.89 |
| Gh1 | Growth hormone 1 | 27.58 |
| Hdc | Histidine decarboxylase | 26.15 |
| Slfn3 | Schlafen 3 | 25.58 |
| Cxcl11 | Chemokine (C-X-C motif) ligand 11 | 22.46 |
| Lhx2 | LIM homeobox 2 | 22.31 |
| Chrm1 | Cholinergic receptor, muscarinic 1 | 22.19 |
| Rgs14 | Regulator of G-protein signaling 14 | 21.14 |
| Gda | Guanine deaminase | 21.12 |
| Ccl2 | Chemokine (C-C motif) ligand 2 | 20.62 |
| Mas1 | MAS1 proto-oncogene, G protein-coupled receptor | 19.65 |
| Cxcl17 | Chemokine (C-X-C motif) ligand 17 | 18.51 |
| Nrl | Neural retina leucine zipper | 18.42 |
| Tac2 | Tachykinin 3 | 18.42 |
| Rasal1 | RAS protein activator-like 1 (GAP1-like) | 17.69 |
| Ttr | Transthyretin | 17.59 |
| Rtn4rl2 | Reticulon 4 receptor-like 2 | 17.23 |
| Nrgn | Neurogranin (protein kinase C substrate, RC3) | 14.36 |
| Traip | TRAF interacting protein | 14.09 |
| Plac8 | Placenta-specific 8 | 14.06 |
| Adra1d | Adrenoceptor alpha 1D | 13.69 |
| Lrrc10b | Leucine rich repeat-containing 10B | 13.25 |
| RT1-Ba | RT1 class II, locus Ba | 12.83 |
| Neurod1 | Neuronal differentiation 1 | 12.40 |
| Gbp2 | Guanylate-binding protein 2, interferon-inducible | 12.32 |
| Fam107a | Family with sequence similarity 107, member A | 11.97 |
| Irf7 | Interferon regulatory factor 7 | 11.47 |
| RT1-Bb | RT1 class II, locus Bb | 11.43 |
| Fam150b | Family with sequence similarity 150, member B | 11.38 |
| Oasl | 2′-5′-Oligoadenylate synthetase-like | 11.33 |
| Gpr114 | G-protein-coupled receptor 114 | 11.28 |
| RT1-Db1 | RT1 class II, locus Db1 | 11.05 |
| Ptk2b | Protein tyrosine kinase 2 beta | 11.00 |
| Ptprcap | Protein tyrosine phosphatase, receptor type, C-protein | 11.00 |
| Rsad2 | Radical S-adenosyl methionine domain-containing 2 | 10.90 |
| Bhlhe22 | Basic helix-loop-helix family, member e22 | 10.89 |
| Nr4a3 | Nuclear receptor subfamily 4, group A, member 3 | 10.59 |
| Kcnf1 | Potassium voltage-gated channel, subfamily F, member 1 | 9.98 |
| Wipf3 | WAS/WASL interacting protein family, member 3 | 9.86 |
| Nr2e1 | Nuclear receptor subfamily 2, group E, member 1 | 9.69 |
| Kcng1 | Potassium voltage-gated channel, subfamily G, member 1 | 9.67 |
| Nov | Nephroblastoma overexpressed | 9.62 |
| Neurod2 | Neuronal differentiation 2 | 9.55 |
| RT1-Da | RT1 class II, locus Da | 9.52 |
| Cd74 | MHC, class II invariant chain | 9.34 |
| Bcl11b | B-cell CLL/lymphoma 11B (zinc finger protein) | 8.94 |
| Mx2 | MX dynamin-like GTPase 2 | 8.75 |
| Kcnn4 | Potassium/calcium-activated channel, subfamily N-4 | 8.39 |
| Ankrd33b | Ankyrin repeat domain 33B | 8.36 |
| Psmb9 | Proteasome (prosome, macropain) subunit, beta type, 9 | 8.29 |
| Igfbp4 | Insulin-like growth factor-binding protein 4 | 8.22 |
| Kcng2 | Potassium voltage-gated channel, subfamily G, member 2 | 8.01 |
| Psd | Pleckstrin and Sec7 domain-containing | 7.80 |
| Wnt4 | Wingless-type MMTV integration site family, member 4 | 7.50 |
| RT1-M6-2 | RT1 class I, locus M6, gene 2 | 7.49 |
| Neurl1B | Neuralized E3 ubiquitin protein ligase 1B | 7.36 |
| Nhlh1 | Nescient helix loop helix 1 | 7.34 |
| Hsh2d | Hematopoietic SH2 domain-containing | 7.30 |
| Car12 | Carbonic anyhydrase 12 | 7.25 |
| Ifi47 | Interferon gamma-inducible protein 47 | 7.22 |
| Gldc | Glycine dehydrogenase (decarboxylating) | 7.09 |
| Isg15 | ISG15 ubiquitin-like modifier | 7.08 |
| Pter | Phosphotriesterase-related | 7.07 |
| Baiap2 | BAI1-associated protein 2 | 7.04 |
| Gabrd | GABA A receptor, delta | 7.03 |
| Prkcg | Protein kinase C, gamma | 7.03 |
| Camkv | CaM kinase-like vesicle-associated | 7.01 |
| Wfs1 | Wolfram syndrome 1 (wolframin) | 6.93 |
| Cck | Cholecystokinin | 6.79 |
| Cplx3 | Complexin 3 | 6.79 |
| Gas7 | Growth arrest-specific 7 | 6.70 |
| RT1-T24-3 | RT1 class I, locus T24, gene 3 | 6.69 |
| Arpp21 | cAMP-regulated phosphoprotein, 21kDa | 6.67 |
| Neurod6 | Neuronal differentiation 6 | 6.58 |
| Hpca | Hippocalcin | 6.55 |
| Slc17a7 | Solute carrier family 17 (vesicular glutamate transporter), member 7 | 6.54 |
| Kcnmb4 | Potassium large conductance calcium-activated channel, M-beta −4 | 6.42 |
| Rnf39 | Ring finger protein 39 | 6.40 |
| Nptxr | Neuronal pentraxin receptor | 6.26 |
| Cnksr2 | Connector enhancer of kinase suppressor of Ras 2 | 6.18 |
| Slamf9 | SLAM family member 9 | 6.17 |
| Fam81a | Family with sequence similarity 81, member A | 6.15 |
| Rab40b | RAB40B, member RAS oncogene family | 6.12 |
| Cnih3 | Cornichon family AMPA receptor auxiliary protein 3 | 6.08 |
| Kalrn | Kalirin, RhoGEF kinase | 5.94 |
| Mir221 | MicroRNA 221 | 5.83 |
| Bst2 | Bone marrow stromal cell antigen 2 | 5.79 |
| Irf1 | Interferon regulatory factor 1 | 5.78 |
| C1ql3 | Complement component 1, q subcomponent-like 3 | 5.74 |
| Oaf | OAF homolog (Drosophila) | 5.72 |
| Tap1 | Transporter 1, ATP-binding cassette, subfamily B (MDR/TAP) | 5.72 |
| Agap2 | ArfGAP with GTPase domain, ankyrin repeat and PH domain 2 | 5.69 |
| Usp18 | Ubiquitin-specific peptidase 18 | 5.67 |
| Ntf3 | Neurotrophin 3 | 5.66 |
| Spata2L | Spermatogenesis-associated 2-like | 5.62 |
| Pkp2 | Plakophilin 2 | 5.61 |
| Nelf | Nasal embryonic LHRH factor | 5.60 |
| Oas1a | 2′-5′ Oligoadenylate synthetase 1A | 5.60 |
| Ifi27l2b | Interferon, alpha-inducible protein 27-like 2B | 5.56 |
| Rspo2 | R-spondin 2 | 5.54 |
| Gbp5 | Guanylate-binding protein 5 | 5.54 |
| Enc1 | Ectodermal-neural cortex 1 (with BTB domain) | 5.50 |
| Rtn4rl1 | Reticulon 4 receptor-like 1 | 5.43 |
| Lmo7 | LIM domain 7 | 5.43 |
| Celf5 | CUGBP, Elav-like family member 5 | 5.37 |
| Mical2 | Microtubule-associated monooxygenase, calponin, and LIM −2 | 5.37 |
| Nptx2 | Neuronal pentraxin II | 5.36 |
| Pde2a | Phosphodiesterase 2A, cGMP-stimulated | 5.36 |
| Prss12 | Protease, serine, 12 (neurotrypsin, motopsin) | 5.33 |
| Cacng8 | Calcium channel, voltage-dependent, gamma subunit 8 | 5.33 |
| Camk2n1 | Calcium/calmodulin-dependent protein kinase II inhibitor 1 | 5.33 |
| Ctxn1 | Cortexin 1 | 5.32 |
| Fcgr3a | Fc fragment of IgG, low affinity IIIa, receptor (CD16a) | 5.32 |
| Lcn2 | Lipocalin 2 | 5.31 |
| Plac9 | Placenta-specific 9 | 5.15 |
| Junb | Jun B proto-oncogene | 5.11 |
| Cd68 | CD68 molecule | 5.09 |
| Igtp | Interferon gamma induced GTPase | 5.07 |
| Hrk | Harakiri, BCL2 interacting protein | 5.07 |
| Kcnv1 | Potassium channel, subfamily V, member 1 | 5.02 |
| Tfb1m | Transcription factor B1, mitochondrial | 4.97 |
| Klf16 | Kruppel-like factor 16 | 4.87 |
| Msx1 | Msh homeobox 1 | 4.85 |
| Rgs16 | Regulator of G-protein signaling 16 | 4.80 |
| Cebpb | CCAAT/enhancer-binding protein (C/EBP), beta | 4.78 |
| Nptx1 | Neuronal pentraxin I | 4.78 |
| Actr3b | ARP3 actin-related protein 3 homolog B (yeast) | 4.75 |
| Hpcal4 | Hippocalcin-like 4 | 4.72 |
| Cnih2 | Cornichon family AMPA receptor auxiliary protein 2 | 4.71 |
| Ptgs2 | Prostaglandin-endoperoxide synthase 2 | 4.64 |
| Prr7 | Proline rich 7 (synaptic) | 4.62 |
| Kcnip3 | Kv channel interacting protein 3, calsenilin | 4.56 |
| Oas1b | 2–5 Oligoadenylate synthetase 1B | 4.53 |
| Myo5b | Myosin VB | 4.52 |
| Chrm4 | Cholinergic receptor, muscarinic 4 | 4.48 |
| Mpped1 | Metallophosphoesterase domain-containing 1 | 4.46 |
| Stx1a | Syntaxin 1A (brain) | 4.45 |
| Serinc2 | Serine incorporator 2 | 4.44 |
| Mei1 | Meiosis inhibitor 1 | 4.43 |
| Ipcef1 | Interaction protein for cytohesin exchange factors 1 | 4.36 |
| Msln | Mesothelin | 4.34 |
| Rtn4r | Reticulon 4 receptor | 4.28 |
| Siat7E | Alpha-2,6-sialyltransferase ST6GalNAc V | 4.28 |
| Apol9a | Apolipoprotein L 9a | 4.28 |
| Mir132 | MicroRNA 132 | 4.27 |
| Hes5 | hes Family bHLH transcription factor 5 | 4.25 |
| Cd300a | CD300a molecule | 4.23 |
| Alb | Albumin | 4.23 |
| Gna14 | Guanine nucleotide-binding protein (G-protein), alpha 14 | 4.17 |
| Ngef | Neuronal guanine nucleotide exchange factor | 4.17 |
| Sstr4 | Somatostatin receptor 4 | 4.17 |
| Bcl3 | B-cell CLL/lymphoma 3 | 4.15 |
| Akap5 | A kinase (PRKA) anchor protein 5 | 4.14 |
| RGD1309362 | Similar to interferon-inducible GTPase | 4.13 |
| Synpo | Synaptopodin | 4.13 |
| Fbxl16 | F-box and leucine-rich repeat protein 16 | 4.09 |
| LRRTM1 | Leucine rich repeat transmembrane neuronal 1 | 4.09 |
| Cldn1 | Claudin 1 | 4.07 |
| Syngap1 | Synaptic Ras GTPase activating protein 1 | 4.07 |
| Olfm1 | Olfactomedin 1 | 4.02 |
| Dgkg | Diacylglycerol kinase, gamma 90kDa | .02 |
Table 2.
α-SYN-induced genes inhibited by AZD1480 treatment
| Gene symbol | α-syn-induced genes inhibited by AZD1480 | Fold-inhibition by AZD1480 |
|---|---|---|
| Baiap2 | BAI1-associated protein 2 | −3.854382632 |
| Bcl11b | B-cell CLL/lymphoma 11B (zinc finger protein) | −8.820284104 |
| Bhlhe22 | Basic helix-loop-helix family, member e22 | −7.444158612 |
| Bst2 | Bone marrow stromal cell antigen 2 | −6.366662442 |
| C1ql3 | Complement component 1, q subcomponent-like 3 | −3.831752007 |
| Camkv | CaM kinase-like vesicle-associated | −3.419097126 |
| Car12 | Carbonic anyhydrase 12 | −5.54167958 |
| Cck | Cholecystokinin | −3.912513386 |
| Ccl12 | Chemokine (C-C motif) ligand 12 | ↓∞ |
| Cd74 | MHC, class II invariant chain | −6.550271138 |
| Cnih2 | Cornichon family AMPA receptor auxiliary protein 2 | −3.100940815 |
| Ctxn1 | Cortexin 1 | −3.812191038 |
| Ddn | Dendrin | −6.205829962 |
| Dgkg | Diacylglycerol kinase, gamma 90kDa | −3.160449907 |
| Fam107a | Family with sequence similarity 107, member A | −4.075260389 |
| Fam81a | Family with sequence similarity 81, member A | −3.76793883 |
| Foxg1 | Forkhead box G1 | −8.102480701 |
| Gbp2 | Guanylate-binding protein 2, interferon-inducible | −17.29905594 |
| Gbp5 | Guanylate-binding protein 5 | −8.40818098 |
| Gda | Guanine deaminase | −7.879778727 |
| Gh1 | Growth hormone 1 | ↓∞ |
| Gldc | Glycine dehydrogenase (decarboxylating) | −4.44054062 |
| Hpca | Hippocalcin | −4.144642462 |
| Hpcal4 | Hippocalcin-like 4 | −3.161625627 |
| Icam5 | Intercellular adhesion molecule 5, telencephalin | −8.331231339 |
| Ifi47 | Interferon gamma-inducible protein 47 | −6.749002048 |
| Irf1 | Interferon regulatory factor 1 | −4.850550763 |
| Irf7 | Interferon regulatory factor 7 | −12.59144632 |
| Isg15 | ISG15 ubiquitin-like modifier | −8.604859569 |
| Itpka | Inositol-trisphosphate 3-kinase A | −7.525781237 |
| Kcnf1 | Potassium voltage-gated channel, subfamily F, member 1 | −5.261805699 |
| Kcng1 | Potassium voltage-gated channel, subfamily G-1 | −8.695616806 |
| Lhx2 | LIM homeobox 2 | −4.954167082 |
| Lmo7 | LIM domain 7 | −4.054767572 |
| Mx1 | MX dynamin-like GTPase 1 | −22.29240417 |
| Mx2 | MX dynamin-like GTPase 2 | −11.85445964 |
| Myo5b | Myosin VB | −3.509043723 |
| Neurod6 | Neuronal differentiation 6 | −4.460150407 |
| Nov | Nephroblastoma overexpressed | −5.724660432 |
| Nptx1 | Neuronal pentraxin I | −3.67427231 |
| Nptxr | Neuronal pentraxin receptor | −4.147045876 |
| Nrgn | Neurogranin (protein kinase C substrate, RC3) | −8.927721134 |
| Pde2a | Phosphodiesterase 2A, cGMP-stimulated | −2.973736448 |
| Plac8 | Placenta-specific 8 | −12.49909557 |
| Prkcg | Protein kinase C, gamma | −3.84752755 |
| Psd | Pleckstrin and Sec7 domain-containing | −3.296678914 |
| Psmb9 | Proteasome (prosome, macropain) subunit, beta type, 9 | −6.660792566 |
| Ptk2b | Protein tyrosine kinase 2 beta | −5.759529543 |
| RGD1309362 | Similar to interferon-inducible GTPase | −5.015647867 |
| Rgs14 | Regulator of G-protein signaling 14 | −9.177386467 |
| Rprml | Reprimo-like | −10.39501873 |
| Rsad2 | Radical S-adenosyl methionine domain-containing 2 | −7.817610063 |
| Rspo2 | R-spondin 2 | −5.951261779 |
| RT1-Ba | RT1 class II, locus Ba | −8.856690851 |
| RT1-Da | RT1 class II, locus Da | −7.605533948 |
| RT1-Db1 | RT1 class II, locus Db1 | −8.10093098 |
| Slc17a7 | Solute carrier family 17, member 7 | −3.58808134 |
| Tbr1 | T-box, brain, 1 | −5.30611727 |
| Wipf3 | WAS/WASL interacting protein family, member 3 | −6.442651726 |
JAKinib treatment attenuates AAV2-α-SYN-induced neurodegeneration in vivo
To determine whether AZD1480 treatment modifies the neurodegenerative process, AAV2-GFP and AAV2-α-SYN transduced rats were treated with VH or AZD1480 (AZD; 5 mg/kg) at 4 weeks post-transduction for a total of 4 weeks, then allowed to recover for 4 weeks (Fig. 8A). The time point of 4 weeks to start AZD1480 treatment was chosen because this is the peak of the inflammatory response. Five milligrams/kg was used for the 4 week treatment, per discussion with AstraZeneca. Three months post-transduction, nigral neuron number was evaluated by staining for TH and unbiased stereology. In the rat AAV2-α-SYN model, there is a ∼40–50% loss of TH-immunopositive cells at 3 months post-transduction (Recchia et al., 2008; Sanchez-Guajardo et al., 2013; Van der Perren et al., 2015). We observed that overexpression of α-SYN induced ∼50% dopaminergic cell loss at 3 months (Fig. 8B,C), and that AZD1480 treatment attenuated α-SYN-induced dopaminergic cell loss (Fig. 8B,C). These results collectively demonstrate the efficacy of JAKinibs in the protection of DA neurodegeneration.
Figure 8.

Protective effect of AZD1480 on the loss of TH+ neurons in the SN. A, VH or AZD1480 (5 mg/kg/d) was administered by oral gavage for 4 weeks to AAV2-GFP or AAV2-α-SYN transduced rats 4 weeks post-transduction. Four weeks after treatment, the rats were rested for an additional 4 weeks, then euthanized at 12 weeks. B, The rats were perfused at 12 weeks, SN removed, and free-floating sections were stained for TH neurons using unbiased stereological analysis. Representative images of the ipsilateral SNpc stained for TH. C, Quantification of TH+ neurons was performed; neuron loss is reported as a percentage of the contralateral side (8 sections/sample, n = 5/group). One-way ANOVA with Bonferroni selected comparison post hoc test (n = 40). *p < 0.05.
Discussion
Aberrant activation of the JAK/STAT pathway contributes to a number of autoimmune and neuroinflammatory diseases (O'Shea et al., 2015; Villarino et al., 2015). In this study, we demonstrate that the JAK/STAT pathway becomes activated in a model of PD induced by overexpression of α-SYN, and that suppression of this pathway upon treatment with AZD1480 inhibits neuroinflammatory responses and neurodegeneration in vivo. The inhibitory effect on neuroinflammation is due, in part, to: (1) suppression of STAT3 activation, (2) inhibition of microglial activation, (3) prevention of macrophage and CD4+ T-cell infiltration, and (4) suppression of α-SYN-induced inflammatory gene expression. Myeloid cells (monocytes, macrophages, and microglia) are considered to be important contributors to the pathogenesis of PD (Moehle, 2015; Allen Reish and Standaert, 2015). Circulating blood monocytes from young, healthy individuals have very high expression of PD-associated genes, including α-SYN and LRRK2, suggesting the inflammatory component of PD susceptibility is strongly influenced by myeloid cells (Raj et al., 2014). Monocytes from PD patients express high levels of MHC Class II and CCR2 on their cell surface, and secrete CCL2, indicating a proinflammatory phenotype (Funk et al., 2013; Grozdanov et al., 2014). Proinflammatory macrophages and microglia have detrimental effects in a number of neurologic diseases, including multiple sclerosis (MS), Alzheimer's disease, ALS, and spinal cord injury (Kigerl et al., 2009; Appel et al., 2010; Hawthorne and Popovich, 2011; Kannarkat et al., 2013; Benveniste et al., 2014; Frakes et al., 2014; Moehle, 2015). In addition, inflammatory myeloid cells participate in the induction of CD4+ Th1 and Th17 responses (Krausgruber et al., 2011), which serve as effector T cells in diseases, such as PD and MS (Brochard et al., 2009; Reynolds et al., 2010; Saunders et al., 2012; Romero-Ramos et al., 2014; Dendrou et al., 2015; Olson et al., 2015). Our in vitro results indicate that α-SYN induces activation of the JAK/STAT pathway and expression of genes reflective of the proinflammatory phenotype, including MHC Class II, iNOS, IL-6, and TNF-α in macrophages and microglia. Inhibition of the JAK/STAT pathway suppressed STAT activation and downstream gene expression in these myeloid cells. These findings also reflected what we observed in the in vivo setting; α-SYN overexpression enhanced STAT3 activation in the SNpc and expression of MHC Class II, iNOS, CCL2, and TNF-α by myeloid cells isolated from the midbrain. JAK/STAT pathway inhibition suppressed α-SYN-induced STAT activation and expression of proinflammatory phenotypic genes in vivo. Suppression of the JAK/STAT pathway did not result in a switch of the proinflammatory phenotype to the anti-inflammatory M2 phenotype, as M2-related genes, such as IL-10 and Arg1, were not altered (data not shown). It is important to stress that proinflammatory and anti-inflammatory phenotypes do not necessarily exclude each other and often coexist (Martinez and Gordon, 2014). Further, there are many examples of myeloid cells with a mixed proinflammatory/anti-inflammatory phenotype, which result from the balance of regulators present in the tissue microenvironment (Sanchez-Guajardo et al., 2015; Tang and Le, 2016). Even with this caveat, a variety of PD animal models implicate proinflammatory myeloid cell activation as a prominent feature of disease, and as an insult that drives dopaminergic cell loss (Appel et al., 2010; Barkholt et al., 2012; Moehle et al., 2012; Moehle, 2015). As such, our findings that suppression of JAK/STAT signaling dampens innate immune responses in the midbrain by suppressing the proinflammatory phenotype may be a major mechanism for the ultimate beneficial effect on neurodegeneration.
In vivo studies document that the adaptive immune response is also important for PD pathogenesis (Brochard et al., 2009; Reynolds et al., 2010; Saunders et al., 2012; Romero-Ramos et al., 2014; Olson et al., 2015). CD4+ and CD8+ T cells are detected in PD mouse models and PD postmortem human brain tissue, and altered CD4+ T-cell phenotypes in the periphery are also a feature of PD. In the α-SYN overexpression PD model, we detected significant infiltration of CD3+ T cells, the majority of which were CD4+ T helper cells. Treatment with AZD1480 reduced the number of CD4+ T cells infiltrating into the midbrain, which may contribute to the dampened neuroinflammatory response observed in this model. In the MPTP model of PD, CD4+ T-effector cells, likely Th1 and Th17 cells, contribute to disease pathogenesis, while CD4+, CD25+ T regulatory cells provide protection via immunosuppressive mechanisms (Reynolds et al., 2010; Olson et al., 2015). We have previously demonstrated that AZD1480 can inhibit the polarization of T cells to the Th1 and Th17 phenotypes in animal models of MS (Liu et al., 2014). This will need to be further evaluated in the α-SYN overexpression PD model to determine whether AZD1480 influences the CD4+ T-cell phenotype and/or function. This is technically challenging at present because of the low numbers of infiltrating T cells, but may be addressed by single-cell RNA sequencing.
IFN-γ and IL-6 are two of the most potent activators of the JAK/STAT pathway, and are elevated in PD (Mount et al., 2007; Chen et al., 2008; Sherer, 2011). Regarding IL-6, higher levels were associated with a greater risk of PD (Chen et al., 2008; Sherer, 2011). We have shown that myeloid cell production of IL-6 is induced by α-SYN both in vitro and in vivo. IFN-γ has been implicated in contributing to degeneration of DA neurons through a mechanism involving microglia, and IFN-γ-deficient mice are protected against MPTP-induced neurotoxicity (Mount et al., 2007). Conversely, overexpression of IFN-γ in mice promoted microgliosis and nigrostrial degeneration (Chakrabarty et al., 2011). Microglia produce IFN-γ in response to α-SYN (Cebrián et al., 2014), and Th1 cells produce IFN-γ in the MPTP model (Olson et al., 2015). AZD1480 treatment of rats with α-SYN overexpression resulted in reduced levels of both IL-6 and IFN-γ, which may be a major contributing factor to reduced JAK/STAT activation and subsequent neuroprotection. In this regard, another neuroprotective strategy, that being a selective VIPR2 agonist tested in the MPTP model, reduced levels of IL-6 and IFN-γ in vivo (Olson et al., 2015).
Our results indicate that inhibition of the JAK/STAT pathway exerts a beneficial effect in suppressing neuroinflammatory immune responses at 4 weeks, and also suppresses expression of numerous genes implicated in α-SYN-induced neuroinflammation and neurodegeneration, as assessed by RNA-sequencing. These include genes related to neurologic and immune system pathways including antigen-presentation pathways, T-cell pathways, neurological diseases and skeletal and muscular disorders, as well as expression/activation of inducers and components of the JAK/STAT pathway (IFN receptor, STAT1, IRF7, and IFNs). There is clearly an “IFN gene signature” being induced in the AAV2-α-SYN rat model, and many of these genes are critical for antigen processing and presentation, including CD74 (MHC Class II invariant chain), MHC Class II, IRF1, CIITA, and MHC Class I. Furthermore, α-SYN overexpression also induced a number of proinflammatory cytokine and chemokine genes. ICAM5 expression was highly induced, and functions as an adhesion molecule for immune cell recruitment to inflammatory sites (Gahmberg et al., 2014). Jakinib treatment inhibited the expression levels of 59 genes compared with vehicle control treatment and the majority of genes inhibited were induced by α-SYN overexpression, including CD74, MHC Class II, CIITA, ICAM5, Ccl2, Ccl12, Cxcl10, Cxcl12, Tnfrsf26, IL-6, and IFN-γ. These findings clearly demonstrate that inhibition of JAK activity suppresses the expression of α-SYN-mediated proinflammatory molecules.
Previous studies have demonstrated that inhibition of the NF-κB signaling pathway prevents inflammatory responses and improves motor function in the MPTP-induced PD model, which highlights the beneficial effect of anti-inflammatory therapy (Ghosh et al., 2007). Therapeutically, NF-κB inhibitors have not been successful in clinical trials due to nephrotoxicity, and none of the currently available NF-κB inhibitors are specific for this transcription factor (Gray et al., 2014). As mentioned previously, JAKinibs have beneficial effects in patients with myeloproliferative diseases and rheumatoid arthritis, and are well tolerated (O'Shea and Plenge, 2012; O'Shea et al., 2015; Villarino et al., 2015). They are currently in Phase I, II and III clinical trials for a variety of diseases, including psoriasis, transplant rejection, diabetic nephropathy, Crohn's disease, lupus, lymphoma, and solid tumors. Our findings are the first documentation that suppression of the JAK/STAT pathway disrupts the circuitry of neuroinflammation and neurodegeneration, thus attenuating PD pathogenesis. We believe Jakinibs may be a viable therapeutic option for PD patients, especially because they are orally available, well tolerated, and do not promote immunosuppression.
Footnotes
This work is supported in part by the M. J. Fox Foundation (E.N.B.), NIH Grant R01 NS57563-05 (E.N.B.), NIH Grant P20 NS095230 (D.G.S., E.N.B.), the UAB Comprehensive Arthritis, Musculoskeletal, and Autoimmunity Center Comprehensive Flow Cytometry Core (NIH Grant P30 AR48311), the UAB Neuroscience Core (NIH Grant P30 NS47466), and the UAB Genomics Core (NIH Grants P30 CA13148 and P30 AI027767). We thank Dr. David K. Crossman for assistance with RNA-Seq data analysis.
The authors declare no competing financial interests.
References
- Adamski J, Benveniste EN. 17beta-estradiol activation of the c-Jun N-terminal kinase pathway leads to down-regulation of class II major histocompatibility complex expression. Mol Endocrinol. 2005;19:113–124. doi: 10.1210/me.2004-0270. [DOI] [PubMed] [Google Scholar]
- Allen Reish HE, Standaert DG. Role of alpha-synuclein in inducing innate and adaptive immunity in Parkinson disease. J Parkinsons Dis. 2015;5:1–19. doi: 10.3233/JPD-140491. [DOI] [PMC free article] [PubMed] [Google Scholar]
- Appel SH, Beers DR, Henkel JS. T cell-microglial dialogue in Parkinson's disease and amyotrophic lateral sclerosis: are we listening? Trends Immunol. 2010;31:7–17. doi: 10.1016/j.it.2009.09.003. [DOI] [PMC free article] [PubMed] [Google Scholar]
- Barkholt P, Sanchez-Guajardo V, Kirik D, Romero-Ramos M. Long-term polarization of microglia upon alpha-synuclein overexpression in nonhuman primates. Neuroscience. 2012;208:85–96. doi: 10.1016/j.neuroscience.2012.02.004. [DOI] [PubMed] [Google Scholar]
- Benveniste EN, Liu Y, McFarland BC, Qin H. Involvement of the janus kinase/signal transducer and activator of transcription signaling pathway in multiple sclerosis and the animal model of experimental autoimmune encephalomyelitis. J Interferon Cytokine Res. 2014;34:577–588. doi: 10.1089/jir.2014.0012. [DOI] [PMC free article] [PubMed] [Google Scholar]
- Béraud D, Maguire-Zeiss KA. Misfolded alpha-synuclein and toll-like receptors: therapeutic targets for Parkinson's disease. Parkinsonism Relat Disord. 2012;18:S17–S20. doi: 10.1016/S1353-8020(11)70008-6. [DOI] [PMC free article] [PubMed] [Google Scholar]
- Blesa J, Phani S, Jackson-Lewis V, Przedborski S. Classic and new animal models of Parkinson's disease. J Biomed Biotechnol. 2012;2012:845618. doi: 10.1155/2012/845618. [DOI] [PMC free article] [PubMed] [Google Scholar]
- Brochard V, Combadière B, Prigent A, Laouar Y, Perrin A, Beray-Berthat V, Bonduelle O, Alvarez-Fischer D, Callebert J, Launay JM, Duyckaerts C, Flavell RA, Hirsch EC, Hunot S. Infiltration of CD4+ lymphocytes into the brain contributes to neurodegeneration in a mouse model of Parkinson disease. J Clin Invest. 2009;119:182–192. doi: 10.1172/JCI36470. [DOI] [PMC free article] [PubMed] [Google Scholar]
- Cao S, Theodore S, Standaert DG. Fcγ receptors are required for NF-kappaB signaling, microglial activation and dopaminergic neurodegeneration in an AAV-synuclein mouse model of Parkinson's disease. Mol Neurodegener. 2010;5:42. doi: 10.1186/1750-1326-5-42. [DOI] [PMC free article] [PubMed] [Google Scholar]
- Cebrián C, Zucca FA, Mauri P, Steinbeck JA, Studer L, Scherzer CR, Kanter E, Budhu S, Mandelbaum J, Vonsattel JP, Zecca L, Loike JD, Sulzer D. MHC-I expression renders catecholaminergic neurons susceptible to T-cell-mediated degeneration. Nat Commun. 2014;5:3633–3648. doi: 10.1038/ncomms4633. [DOI] [PMC free article] [PubMed] [Google Scholar]
- Chakrabarty P, Ceballos-Diaz C, Lin WL, Beccard A, Jansen-West K, McFarland NR, Janus C, Dickson D, Das P, Golde TE. Interferon-gamma induces progressive nigrostriatal degeneration and basal ganglia calcification. Nat Neurosci. 2011;14:694–696. doi: 10.1038/nn.2829. [DOI] [PMC free article] [PubMed] [Google Scholar]
- Chen H, O'Reilly EJ, Schwarzschild MA, Ascherio A. Peripheral inflammatory biomarkers and risk of Parkinson's disease. Am J Epidemiol. 2008;167:90–95. doi: 10.1038/ncomms4633. [DOI] [PubMed] [Google Scholar]
- Daher JP, Volpicelli-Daley LA, Blackburn JP, Moehle MS, West AB. Abrogation of alpha-synuclein-mediated dopaminergic neurodegeneration in LRRK2-deficient rats. Proc Natl Acad Sci U S A. 2014;111:9289–9294. doi: 10.1073/pnas.1403215111. [DOI] [PMC free article] [PubMed] [Google Scholar]
- Daniele SG, Béraud D, Davenport C, Cheng K, Yin H, Maguire-Zeiss KA. Activation of MyD88-dependent TLR1/2 signaling by misfolded alpha-synuclein, a protein linked to neurodegenerative disorders. Sci Signal. 2015;8:ra45. doi: 10.1126/scisignal.2005965. [DOI] [PMC free article] [PubMed] [Google Scholar]
- Decressac M, Mattsson B, Lundblad M, Weikop P, Björklund A. Progressive neurodegenerative and behavioural changes induced by AAV-mediated overexpression of alpha-synuclein in midbrain dopamine neurons. Neurobiol Dis. 2012;45:939–953. doi: 10.1016/j.nbd.2011.12.013. [DOI] [PubMed] [Google Scholar]
- Dendrou CA, Fugger L, Friese MA. Immunopathology of multiple sclerosis. Nat Rev Immunol. 2015;15:545–558. doi: 10.1038/nri3871. [DOI] [PubMed] [Google Scholar]
- Dong Y, Benveniste EN. Immune function of astrocytes. Glia. 2001;36:180–190. doi: 10.1002/glia.1107. [DOI] [PubMed] [Google Scholar]
- Fellner L, Irschick R, Schanda K, Reindl M, Klimaschewski L, Poewe W, Wenning GK, Stefanova N. Toll-like receptor 4 is required for alpha-synuclein dependent activation of microglia and astroglia. Glia. 2013;61:349–360. doi: 10.1002/glia.22437. [DOI] [PMC free article] [PubMed] [Google Scholar]
- Frakes AE, Ferraiuolo L, Haidet-Phillips AM, Schmelzer L, Braun L, Miranda CJ, Ladner KJ, Bevan AK, Foust KD, Godbout JP, Popovich PG, Guttridge DC, Kaspar BK. Microglia induce motor neuron death via the classical NF-kappaB pathway in amyotrophic lateral sclerosis. Neuron. 2014;81:1009–1023. doi: 10.1016/j.neuron.2014.01.013. [DOI] [PMC free article] [PubMed] [Google Scholar]
- Funk N, Wieghofer P, Grimm S, Schaefer R, Bühring HJ, Gasser T, Biskup S. Characterization of peripheral hematopoietic stem cells and monocytes in Parkinson's disease. Mov Disord. 2013;28:392–395. doi: 10.1002/mds.25300. [DOI] [PubMed] [Google Scholar]
- Gahmberg CG, Ning L, Paetau S. ICAM-5: a neuronal dendritic adhesion molecule involved in immune and neuronal functions. Adv Neurobiol. 2014;8:117–132. doi: 10.1007/978-1-4614-8090-7_6. [DOI] [PubMed] [Google Scholar]
- Geissmann F, Gordon S, Hume DA, Mowat AM, Randolph GJ. Unravelling mononuclear phagocyte heterogeneity. Nat Rev Immunol. 2010;10:453–460. doi: 10.1038/nri2784. [DOI] [PMC free article] [PubMed] [Google Scholar]
- Ghosh A, Roy A, Liu X, Kordower JH, Mufson EJ, Hartley DM, Ghosh S, Mosley RL, Gendelman HE, Pahan K. Selective inhibition of NF-κB activation prevents dopaminergic neuronal loss in a mouse model of Parkinson's disease. Proc Natl Acad Sci U S A. 2007;104:18754–18759. doi: 10.1073/pnas.0704908104. [DOI] [PMC free article] [PubMed] [Google Scholar]
- González H, Contreras F, Pacheco R. Regulation of the neurodegenerative process associated to Parkinson's disease by CD4+ T cells. J Neuroimmune Pharmacol. 2015;10:561–575. doi: 10.1007/s11481-015-9618-9. [DOI] [PubMed] [Google Scholar]
- Gorbatyuk OS, Li S, Sullivan LF, Chen W, Kondrikova G, Manfredsson FP, Mandel RJ, Muzyczka N. The phosphorylation state of Ser-129 in human alpha-synuclein determines neurodegeneration in a rat model of Parkinson disease. Proc Natl Acad Sci U S A. 2008;105:763–768. doi: 10.1073/pnas.0711053105. [DOI] [PMC free article] [PubMed] [Google Scholar]
- Gray GK, McFarland BC, Nozell SE, Benveniste EN. NF-kappaB and STAT3 in glioblastoma: therapeutic targets coming of age. Expert Rev Neurother. 2014;14:1293–1306. doi: 10.1586/14737175.2014.964211. [DOI] [PMC free article] [PubMed] [Google Scholar]
- Grozdanov V, Bliederhaeuser C, Ruf WP, Roth V, Fundel-Clemens K, Zondler L, Brenner D, Martin-Villalba A, Hengerer B, Kassubek J, Ludolph AC, Weishaupt JH, Danzer KM. Inflammatory dysregulation of blood monocytes in Parkinson's disease patients. Acta Neuropathol. 2014;128:651–663. doi: 10.1007/s00401-014-1345-4. [DOI] [PMC free article] [PubMed] [Google Scholar]
- Hamza TH, Zabetian CP, Tenesa A, Laederach A, Montimurro J, Yearout D, Kay DM, Doheny KF, Paschall J, Pugh E, Kusel VI, Collura R, Roberts J, Griffith A, Samii A, Scott WK, Nutt J, Factor SA, Payami H. Common genetic variation in the HLA region is associated with late-onset sporadic Parkinson's disease. Nat Genet. 2010;42:781–785. doi: 10.1038/ng.642. [DOI] [PMC free article] [PubMed] [Google Scholar]
- Harms AS, Cao S, Rowse AL, Thome AD, Li X, Mangieri LR, Cron RQ, Shacka JJ, Raman C, Standaert DG. MHCII is required for α-Synuclein-induced activation of microglia, CD4 T cell proliferation, and dopaminergic neurodegeneration. J Neurosci. 2013;33:9592–9600. doi: 10.1523/JNEUROSCI.5610-12.2013. [DOI] [PMC free article] [PubMed] [Google Scholar]
- Hawthorne AL, Popovich PG. Emerging concepts in myeloid cell biology after spinal cord injury. Neurotherapeutics. 2011;8:252–261. doi: 10.1007/s13311-011-0032-6. [DOI] [PMC free article] [PubMed] [Google Scholar]
- Hedvat M, Huszar D, Herrmann A, Gozgit JM, Schroeder A, Sheehy A, Buettner R, Proia D, Kowolik CM, Xin H, Armstrong B, Bebernitz G, Weng S, Wang L, Ye M, McEachern K, Chen H, Morosini D, Bell K, Alimzhanov M, et al. The JAK2 inhibitor AZD1480 potently blocks STAT3 signaling and oncogenesis in solid tumors. Cancer Cell. 2009;16:487–497. doi: 10.1016/j.ccr.2009.10.015. [DOI] [PMC free article] [PubMed] [Google Scholar]
- Hirsch EC, Vyas S, Hunot S. Neuroinflammation in Parkinson's disease. Parkinsonism Relat Disord. 2012;18:S210–212. doi: 10.1016/S1353-8020(11)70065-7. [DOI] [PubMed] [Google Scholar]
- Hu X, Ivashkiv LB. Cross-regulation of signaling pathways by interferon-gamma: implications for immune responses and autoimmune diseases. Immunity. 2009;31:539–550. doi: 10.1016/j.immuni.2009.09.002. [DOI] [PMC free article] [PubMed] [Google Scholar]
- Huynh JL, Garg P, Thin TH, Yoo S, Dutta R, Trapp BD, Haroutunian V, Zhu J, Donovan MJ, Sharp AJ, Casaccia P. Epigenome-wide differences in pathology-free regions of multiple sclerosis-affected brains. Nat Neurosci. 2014;17:121–130. doi: 10.1038/nn.3588. [DOI] [PMC free article] [PubMed] [Google Scholar]
- Irwin DJ, Lee VM, Trojanowski JQ. Parkinson's disease dementia: convergence of alpha-synuclein, tau and amyloid-beta pathologies. Nat Rev Neurosci. 2013;14:626–636. doi: 10.1038/nrn3549. [DOI] [PMC free article] [PubMed] [Google Scholar]
- Ivashkiv LB, Donlin LT. Regulation of type I interferon responses. Nat Rev Immunol. 2014;14:36–49. doi: 10.1038/nri3581. [DOI] [PMC free article] [PubMed] [Google Scholar]
- Kannarkat GT, Boss JM, Tansey MG. The role of innate and adaptive immunity in Parkinson's disease. J Parkinsons Dis. 2013;3:493–514. doi: 10.3233/JPD-130250. [DOI] [PMC free article] [PubMed] [Google Scholar]
- Kigerl KA, Gensel JC, Ankeny DP, Alexander JK, Donnelly DJ, Popovich PG. Identification of two distinct macrophage subsets with divergent effects causing either neurotoxicity or regeneration in the injured mouse spinal cord. J Neurosci. 2009;29:13435–13444. doi: 10.1523/JNEUROSCI.3257-09.2009. [DOI] [PMC free article] [PubMed] [Google Scholar]
- Kim C, Ho DH, Suk JE, You S, Michael S, Kang J, Joong Lee S, Masliah E, Hwang D, Lee HJ, Lee SJ. Neuron-released oligomeric alpha-synuclein is an endogenous agonist of TLR2 for paracrine activation of microglia. Nat Commun. 2013;4:1562–1586. doi: 10.1038/ncomms2534. [DOI] [PMC free article] [PubMed] [Google Scholar]
- Kontzias A, Kotlyar A, Laurence A, Changelian P, O'Shea JJ. Jakinibs: a new class of kinase inhibitors in cancer and autoimmune disease. Curr Opin Pharmacol. 2012;12:464–470. doi: 10.1016/j.coph.2012.06.008. [DOI] [PMC free article] [PubMed] [Google Scholar]
- Krausgruber T, Blazek K, Smallie T, Alzabin S, Lockstone H, Sahgal N, Hussell T, Feldmann M, Udalova IA. IRF5 promotes inflammatory macrophage polarization and TH1-TH17 responses. Nat Immunol. 2011;12:231–238. doi: 10.1038/ni.1990. [DOI] [PubMed] [Google Scholar]
- Lee HJ, Suk JE, Patrick C, Bae EJ, Cho JH, Rho S, Hwang D, Masliah E, Lee SJ. Direct transfer of α-synuclein from neuron to astroglia causes inflammatory responses in synucleinopathies. J Biol Chem. 2010;285:9262–9272. doi: 10.1074/jbc.M109.081125. [DOI] [PMC free article] [PubMed] [Google Scholar]
- Lee HJ, Bae EJ, Lee SJ. Extracellular alpha-synuclein-a novel and crucial factor in Lewy body diseases. Nat Rev Neurol. 2014;10:92–98. doi: 10.1038/nrneurol.2013.275. [DOI] [PubMed] [Google Scholar]
- Lee YJ, Benveniste EN. STAT-1alpha expression is involved in IFN-gamma induction of the class II transactivator and class II MHC genes. J Immunol. 1996;157:1559–1568. [PubMed] [Google Scholar]
- Liu Y, Holdbrooks AT, De Sarno P, Rowse AL, Yanagisawa LL, McFarland BC, Harrington LE, Raman C, Sabbaj S, Benveniste EN, Qin H. Therapeutic efficacy of suppressing the JAK/STAT pathway in multiple models of experimental autoimmune encephalomyelitis. J Immunol. 2014;192:59–72. doi: 10.4049/jimmunol.1301513. [DOI] [PMC free article] [PubMed] [Google Scholar]
- Liu Y, Holdbrooks AT, Meares GP, Buckley JA, Benveniste EN, Qin H. Preferential recruitment of neutrophils into the cerebellum and brainstem contributes to the atypical experimental autoimmune encephalomyelitis phenotype. J Immunol. 2015;195:841–852. doi: 10.4049/jimmunol.1403063. [DOI] [PMC free article] [PubMed] [Google Scholar]
- Martinez FO, Gordon S. The M1 and M2 paradigm of macrophage activation: time for reassessment. F1000Prime Rep. 2014;6:13. doi: 10.12703/P6-13. [DOI] [PMC free article] [PubMed] [Google Scholar]
- McFarland BC, Ma JY, Langford CP, Gillespie GY, Yu H, Zheng Y, Nozell SE, Huszar D, Benveniste EN. Therapeutic potential of AZD1480 for the treatment of human glioblastoma. Mol Cancer Ther. 2011;10:2384–2393. doi: 10.1158/1535-7163.MCT-11-0480. [DOI] [PMC free article] [PubMed] [Google Scholar]
- McGeer PL, Itagaki S, Boyes BE, McGeer EG. Reactive microglia are positive for HLA-DR in the substantia nigra of Parkinson's and Alzheimer's disease brains. Neurology. 1988;38:1285–1291. doi: 10.1212/WNL.38.8.1285. [DOI] [PubMed] [Google Scholar]
- Moehle MS, West AB. M1 and M2 immune activation in Parkinson's disease: foe and ally? Neuroscience. 2015;302:59–73. doi: 10.1016/j.neuroscience.2014.11.018. [DOI] [PMC free article] [PubMed] [Google Scholar]
- Moehle MS, Webber PJ, Tse T, Sukar N, Standaert DG, DeSilva TM, Cowell RM, West AB. LRRK2 inhibition attenuates microglial inflammatory responses. J Neurosci. 2012;32:1602–1611. doi: 10.1523/JNEUROSCI.5601-11.2012. [DOI] [PMC free article] [PubMed] [Google Scholar]
- Mosley RL, Hutter-Saunders JA, Stone DK, Gendelman HE. Inflammation and adaptive immunity in Parkinson's disease. Cold Spring Harb Perspect Med. 2012;2:a009381. doi: 10.1101/cshperspect.a009381. [DOI] [PMC free article] [PubMed] [Google Scholar]
- Mount MP, Lira A, Grimes D, Smith PD, Faucher S, Slack R, Anisman H, Hayley S, Park DS. Involvement of interferon-gamma in microglial-mediated loss of dopaminergic neurons. J Neurosci. 2007;27:3328–3337. doi: 10.1523/JNEUROSCI.5321-06.2007. [DOI] [PMC free article] [PubMed] [Google Scholar]
- Nikcevich KM, Piskurich JF, Hellendall RP, Wang Y, Ting JP. Differential selectivity of CIITA promoter activation by IFN-gamma and IRF-1 in astrocytes and macrophages: CIITA promoter activation is not affected by TNF-alpha. J Neuroimmunol. 1999;99:195–204. doi: 10.1016/S0165-5728(99)00117-4. [DOI] [PubMed] [Google Scholar]
- Noelker C, Morel L, Lescot T, Osterloh A, Alvarez-Fischer D, Breloer M, Henze C, Depboylu C, Skrzydelski D, Michel PP, Dodel RC, Lu L, Hirsch EC, Hunot S, Hartmann A. Toll like receptor 4 mediates cell death in a mouse MPTP model of Parkinson disease. Sci Rep. 2013;3:1393–1398. doi: 10.1038/srep01393. [DOI] [PMC free article] [PubMed] [Google Scholar]
- Obeso JA, Rodriguez-Oroz MC, Goetz CG, Marin C, Kordower JH, Rodriguez M, Hirsch EC, Farrer M, Schapira AH, Halliday G. Missing pieces in the Parkinson's disease puzzle. Nat Med. 2010;16:653–661. doi: 10.1038/nm.2165. [DOI] [PubMed] [Google Scholar]
- Olson KE, Kosloski-Bilek LM, Anderson KM, Diggs BJ, Clark BE, Gledhill JM, Jr, Shandler SJ, Mosley RL, Gendelman HE. Selective VIP receptor agonists facilitate immune transformation for dopaminergic neuroprotection in MPTP-intoxicated mice. J Neurosci. 2015;35:16463–16478. doi: 10.1523/JNEUROSCI.2131-15.2015. [DOI] [PMC free article] [PubMed] [Google Scholar]
- O'Shea JJ, Plenge R. JAK and STAT signaling molecules in immunoregulation and immune-mediated disease. Immunity. 2012;36:542–550. doi: 10.1016/j.immuni.2012.03.014. [DOI] [PMC free article] [PubMed] [Google Scholar]
- O'Shea JJ, Schwartz DM, Villarino AV, Gadina M, McInnes IB, Laurence A. The JAK-STAT pathway: impact on human disease and therapeutic intervention. Annu Rev Med. 2015;66:311–328. doi: 10.1146/annurev-med-051113-024537. [DOI] [PMC free article] [PubMed] [Google Scholar]
- Polymeropoulos MH, Lavedan C, Leroy E, Ide SE, Dehejia A, Dutra A, Pike B, Root H, Rubenstein J, Boyer R, Stenroos ES, Chandrasekharappa S, Athanassiadou A, Papapetropoulos T, Johnson WG, Lazzarini AM, Duvoisin RC, Di Iorio G, Golbe LI, Nussbaum RL. Mutation in the alpha-synuclein gene identified in families with Parkinson's disease. Science. 1997;276:2045–2047. doi: 10.1126/science.276.5321.2045. [DOI] [PubMed] [Google Scholar]
- Qin H, Wilson CA, Lee SJ, Benveniste EN. IFN-β induced SOCS-1 negatively regulates CD40 gene expression in macrophages and microglia. FASEB J. 2006;20:985–987. doi: 10.1096/fj.05-5493fje. [DOI] [PubMed] [Google Scholar]
- Qin H, Yeh WI, De Sarno P, Holdbrooks AT, Liu Y, Muldowney MT, Reynolds SL, Yanagisawa LL, Fox TH, 3rd, Park K, Harrington LE, Raman C, Benveniste EN. Signal transducer and activator of transcription-3/suppressor of cytokine signaling-3 (STAT3/SOCS3) axis in myeloid cells regulates neuroinflammation. Proc Natl Acad Sci U S A. 2012;109:5004–5009. doi: 10.1073/pnas.1117218109. [DOI] [PMC free article] [PubMed] [Google Scholar]
- Raj T, Rothamel K, Mostafavi S, Ye C, Lee MN, Replogle JM, Feng T, Lee M, Asinovski N, Frohlich I, Imboywa S, Von Korff A, Okada Y, Patsopoulos NA, Davis S, McCabe C, Paik HI, Srivastava GP, Raychaudhuri S, Hafler DA, et al. Polarization of the effects of autoimmune and neurodegenerative risk alleles in leukocytes. Science. 2014;344:519–523. doi: 10.1126/science.1249547. [DOI] [PMC free article] [PubMed] [Google Scholar]
- Recchia A, Rota D, Debetto P, Peroni D, Guidolin D, Negro A, Skaper SD, Giusti P. Generation of a alpha-synuclein-based rat model of Parkinson's disease. Neurobiol Dis. 2008;30:8–18. doi: 10.1016/j.nbd.2007.11.002. [DOI] [PubMed] [Google Scholar]
- Reynolds AD, Stone DK, Hutter JA, Benner EJ, Mosley RL, Gendelman HE. Regulatory T cells attenuate TH17 cell-mediated nigrostriatal dopaminergic neurodegeneration in a model of Parkinson's disease. J Immunol. 2010;184:2261–2271. doi: 10.4049/jimmunol.0901852. [DOI] [PMC free article] [PubMed] [Google Scholar]
- Romero-Ramos M, von Euler Chelpin M, Sanchez-Guajardo V. Vaccination strategies for Parkinson disease: induction of a swift attack or raising tolerance? Hum Vaccin Immunother. 2014;10:852–867. doi: 10.4161/hv.28578. [DOI] [PMC free article] [PubMed] [Google Scholar]
- Roodveldt C, Christodoulou J, Dobson CM. Immunological features of alpha-synuclein in Parkinson's disease. J Cell Mol Med. 2008;12:1820–1829. doi: 10.1111/j.1582-4934.2008.00450.x. [DOI] [PMC free article] [PubMed] [Google Scholar]
- Sanchez-Guajardo V, Annibali A, Jensen PH, Romero-Ramos M. α-Synuclein vaccination prevents the accumulation of parkinson disease-like pathologic inclusions in striatum in association with regulatory T cell recruitment in a rat model. J Neuropathol Exp Neurol. 2013;72:624–645. doi: 10.1097/NEN.0b013e31829768d2. [DOI] [PubMed] [Google Scholar]
- Sanchez-Guajardo V, Tentillier N, Romero-Ramos M. The relation between alpha-synuclein and microglia in Parkinson's disease: recent developments. Neuroscience. 2015;302:47–58. doi: 10.1016/j.neuroscience.2015.02.008. [DOI] [PubMed] [Google Scholar]
- Saunders JA, Estes KA, Kosloski LM, Allen HE, Dempsey KM, Torres-Russotto DR, Meza JL, Santamaria PM, Bertoni JM, Murman DL, Ali HH, Standaert DG, Mosley RL, Gendelman HE. CD4+ regulatory and effector/memory T cell subsets profile motor dysfunction in Parkinson's disease. J Neuroimmune Pharmacol. 2012;7:927–938. doi: 10.1007/s11481-012-9402-z. [DOI] [PMC free article] [PubMed] [Google Scholar]
- Sherer TB. Biomarkers for Parkinson's disease. Sci Transl Med. 2011;3:79ps14. doi: 10.1126/scitranslmed.3002488. [DOI] [PubMed] [Google Scholar]
- Singleton AB, Farrer M, Johnson J, Singleton A, Hague S, Kachergus J, Hulihan M, Peuralinna T, Dutra A, Nussbaum R, Lincoln S, Crawley A, Hanson M, Maraganore D, Adler C, Cookson MR, Muenter M, Baptista M, Miller D, Blancato J, et al. α-Synuclein locus triplication causes Parkinson's disease. Science. 2003;302:841. doi: 10.1126/science.1090278. [DOI] [PubMed] [Google Scholar]
- Tang Y, Le W. Differential roles of M1 and M2 microglia in neurodegenerative diseases. Mol Neurobiol. 2016;53:1181–1194. doi: 10.1007/s12035-014-9070-5. [DOI] [PubMed] [Google Scholar]
- Theodore S, Cao S, McLean PJ, Standaert DG. Targeted overexpression of human alpha-synuclein triggers microglial activation and an adaptive immune response in a mouse model of Parkinson disease. J Neuropathol Exp Neurol. 2008;67:1149–1158. doi: 10.1097/NEN.0b013e31818e5e99. [DOI] [PMC free article] [PubMed] [Google Scholar]
- Van der Perren A, Macchi F, Toelen J, Carlon MS, Maris M, de Loor H, Kuypers DR, Gijsbers R, Van den Haute C, Debyser Z, Baekelandt V. FK506 reduces neuroinflammation and dopaminergic neurodegeneration in an alpha-synuclein-based rat model for Parkinson's disease. Neurobiol Aging. 2015;36:1559–1568. doi: 10.1016/j.neurobiolaging.2015.01.014. [DOI] [PubMed] [Google Scholar]
- Van Wagoner NJ, O'Keefe GM, Benveniste EN. Kinase inhibitors abrogate IFN-γ-induced class II transactivator and class II MHC gene expression in astroglioma cell lines. J Neuroimmunol. 1998;85:174–185. doi: 10.1016/S0165-5728(98)00010-1. [DOI] [PubMed] [Google Scholar]
- Villarino AV, Kanno Y, Ferdinand JR, O'Shea JJ. Mechanisms of JAK/STAT signaling in immunity and disease. J Immunol. 2015;194:21–27. doi: 10.4049/jimmunol.1401867. [DOI] [PMC free article] [PubMed] [Google Scholar]
- Wang Z, Gerstein M, Snyder M. RNA-Seq: a revolutionary tool for transcriptomics. Nat Rev Genet. 2009;10:57–63. doi: 10.1038/nrg2484. [DOI] [PMC free article] [PubMed] [Google Scholar]
- Weaver CT, Hatton RD, Mangan PR, Harrington LE. IL-17 family cytokines and the expanding diversity of effector T-cell lineages. Annu Rev Immunol. 2007;25:821–852. doi: 10.1146/annurev.immunol.25.022106.141557. [DOI] [PubMed] [Google Scholar]
- Zhang W, Wang T, Pei Z, Miller DS, Wu X, Block ML, Wilson B, Zhang W, Zhou Y, Hong JS, Zhang J. Aggregated alpha-synuclein activates microglia: a process leading to disease progression in Parkinson's disease. FASEB J. 2005;19:533–542. doi: 10.1096/fj.04-2751com. [DOI] [PubMed] [Google Scholar]