

Abstract
Aims/Objective
The present study aimed to explore the effects of micro‐ribonucleic acid‐365 (miR‐365) on apoptosis of retinal neurons by targeting insulin‐like growth factor‐1 (IGF‐1) in diabetes mellitus rats.
Materials and Methods
High glucose‐induced retinal neurons were assigned into the blank (with no plasmid transfection), negative control (with plasmid transfection), anti‐miR‐365 (transfected miR‐365 antagomir), transfected IGF‐1 short hairpin RNA plasmid (sh‐IGF‐1) and transfected miR‐365 antagomir and IGF‐1 shRNA plasmid (anti‐miR‐365 + sh‐IGF‐1) groups. Proliferation and apoptosis of retinal neurons were detected by 5‐ethynyl‐2′‐deoxyuridine assay and Hoechst 33342 staining, respectively. Expressions of miR‐365, IGF‐1, Bcl‐2‐associated X protein (Bax) and Bcl‐2 were determined by reverse transcription quantitative polymerase chain reaction and western blotting. A control group contained 10 healthy rats. Terminal deoxynucleotidyl transferase dUTP nick‐end labeling staining was used to evaluate apoptosis of retinal neurons in rats.
Results
In the anti‐miR‐365 group, the apoptosis rate and Bax expression were reduced in comparison with the negative control and blank groups, whereas the sh‐IGF‐1 and anti‐miR‐365 + sh‐IGF‐1 groups presented an opposite trend. Compared with the normal group, expressions of miR‐365 and Bax were increased, and expressions of IGF‐1 and Bcl‐2 were decreased, with more apoptotic cells in diabetes mellitus rat models. The sh‐IGF‐1 group had lower Bax expression, and higher expressions of IGF‐1 and Bcl‐2 with fewer apoptotic cells. Additionally, Bax expression was upregulated, expressions of IGF‐1 and Bcl‐2 were downregulated, and apoptotic cells were higher in the anti‐miR‐365 + sh‐IGF‐1 groups than the anti‐miR‐365 group.
Conclusion
The results of the present study suggest that suppressed miR‐365 increases the IGF‐1 expression, leading to anti‐apoptotic effects on retinal neurons in diabetic rats.
Keywords: Diabetes mellitus, Insulin‐like growth factor‐1, Micro‐ribonucleic acid‐365
Introduction
Diabetic retinopathy (DR) is a common microvascular complication, and the main cause of associated functional impairment and avoidable blindness1, 2, 3. One‐third of diabetes patients have DR symptoms, while the prevalence of other vision‐threatening diseases, such as diabetic macular edema and proliferative diabetic retinopathy, is approximately one‐tenth4, 5. DR features basement membrane thickening and apoptosis of capillary cells, leading to neovascularization and retinal ischemia/hypoxia6, 7. Hyperglycemia is considered the main contributing factor of DR, with hypertension, hypercholesterolemia, hyperlipidemia, alcohol consumption and smoking following closely8, 9. Traditional treatments for DR using laser photocoagulation, intravitreal corticosteroids and vitreoretinal surgery are shown to have side‐effects and limitations, therefore insulin‐like growth factor (IGF) and vascular endothelial growth factor are becoming increasingly important methods of treatment10, 11, 12. Recently, extensive studies have suggested the involvement of micro‐ribonucleic acids (miRNAs) in treating DR13, 14.
miRNAs are essential in modulating several important biological pathways and cellular functions, consequently making a difference on protein expressions15. Studies have shown that serum miRNAs are capable of serving as biomarkers for various diseases, including DR16, 17, 18. miR‐365 is a potential therapeutic target for diabetes mellitus, because of its ability to act like an endocrine signaling molecule and potential disease biomarker19, 20. The neurotrophic insulin‐like growth factor‐1 (IGF‐1), which regulates glucose and participates in retinal endotheliocyte proliferation and neovascularization, is heavily involved in DR pathogenesis through many different pathways21, 22. IGF‐1 is an attributing factor in controlling neuronal excitability, as well as the metabolism and survival of neurons23. Other researchers believe that miR‐365 expression can be depressed by IGF‐1 treatment24. However, little research has been carried out on the link between miR‐365 and DR. The present study aimed to explore the effects of miR‐365 on apoptosis of retinal neurons by targeting IGF‐1 in diabetic rats, and developing experimental bases for future studies and gene therapy of DR.
Methods
Ethical statement
This experiment was operated in accordance with the instructions of the plasmid isolation kit (Promega, Madison, WI, USA). All experiments were carried out in accordance with the international guideline's Principles of Laboratory Animals Care and were approved by the Animal Care Committee of the Shanghai General Hospital, Shanghai Jiao Tong University, School of Medicine.
Primary culture of retinal neurons
The eyeballs of Sprague–Dawley rats aged 1–3 days (Shanghai SIPPR/BK Laboratory Animal Co., Ltd., Shanghai, China) were extracted. The rat's retinal layer was separated by blunt dissection, then cut into tissue blocks and collected in a centrifuge tube. Single cell suspension was prepared using a straw, and then filtered. After centrifugation, the collected retinal neurons were re‐suspended at 1 × 10⁶/mL. Next, the retinal neurons were seeded into a six‐well polylysine‐coated plate (Sigma‐Aldrich, St. Louis, MO, USA) and incubated at 37°C in a 5% CO2 incubator. After 24 h, the culture medium was changed to a maintenance medium (Invitrogen, Camarillo, CA, USA) containing 97.5% neurobasal medium, and 2% B27, 0.5% 200 mmol/L l‐glutamine. Medium change was carried out again after 2–3 days. The cell morphology was observed under the phase contrast microscope every day.
Immunohistochemistry
The cultured cells were inoculated on the cells of the cell slides treated with polylysine. After the cells grow to the appropriate density, immunohistochemistry staining was carried out. Each slide was washed by phosphate‐buffered saline (PBS) three times (3 min for each time). Cells were fixed in 4% polyformaldehyde for 20 min, treated with 3% hydrogen peroxide for 10 min to reduce the activity of endogenous catalase, and then washed by PBS three times. The sections were blocked with 5% goat serum for 30 min, and then incubated overnight with a mouse‐anti‐rat nestin monoclonal antibody (1:200 dilution, ab11306; Abcam, Cambridge, UK) and the rabbit‐anti‐rat glial fibrillary acidic protein (GFAP) polyclonal antibody (1:200, ab7260; Abcam) at 4°C. After the incubation, sections were washed with PBS for 3 × 5 min, incubated with biotin‐labeled secondary antibody (Boster Bioengineering Co., Ltd, Wuhan, China) for 30 min and streptomycin labeled ovalbumin working fluid for 30 min, respectively, and then the signals were amplified. Subsequently, the sections were stained with diaminobenzidine and observed by an optical microscope, and then the experimental results were shot.
Model establishment of high glucose and grouping
After an incubation period of 3 days, the isolated retinal neurons were seeded into a 24‐well plate and assigned to a normal control group, a high glucose‐induced group with concentrations of 5, 20, 30 and 50 mmol/L, and a mannitol treatment group with concentrations of 5, 10, 20 and 30 mmol/L. After 24, 48 and 72 h of high‐glucose exposure, the retinal neurons were observed. The survival rate was obtained by 3‐(4, 5‐dimethyl‐2‐thiazolyl)‐2, 5‐diphenyl‐2‐H‐tetrazolium bromide assay to determine the appropriate concentration for high‐glucose‐induced models.
Dual‐luciferase reporter gene assay
miRNA bioinformatics target predictor software predicted the miR‐365 binding site in the 3′‐untranslated region (3′UTR) of IGF‐1, and the promoter region sequence of IGF‐1 3′UTR containing the miR‐365 binding site was synthesized. Next, they were inserted into a pGL3 NC vector (Promega) of the BglII site at the 5′ end to construct a wild‐type (WT) plasmid of IGF‐1 3′UTR (named IGF‐1 3′UTR‐WT). A mutant plasmid of IGF‐1 3′UTR (named IGF‐1 3′UTR‐MUT) was constructed by mutating the miR‐365 binding site, based on IGF‐1 3′UTR‐WT. The reporter vector used in this experiment was pcDNA3.l‐luc, which encodes firefly luciferase. To measure transfection efficiency, pRL‐TK was transfected as an internal control, which encodes Renilla luciferase. After preheating and zero setting, 40 μL of luciferase assay reagent II and 40 μL of Stop & Glo reagent were added. The luciferase activities were measured and recorded.
Cell grouping and transfection
High‐glucose‐induced retinal neurons were assigned into the blank (without plasmid transfection), negative control (NC; with NC plasmid transfection), transfected miR‐365 antagomir (anti‐miR‐365), transfected IGF‐1 short hairpin RNA (shRNA) plasmid (sh‐IGF‐1) and transfected miR‐365 antagomir and IGF‐1 shRNA plasmid (anti‐miR‐365 + sh‐IGF‐1) groups. The lentiviral vectors and shRNA plasmids used in this experiment were constructed by Shanghai GeneChem Co., Ltd (Shanghai, China). After trypsin digestion, the retinal neurons (2 × 10⁵ cells/mL) of all groups at logarithmic growth phase were placed into six‐well plates, 1 day before transfection. Once the cell confluence reached 50–70%, adherent retinal neurons were transfected with a virus. The virus solution (Invitrogen, Carlsbad, CA, USA) was diluted by a medium containing 5 μg/mL polybrene. Retinal neurons were added with virus diluents (1 mL/well), then incubated in an incubator for 120 h.
5‐Ethynyl‐2′‐deoxyuridine assay
After dilution, retinal neurons were adjusted to 5 × 10⁴ cells/well and inoculated into a 96‐well polylysine‐coated plate (Sigma‐Aldrich). They were then cultured for cell adhesion. After cell confluence reached 80%, the 10% fetal bovine serum culture medium was replaced with serum‐free medium for 24 h to synchronize the cells. Next, the retinal neurons were assigned into the five groups mentioned above (with six wells per group), and 10 μmol/L 5‐ethynyl‐2′‐deoxyuridine (EdU) was added to the medium of each group. After incubation for 24, 48 and 72 h, an inverted fluorescence microscope was used to observe and count the cells.
Hoechst 33342 staining
The retinal neurons were placed in a six‐well polylysine‐coated plate (Sigma‐Aldrich). After cell confluence reached 80%, the retinal neurons were incubated for an additional 48 h before Hoechst 33342 staining. The Hoechst 33342 staining procedure was carried out in accordance with the instructions of Hoechst 33342 solution (Beijing Fanbo Biochemicals Co., Ltd., Beijing, China). After the medium was removed, the retinal neurons were washed twice with PBS (Gibco Life Technologies, Grand Island, NY, USA), then fixed with 4% paraformaldehyde for 30 min. Afterwards, the fixed neurons were washed twice with PBS again (GibcoBRL), then stained with 0.5 mL of Hoechst 33342 solution for another 30 min. The retinal neurons were then washed three times with PBS (Gibco Life Technologies), and the plates were observed and photographed under a fluorescence microscope. Three fields were randomly chosen, and >200 retinal neurons were counted. The calculation for the apoptosis rate is as follows: apoptosis rate = the number of apoptotic neurons/the total number of neurons.
Reverse transcription quantitative polymerase chain reaction
The total RNA from retinal tissues and retinal neurons of all groups was separated in accordance with the instructions of the manufacturer (Qiagen, Valencia, CA, USA). The spectrophotometer detected optical density at 260/280 of extracted RNA. RNA concentrations were calculated and stored at −80°C for preservation. The complementary deoxyribonucleic acid was synthesized by reverse transcription in accordance with the manufacturer's instructions (Qiagen).
Specific reverse transcription stem‐loop primer and primer for polymerase chain reaction amplification were designed using Primer Premier 5.0, based on the sequences of GenBank and miRBase (Table 1). All primers were synthesized by Sangon Biotech Co., Ltd. (Shanghai, China). U6 expression was used as the internal reference to determine miR‐365 expression, and the β‐actin expression served as the internal reference for expression of other genes. The polymerase chain reaction results were evaluated by solubility curve, and a cycle threshold value was generated. Gene expression was measured and calculated using the 2−▵▵Ct method.
Table 1.
Primer sequences for reverse transcription quantitative polymerase chain reaction
| Gene | Forward | Reverse |
|---|---|---|
| miR‐365 | 5′‐CGTAATGCCCCTAAAAAT‐3′ | 5′‐GTGCAGGGTCCGAGGT‐3′ |
| U6 | 5′‐CTCGCTTCGGCAGCACA‐3′ | 5′‐AACGCTTCACGAATTTGCGT‐3′ |
| IGF‐1 | 5′‐TTAACCAGTTCTGCTGCTGC‐3′ | 5′‐TGGTGTAAGCGTCTACTGCT‐3′ |
| Bax | 5′‐GCGAATTGGAGATGAACTGG‐3′ | 5′‐GTGAGCGAGGCGGTGAGGAC‐3′ |
| Bcl‐2 | 5′‐GCAACCGAACGCCCGCTGTC‐3′ | 5′‐GTGATGCAGGCCCCCACCAG‐3′ |
| β‐Actin | 5′‐CGTTGACATCCGTAAAGACC‐3′ | 5′‐AACAGTCCGCCTAGAAGCAC‐3′ |
Bax, Bcl‐2 associated X protein; IGF‐1, insulin‐like growth factor‐1; miR‐365, micro‐ribonucleic acif‐365.
Western blotting
Proteins were extracted from the retinal tissues and retinal neurons of all groups. The protein concentration was measured using a bicinchoninic acid protein assay kit (Beijing Beyotime Biotechnology Co., Ltd., Beijing, China). The membranes were incubated overnight at 4°C with primary antibodies IGF‐1 (1:1000; Bioworld Technology, Inc., St. Louis Park, MN, USA), Bcl‐2‐associated X protein (Bax; mouse anti; 1:200; Santa Cruz Biotechnology, Inc., Santa Cruz, CA, USA) and Bcl‐2 (mouse anti; 1:500; Santa Cruz Technology). Next, the secondary antibodies were added and the membranes were incubated at room temperature for 1 h. After membranes were rinsed, the blots were visualized using enhanced chemiluminescence. β‐Actin was used as an internal reference. The films were documented using Bio‐Rad Gel Doc EZ System (GEL DOC EZ IMAGER; Bio‐Rad, Hercules, CA, USA), and the bands were quantified using gray scale values measured by ImageJ software (ImageJ 1.34; National Institutes of Health, Bethesda, MD, USA).
Animal model establishment and grouping
A total of 60 male Sprague–Dawley rats (180 ± 20 g) were purchased from Shanghai SIPPR‐BK Laboratory Animal Co., Ltd (Shanghai, China). All rats were fed free regular diets. An intraperitoneal injection using 1% of streptozotocin (60 mg/kg; Sigma‐Aldrich) was given to 50 Sprague–Dawley rats to induce diabetes mellitus. Once 48 h had passed after streptozotocin injection, rats with tail vein blood glucose level >16.7 mmol/L were considered diabetic. The diabetic rats were randomly assigned into the blank group (intravitreal injection of 10 μL of normal virus diluent), the NC group (intravitreal injection of 10 μL of virus‐negative control), the anti‐miR‐365 group (intravitreal injection of 10 mL of lentiviral solution of anti‐miR‐365), the sh‐IGF‐1 group (intravitreal injection of 5 mL of lentiviral solution of sh‐IGF‐1) and the anti‐miR‐365 + sh‐IGF‐1 group (intravitreal injection of 5 mL of lentiviral solution of anti‐miR‐365, and 5 mL of lentiviral solution of sh‐IGF‐1). All rats were successfully established, and 10 rats were assigned to each group. The 10 rats that had not been injected with streptozotocin served as normal controls (the control group). Virus sequences of anti‐miR‐365, sh‐IGF‐1 and NC of virus were constructed by Shanghai GeneChem Co., Ltd. and packaged into lentiviruses. The viral titer value was 109/mL. The intravitreal injection was carried out.
Retina paraffin sections
Eight weeks after treatment, the rats were anesthetized with an intraperitoneal injection of ketamine hydrochloride (2 mL; 50 mg/kg). The heart was exposed, and after being opened, the apex of the left ventricle was inserted with a needle connected to a perfusion pump. Once clear fluid was drawn out, perfusion was carried out using 4% paraformaldehyde until the rat was stiff in the limbs. The eyeballs were removed and fixed by 4% paraformaldehyde, and the anterior segment and vitreous body were taken out. The remaining eyeball wall was dehydrated using gradient ethanol, hyalinized by dimethylbenzene, embedded in paraffin and sectioned at a thickness of 8 μL.
Hematoxylin–eosin staining
The paraffin sections were dehydrated, stained purple with Hansen's hematoxylin, differentiated, stained with eosin, dehydrated, cleared and sealed with neutral gum.
Terminal deoxynucleotidyl transferase DUTP nick‐end labeling staining
The tissues of all groups were examined using a Terminal deoxynucleotidyl transferase dUTP nick‐end labeling (TUNEL) kit (Beyotime, Beijing, China) to generate the apoptosis index. TUNEL staining was operated with a TUNEL kit (Beyotime) in accordance with the manufacturer's protocol. The tissue sections were floated in a water bath for 60 min at 37°C and washed five times in poly(butylene succinate‐eo‐terephthalate). The sections were incubated with corresponding antibodies in the dark at 37°C and added with peroxidase. The staining was visualized using 3, 3′‐diaminobenzidine. Then, the sections were sealed followed by 12 h of air drying. Under a light microscope with ×400 magnification in five fields of view, the sections of each group were observed and photographed. The number of positive retinal neurons and total retinal neurons were calculated. The apoptosis index calculation was carried out as follows: apoptosis index = the number of positive retinal neurons/the number of total retinal neurons.
Statistical analysis
SPSS version 18.0 (SPSS Inc., Chicago, IL, USA) was used for statistical analysis. Measurement data is expressed by mean ± standard deviation. Two‐tailed Student's t‐test was applied to analyze the difference between two groups. Comparison among three groups was analyzed by one‐factor analysis of variance (anova). Enumeration data is expressed as a percentage or rate, and compared by the χ2‐test. Pearson correlation analysis was carried out. P < 0.05 was considered to show a statistically significant result.
Results
Nestin and GFAP‐positive cells were detected
Immunohistochemistry staining was carried out to detect the positive cells (Figure 1). After 3 days of cell culture, most of the surviving cells were NSE‐positive cells, and a few were GFAP‐positive cells. NSE‐positive cells were circular or oval, and some neurites were seen while GFAP positive cells were flat or spindle.
Figure 1.

Result of immunohistochemical staining. (a) Nestin‐positive cells were detected. (b) Glial fibrillary acidic protein positive cells were detected.
Survival rates of retinal neurons treated with different concentrations of glucose, mannitol and IGF‐1
The survival rates of retinal neurons induced by glucose and mannitol of different concentrations were analyzed using EdU assay. The results showed that, 12 h after being intervened by glucose of different concentrations (P > 0.05), survival rates showed no significant difference among all groups. In comparison with normal retinal neurons (the control group), survival rates of cells induced by high glucose (20, 30 and 50 mmol/L) were decreased (P < 0.05), with the most obvious decrease taking place in retinal neurons induced by high glucose concentrations of 50 mmol/L (P < 0.05). The survival rates of retinal neurons induced with different concentrations of high glucose varied by period of time (P < 0.05). After 48 and 72 h of high glucose induction, the survival rates of retinal neurons were lower than that after 12 h (P < 0.05), and the survival rate after 72 h was lower than that after 48 h (P < 0.05). The retinal neurons induced by glucose concentrations of 30 mmol/L showed a 50% decrease in survival rate for 48 h. Therefore, the high glucose‐induced model was set with a concentration of 30 mmol/L and time of 48 h (Figure 2).
Figure 2.
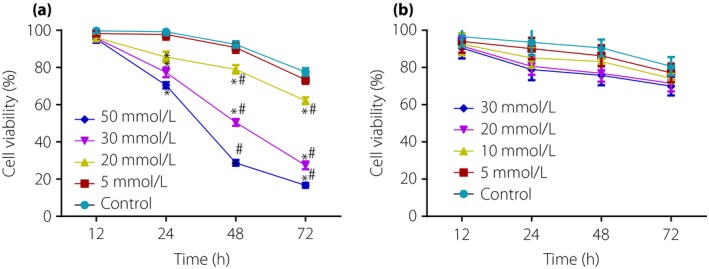
Survival rates of retinal neurons treated with different concentrations of glucose, mannitol and insulin‐like growth factor‐1. (a) Effect of different concentrations of glucose on viability of retinal neurons. (b) Effect of different concentrations of mannitol on viability of retinal neurons. *P < 0.05, compared with the control group; # P < 0.05, compared with 12 h.
IGF‐1 was confirmed as a target gene of miR‐365
IGF‐1 was confirmed as a target gene of miR‐365 by microRNA.org (http://www.microrna.org/microrna/), an online prediction tool for predicting target genes of miRNAs. The prediction tool revealed a high degree of conservation in the binding domain of 3′UTR of IGF‐1 to miR‐365 (Figure 3a). After transfection with miR‐365 mimics, the dual‐luciferase reporter gene assay showed that the relative luciferase activity of IGF‐1 3′UTR‐WT was less than that of the WT + NC group (P < 0.01). No difference in relative luciferase activities was observed in the MT + miR‐365 mimics group or the MT + NC group (Figure 3b). This result is consistent with the bioinformatics prediction, further demonstrating that miR‐365 could bind to the base in the seed region of 3′UTR of IGF‐1 messenger RNA (mRNA), leading to targeted inhibition of miR‐365 and IGF‐1.
Figure 3.
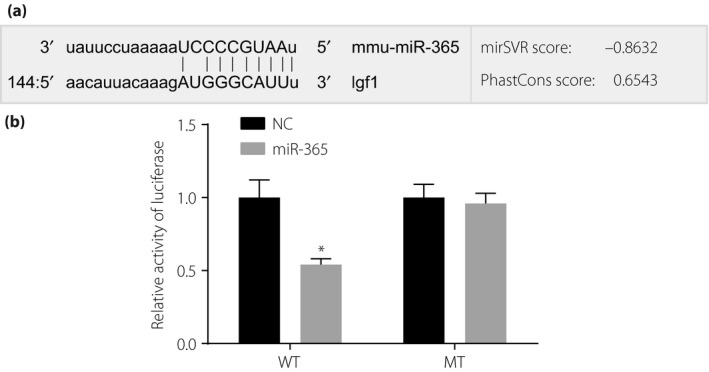
The target relationship between insulin‐like growth factor‐1 (IGF‐1) and micro‐ribonucleic acid‐36 (miR‐365) by dual‐luciferase reporter gene assay. (a) Base pairing of miR‐365 and IGF‐1 3′‐untranslated region (3′UTR). (b) Dual‐luciferase analysis of IGF‐1 3′UTR transfected with miR‐365 mimics and miR‐365 negative control. *P < 0.01, compared with the miR‐365‐negative control. MT, mutant type; NC, negative control; WT, wild type.
MiR‐365 inhibited proliferation and promoted the apoptosis of diabetic retinal neurons
The proliferation and apoptosis of transfected retinal neurons in the blank, NC, anti‐miR‐365, sh‐IGF‐1 and anti‐miR‐365 + sh‐IGF‐1 groups was detected by EdU assay and Hoechst 33342 staining, respectively. Compared with the NC and blank groups, the anti‐miR‐365 group showed increased proliferation of retinal neurons, while the sh‐IGF‐1 and anti‐miR‐365 + sh‐IGF‐1groups had reduced proliferation. Additionally, significant differences were found at 72 h of transfection (P < 0.05; Figure 4). The results of Hoechst 33342 staining (Figure 5) showed that, compared with the NC and blank groups, the anti‐miR‐365 group exhibited a reduced apoptosis rate of retinal neurons (P < 0.05), whereas the sh‐IGF‐1 and anti‐miR‐365 + sh‐IGF‐1 groups showed increased apoptosis (P < 0.05). However, the anti‐miR‐365 + sh‐IGF‐1 group had a lower apoptosis rate than the sh‐IGF‐1 group (P < 0.05).
Figure 4.
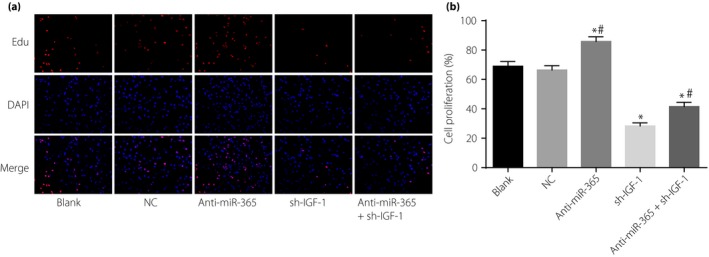
Proliferation of retinal neurons after transfection among five groups detected by EdU assay. (a) Detection of cell proliferation by 5‐ethynyl‐2′‐deoxyuridine (EdU) staining. (b) Cartogram of cell proliferation of each group. Red fluorescence in (a) were newly proliferated cells. *P < 0.05, compared with the negative control (NC) and blank groups; # P < 0.05, compared with the short hairpin ribonucleic acid plasmid (sh‐IGF‐1) group. DAPI, 4′,6‐diamidino‐2‐phenylindole; IGF‐1, insulin‐like growth factor‐1; miR‐365, micro‐ribonucleic acid‐365.
Figure 5.
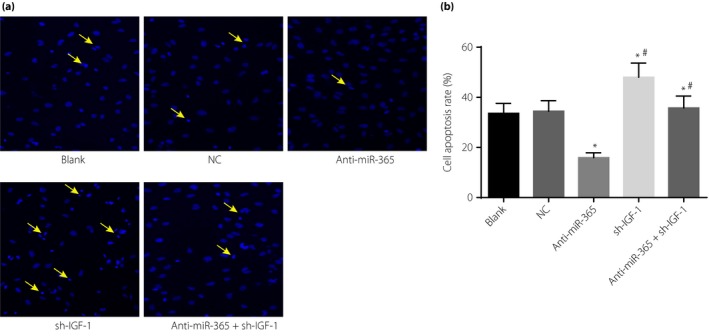
The apoptosis rate of retinal neurons after transfection among five groups. (a) Detection of cell apoptosis by Hoechst 33342 staining. (b) Cartogram of cell apoptosis of each group; the cells directed by a yellow arrow were apoptotic retinal neurons. *P < 0.05, compared with the negative control (NC) and blank groups; # P < 0.05, compared with the short hairpin ribonucleic acid plasmid (sh‐IGF‐1) group. IGF‐1, insulin‐like growth factor‐1; miR‐365, micro‐ribonucleic acid‐365.
Expressions of miR‐365 and Bax were enhanced and expressions of IGF‐1 and Bcl‐2 were reduced in diabetic retinal neurons in the in vitro model
To detect the expression of miR‐365, IGF‐1 and apoptosis‐related proteins in retinal neurons 48 h after transfection with glucose (30 mmol/L), reverse transcription quantitative polymerase chain reaction assay and western blotting were carried out. Compared with the blank group, the miR‐365 expression in the anti‐miR‐365 and anti‐miR‐365 + sh‐IGF‐1 groups was decreased significantly (all P < 0.05), but no significant differences were found in the NC and sh‐IGF‐1 groups (both P > 0.05). Compared with the blank group, the anti‐miR‐365 group showed reduced Bax mRNA and protein expression (P < 0.05), but enhanced expression of IGF‐1 and Bcl‐2 mRNA and protein (P < 0.05); opposite results were found in the sh‐IGF‐1 and anti‐miR‐365 + sh‐IGF‐1 groups(P < 0.05). In contrast with the sh‐IGF‐1 group (P < 0.05), the expressions of IGF‐1, Bax and Bcl‐2 varied significantly between the anti‐miR‐365 and anti‐miR‐365 + sh‐IGF‐1 groups. A negative correlation between miR‐365 and IGF‐1 mRNA was detected by Pearson analysis (r = −0.525, P = 0.044; Figure 6).
Figure 6.
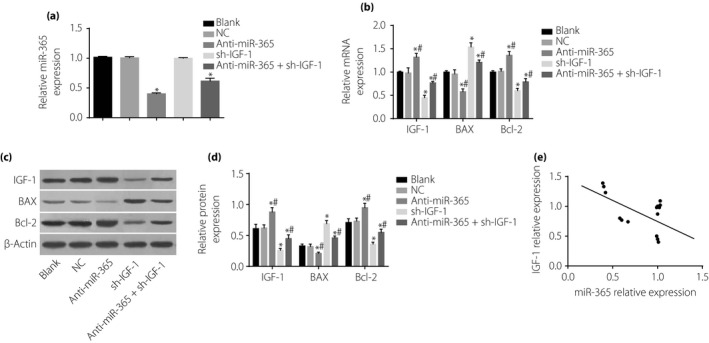
Expressions of micro‐ribonucleic acid‐365 (miR‐365), insulin‐like growth factor‐1 (IGF‐1) and apoptosis‐related proteins (Bcl‐2‐associated X protein [Bax] and Bcl‐2) in retinal neurons after transfection among five groups. (a) miR‐365 expression in five groups. (b) Messenger RNA (mRNA) expressions of IGF‐1, Bcl‐2 and Bax in five groups detected by western blotting. (c) Statistical data of protein expressions of IGF‐1, Bcl‐2 and Bax in five groups. (d) Protein expressions of IGF‐1, Bcl‐2 and Bax in five groups detected by western blotting. (e) Correlation analysis of miR‐365 and IGF‐1. *P < 0.05, compared with the blank group; # P < 0.05, compared with the sh‐IGF‐1 group. NC, negative control.
Larger amount of apoptotic retinal neurons was observed in the sh‐IGF‐1 and anti‐miR‐365 + sh‐IGF‐1 groups
Hematoxylin–eosin staining results showed that retina thickness in the blank, NC, sh‐IGF‐1 and anti‐miR‐365 + sh‐IGF‐1 groups was downregulated compared with the normal group (all P < 0.05). Although the anti‐miR‐365 group showed upregulated retina thickness when compared with the control group, the sh‐IGF‐1 and anti‐miR‐365 + sh‐IGF‐1 groups had decreased retina thickness (all P < 0.05). However, in contrast with the sh‐IGF‐1 group, retina thickness was increased in the anti‐miR‐365 + sh‐IGF‐1group (both P < 0.05). Meanwhile, retinal vascular changes and hyperemia degree were observed. Compared with the normal group, the arrows of the blank and NC groups refer to the vascular structure of the retina being increased and the degree of congestion being aggravated, but these symptoms were relieved in the anti‐miR‐365 group, and the vascular structure of the retina was increased and the degree of congestion was aggravated in the sh‐IGF‐1 and anti‐miR‐365 + sh‐IGF‐1 groups. Compared with the sh‐IGF‐1 group, the vascular structure of the retina and the degree of congestion was not aggravated significantly in the anti‐miR‐365 + sh‐IGF‐1 group (Figure 7).
Figure 7.
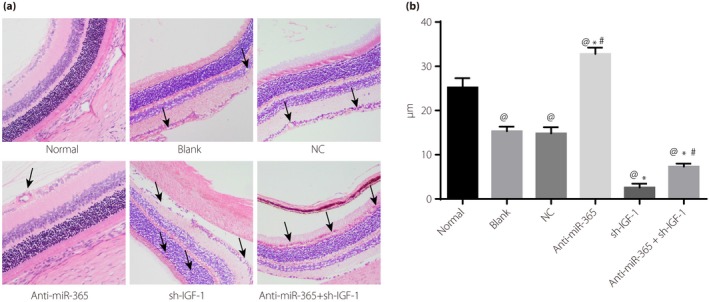
Hematoxylin–eosin staining results of retinal tissues in diabetes mellitus rats. (a) Observation of retina thickness of diabetes mellitus rats in each group by hematoxylin–eosin staining. (b) Cartogram of retinal thickness of diabetes mellitus rats; the cells shown by black arrows were the number of physalides and retinal neurons. @ P < 0.05, compared with the normal group; *P < 0.05, compared with the blank group; # P < 0.05, compared with the transfected insulin‐like growth factor‐1 (IGF‐1) short hairpin ribonucleic acid plasmid (sh‐IGF‐1) group. miR‐365, micro‐ribonucleic acid‐365; NC, negative control.
Expressions of miR‐365 and Bax were enhanced, and expressions of IGF‐1 and Bcl‐2 were reduced in diabetic retinal tissues
The miR‐365 expression in the blank, NC and sh‐IGF‐1 groups were increased (P < 0.05) in comparison with the normal group. In the blank, NC, sh‐IGF‐1 and anti‐miR‐365 + sh‐IGF‐1 groups, the expressions of IGF‐1 and Bcl‐2 mRNA and proteins were decreased, whereas the expressions of Bax mRNA and proteins were increased (P < 0.05). The anti‐miR‐365 group showed reduced Bax mRNA and protein expression, but enhanced expressions of IGF‐1 and Bcl‐2 mRNA and proteins (P < 0.05); the sh‐IGF‐1 group presented reduced expressions of IGF‐1, Bcl‐2 mRNA and proteins, but enhanced Bax mRNA and protein expression (P < 0.05; Figure 8).
Figure 8.
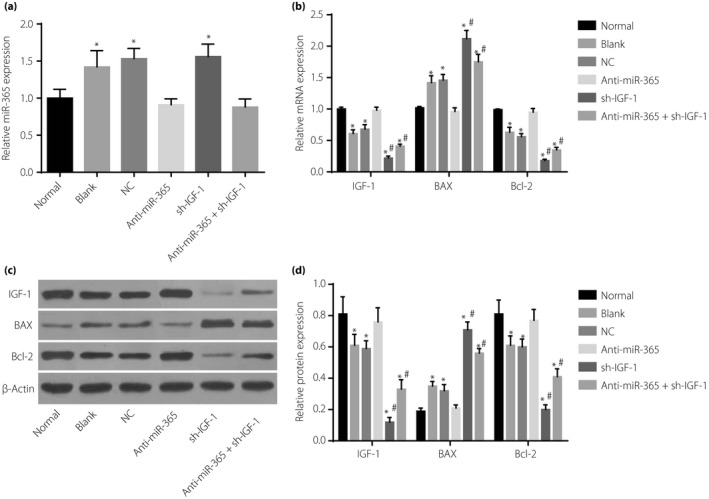
Expressions of micro‐ribonucleic acid‐365 (miR‐365), insulin‐like growth factor‐1 (IGF‐1) and apoptosis‐related proteins (Bcl‐2‐associated X protein [Bax] and Bcl‐2) in retinal tissues of rats among six groups. (a) miR‐365 expression in six groups. (b) Messenger ribonucleic acid (mRNA) expressions of IGF‐1, Bcl‐2 and Bax in six groups. (c) Protein expressions of insulin‐like growth factor‐1 (IGF‐1), Bcl‐2 and Bax in six groups detected by western blotting. (d) Statistical data of protein expressions of IGF‐1, Bcl‐2 and Bax in six groups detected by western blotting. *P < 0.05, compared with the normal group; # P < 0.05, compared with the blank group. NC, negative control; sh‐IGF‐1, transfected IGF‐1 short hairpin ribonucleic acid plasmid.
IGF‐1 reduced the apoptosis rate of diabetic retinal neurons while miR‐365 increased
The results of TUNEL staining revealed that the blank, NC, anti‐miR‐365, sh‐IGF‐1 and anti‐miR‐365 + sh‐IGF‐1 groups showed an increased apoptosis rate compared with the normal group (all P < 0.05). When compared with the blank and NC groups, the anti‐miR‐365 group exhibited a reduced apoptosis rate, but the sh‐IGF‐1 and anti‐miR‐365 + sh‐IGF‐1 groups had an increased apoptosis rate (P < 0.05). The anti‐miR‐365 + sh‐IGF‐1 group had a lower apoptosis rate than the sh‐IGF‐1 group (Figure 9).
Figure 9.
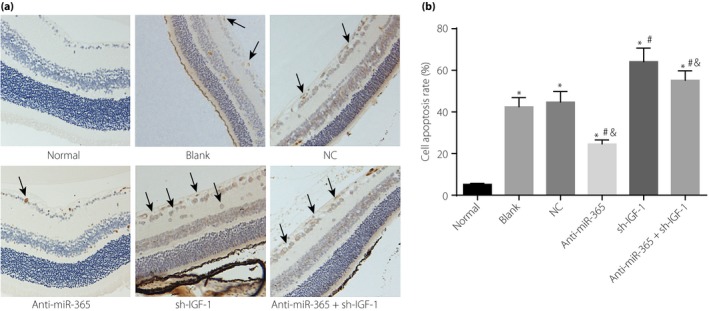
Apoptosis rate of retinal neurons in retinal tissues among six groups. (a) Terminal deoxynucleotidyl transferase dUTP nick‐end labeling staining of retinal neurons in retinal tissues of six groups. (b) The apoptosis rate of retinal neurons in retinal tissues among six groups; the cells shown by black arrows were apoptotic retinal neurons. *P < 0.05, compared with the normal group; # P < 0.05, compared with the blank group; & P < 0.05, compared with the transfected insulin‐like growth factor (IGF‐1) short hairpin ribonucleic acid plasmid (sh‐IGF‐1) group. miR‐365, micro‐ribonucleic acid‐365; NC, negative control.
Discussion
The present study explored the effects of miR‐365 on the apoptosis of retinal neurons by targeting IGF‐1 in diabetic rats through cell transfection and animal models of DR. Consequently, the study shows that miR‐365 promotes the apoptosis of retinal neurons in diabetic rats through IGF‐1, and proposes that miR‐365 might be a potential therapeutic target for DR.
Initially, the present study found that miR‐365 expression was enhanced, but IGF‐1 expression was decreased in diabetes mellitus rats when compared with normal rats. In addition, the dual‐luciferase reporter gene assay confirmed IGF‐1 as the target gene of miR‐365. Consistent with our results, Smith et al.25 showed that miR‐365 was found to target IGF‐1 in osteoblasts by downregulating the activity of IGF‐1 3′UTR reporter. Through depletion of endogenous anti‐oxidant defenses and generation of excess reactive oxygen species, the high‐glucose condition increases the stress in retinal neurons, therefore stimulating the expression of transforming growth factor‐β126. Transforming growth factor‐β1, acting as a profibrotic mediator and angiogenesis factor of DR27, can induce the release and translocation of nuclear factor‐kappa B p65 subunit to promote the actions of nuclear factor‐kappa B26. Furthermore, mitogen‐activated protein kinases and extracellular‐related kinase are also induced by high glucose28. Mitogen‐activated protein kinases/extracellular‐related kinase is highly implicated in early DR and other complications of diabetes mellitus through the induction of inflammatory cytokines, and its control on glucose metabolism is also reported in previous studies29, 30. Another study suggested that upregulated miR‐365 expression is significantly related to the mitogen‐activated protein kinases/extracellular‐related kinase signaling pathway, as well as the nuclear factor‐kappa B signaling pathway31. IGF‐1 level can be a significant marker of glucose, and reduced expression of IGF‐1 associated with glucose homeostasis might be explained by the decreased insulin level resulting from a high‐glucose condition32.
Additionally, we also showed that the downregulation of miR‐365 could suppress apoptosis of retinal neurons by enhancing IGF‐1. Similar results reported that downregulation of miR‐365 in colon cancer and retinoblastoma cells resulted in inhibited cell cycle and promoted cell apoptosis33. It has been found that IGF‐1 levels were reduced in the tissues of diabetic patients, and that IGF‐1 showed an inhibitory effect on glucose‐induced apoptosis in diabetic neuropathy34. Bax is a pro‐apoptotic protein, and enhanced Bax expression was observed in human diabetic retinas35, whereas Bcl‐2 is an anti‐apoptotic protein, and apoptosis in diabetes mellitus was increased after downregulating Bcl‐2 expression36. MiR‐365 was shown to target Bcl‐2, and a positive correlation between IGF‐1 and Bcl‐2 in airway epithelial cells was reported37, 38. In contrast, IGF‐1 can block Bax translocation, with an anti‐oxidative effect in neuronal cells39. Hamada et al.40 argued that Bax is a downstream target of miR‐365. The downregulation of IGF‐1 promotes the translocation of Bax, followed by enhanced high‐glucose‐induced mitochondrial dysfunction and elicited excess reactive oxygen species generation, leading to oxidative stress in retinal neurons41. In contrast, miR‐365 expression was greatly enhanced, causing increased oxidative stress42. All of these might attribute to the apoptosis of diabetic retinal apoptosis.
In conclusion, the present study explored the pro‐apoptosis effects of miR‐365 on retinal neurons in diabetic rats through IGF‐1, evaluating the negative correlation between miR‐365 and IGF‐1, and showing that miR‐365 may represent a potential therapeutic target in DR. However, future studies are required to understand the specific regulation mechanism as a result of the complex pathogenesis of DR.
Disclosure
The authors declare no conflict of interest.
Acknowledgment
This study was supported by Shanghai Municipal Commission of Health and Family Planning (201740088) and National Natural Science Foundations of China (81600704). We thank the reviewers for critical comments.
J Diabetes Investig 2018; 9: 1041–1051
References
- 1. Cohen SR, Gardner TW. Diabetic retinopathy and diabetic macular edema. Dev Ophthalmol 2016; 55: 137–146. [DOI] [PMC free article] [PubMed] [Google Scholar]
- 2. Hautala N, Aikkila R, Korpelainen J, et al Marked reductions in visual impairment due to diabetic retinopathy achieved by efficient screening and timely treatment. Acta Ophthalmol 2014; 92: 582–587. [DOI] [PubMed] [Google Scholar]
- 3. Cho H, Sobrin L. Genetics of diabetic retinopathy. Curr Diab Rep 2014; 14: 515. [DOI] [PMC free article] [PubMed] [Google Scholar]
- 4. Saaddine JB, Honeycutt AA, Narayan KM, et al Projection of diabetic retinopathy and other major eye diseases among people with diabetes mellitus: United States, 2005–2050. Arch Ophthalmol 2008; 126: 1740–1747. [DOI] [PubMed] [Google Scholar]
- 5. Cunha‐Vaz J, Ribeiro L, Lobo C. Phenotypes and biomarkers of diabetic retinopathy. Prog Retin Eye Res 2014; 41: 90–111. [DOI] [PubMed] [Google Scholar]
- 6. Kowluru RA, Kowluru A, Mishra M, et al Oxidative stress and epigenetic modifications in the pathogenesis of diabetic retinopathy. Prog Retin Eye Res 2015; 48: 40–61. [DOI] [PMC free article] [PubMed] [Google Scholar]
- 7. Stitt AW, Lois N, Medina RJ, et al Advances in our understanding of diabetic retinopathy. Clin Sci (Lond) 2013; 125: 1–17. [DOI] [PubMed] [Google Scholar]
- 8. Martin‐Merino E, Fortuny J, Rivero‐Ferrer E, et al Risk factors for diabetic retinopathy in people with Type 2 diabetes: a case‐control study in a UK primary care setting. Prim Care Diabetes 2016; 10: 300–308. [DOI] [PubMed] [Google Scholar]
- 9. Do DV, Wang X, Vedula SS, et al Blood pressure control for diabetic retinopathy. Cochrane Database Syst Rev 2015; 1: CD006127. [DOI] [PMC free article] [PubMed] [Google Scholar]
- 10. Simo R, Sundstrom JM, Antonetti DA. Ocular anti‐VEGF therapy for diabetic retinopathy: the role of VEGF in the pathogenesis of diabetic retinopathy. Diabetes Care 2014; 37: 893–899. [DOI] [PubMed] [Google Scholar]
- 11. Seinen ML, van Nieuw Amerongen GP, de Boer NK, et al Rac1 as a potential pharmacodynamic biomarker for thiopurine therapy in inflammatory bowel disease. Ther Drug Monit 2016; 38: 621–627. [DOI] [PubMed] [Google Scholar]
- 12. Russell ND, Cooper ME. 50 years forward: mechanisms of hyperglycaemia‐driven diabetic complications. Diabetologia 2015; 58: 1708–1714. [DOI] [PubMed] [Google Scholar]
- 13. Mastropasqua R, Toto L, Cipollone F, et al Role of microRNAs in the modulation of diabetic retinopathy. Prog Retin Eye Res 2014; 43: 92–107. [DOI] [PubMed] [Google Scholar]
- 14. Zhao S, Li T, Li J, et al miR‐23b‐3p induces the cellular metabolic memory of high glucose in diabetic retinopathy through a SIRT1‐dependent signalling pathway. Diabetologia 2016; 59: 644–654. [DOI] [PubMed] [Google Scholar]
- 15. Kato M, Castro NE, Natarajan R. MicroRNAs: potential mediators and biomarkers of diabetic complications. Free Radic Biol Med 2013; 64: 85–94. [DOI] [PMC free article] [PubMed] [Google Scholar]
- 16. Lima SA, Pasquinelli AE. Identification of miRNAs and their targets in C. elegans . Adv Exp Med Biol 2014; 825: 431–450. [DOI] [PubMed] [Google Scholar]
- 17. Verma P, Pandey RK, Prajapati P, et al Circulating microRNAs: potential and emerging biomarkers for diagnosis of human infectious diseases. Front Microbiol 2016; 7: 1274. [DOI] [PMC free article] [PubMed] [Google Scholar]
- 18. Qing S, Yuan S, Yun C, et al Serum miRNA biomarkers serve as a fingerprint for proliferative diabetic retinopathy. Cell Physiol Biochem 2014; 34: 1733–1740. [DOI] [PubMed] [Google Scholar]
- 19. Guo W, Han H, Wang Y, et al miR‐200a regulates Rheb‐mediated amelioration of insulin resistance after duodenal‐jejunal bypass. Int J Obes (Lond) 2016; 40: 1222–1232. [DOI] [PMC free article] [PubMed] [Google Scholar]
- 20. Vienberg S, Geiger J, Madsen S, et al MicroRNAs in metabolism. Acta Physiol (Oxf) 2017; 219: 346–361. [DOI] [PMC free article] [PubMed] [Google Scholar]
- 21. Lavin DP, White MF, Brazil DP. IRS proteins and diabetic complications. Diabetologia 2016; 59: 2280–2291. [DOI] [PMC free article] [PubMed] [Google Scholar]
- 22. De Sanctis V, Incorvaia C, Soliman AT, et al Does insulin like growth factor‐1 (IGF‐1) deficiency have a “protective” role in the development of diabetic retinopathy in thalassamia major patients? Mediterr J Hematol Infect Dis 2015; 7: e2015038. [DOI] [PMC free article] [PubMed] [Google Scholar]
- 23. Bassil F, Fernagut PO, Bezard E, et al Insulin, IGF‐1 and GLP‐1 signaling in neurodegenerative disorders: targets for disease modification? Prog Neurobiol 2014; 118: 1–18. [DOI] [PubMed] [Google Scholar]
- 24. Guo SL, Ye H, Teng Y, et al Akt‐p53‐miR‐365‐cyclin D1/cdc25A axis contributes to gastric tumorigenesis induced by PTEN deficiency. Nat Commun 2013; 4: 2544. [DOI] [PMC free article] [PubMed] [Google Scholar]
- 25. Smith SS, Kessler CB, Shenoy V, et al IGF‐I 3' untranslated region: strain‐specific polymorphisms and motifs regulating IGF‐I in osteoblasts. Endocrinology 2013; 154: 253–262. [DOI] [PMC free article] [PubMed] [Google Scholar]
- 26. Madhyastha R, Madhyastha H, Pengjam Y, et al NFkappaB activation is essential for miR‐21 induction by TGFbeta1 in high glucose conditions. Biochem Biophys Res Commun 2014; 451: 615–621. [DOI] [PubMed] [Google Scholar]
- 27. Zorena K, Malinowska E, Raczynska D, et al Serum concentrations of transforming growth factor‐Beta 1 in predicting the occurrence of diabetic retinopathy in juvenile patients with type 1 diabetes mellitus. J Diabetes Res 2013; 2013: 614908. [DOI] [PMC free article] [PubMed] [Google Scholar]
- 28. Ganesh Yerra V, Negi G, Sharma SS, et al Potential therapeutic effects of the simultaneous targeting of the Nrf2 and NF‐kappaB pathways in diabetic neuropathy. Redox Biol 2013; 1: 394–397. [DOI] [PMC free article] [PubMed] [Google Scholar]
- 29. Du Y, Tang J, Li G, et al Effects of p38 MAPK inhibition on early stages of diabetic retinopathy and sensory nerve function. Invest Ophthalmol Vis Sci 2010; 51: 2158–2164. [DOI] [PMC free article] [PubMed] [Google Scholar]
- 30. Zhang W, Thompson BJ, Hietakangas V, et al MAPK/ERK signaling regulates insulin sensitivity to control glucose metabolism in Drosophila. PLoS Genet 2011; 7: e1002429. [DOI] [PMC free article] [PubMed] [Google Scholar]
- 31. Xu Z, Xiao SB, Xu P, et al miR‐365, a novel negative regulator of interleukin‐6 gene expression, is cooperatively regulated by Sp1 and NF‐kappaB. J Biol Chem 2011; 286: 21401–21412. [DOI] [PMC free article] [PubMed] [Google Scholar]
- 32. Thankamony A, Capalbo D, Marcovecchio ML, et al Low circulating levels of IGF‐1 in healthy adults are associated with reduced beta‐cell function, increased intramyocellular lipid, and enhanced fat utilization during fasting. J Clin Endocrinol Metab 2014; 99: 2198–2207. [DOI] [PMC free article] [PubMed] [Google Scholar]
- 33. Wang J, Wang X, Wu G, et al MiR‐365b‐3p, down‐regulated in retinoblastoma, regulates cell cycle progression and apoptosis of human retinoblastoma cells by targeting PAX6. FEBS Lett 2013; 587: 1779–1786. [DOI] [PubMed] [Google Scholar]
- 34. Bazzaz JT, Amoli MM, Taheri Z, et al TGF‐beta1 and IGF‐I gene variations in type 1 diabetes microangiopathic complications. J Diabetes Metab Disord 2014; 13: 45. [DOI] [PMC free article] [PubMed] [Google Scholar]
- 35. Hasnan J, Yusof MI, Damitri TD, et al Relationship between apoptotic markers (Bax and Bcl‐2) and biochemical markers in type 2 diabetes mellitus. Singapore Med J 2010; 51: 50–55. [PubMed] [Google Scholar]
- 36. Gurzov EN, Eizirik DL. Bcl‐2 proteins in diabetes: mitochondrial pathways of beta‐cell death and dysfunction. Trends Cell Biol 2011; 21: 424–431. [DOI] [PubMed] [Google Scholar]
- 37. Nie J, Liu L, Zheng W, et al microRNA‐365, down‐regulated in colon cancer, inhibits cell cycle progression and promotes apoptosis of colon cancer cells by probably targeting Cyclin D1 and Bcl‐2. Carcinogenesis 2012; 33: 220–225. [DOI] [PubMed] [Google Scholar]
- 38. Chand HS, Woldegiorgis Z, Schwalm K, et al Acute inflammation induces insulin‐like growth factor‐1 to mediate Bcl‐2 and Muc5ac expression in airway epithelial cells. Am J Respir Cell Mol Biol 2012; 47: 784–791. [DOI] [PMC free article] [PubMed] [Google Scholar]
- 39. Park YG, Jeong JK, Moon MH, et al Insulin‐like growth factor‐1 protects against prion peptide‐induced cell death in neuronal cells via inhibition of Bax translocation. Int J Mol Med 2012; 30: 1069–1074. [DOI] [PubMed] [Google Scholar]
- 40. Hamada S, Masamune A, Miura S, et al MiR‐365 induces gemcitabine resistance in pancreatic cancer cells by targeting the adaptor protein SHC1 and pro‐apoptotic regulator BAX. Cell Signal 2014; 26: 179–185. [DOI] [PubMed] [Google Scholar]
- 41. Leinninger GM, Backus C, Sastry AM, et al Mitochondria in DRG neurons undergo hyperglycemic mediated injury through Bim, Bax and the fission protein Drp1. Neurobiol Dis 2006; 23: 11–22. [DOI] [PubMed] [Google Scholar]
- 42. Song F, Jia W, Yao Y, et al Oxidative stress, antioxidant status and DNA damage in patients with impaired glucose regulation and newly diagnosed Type 2 diabetes. Clin Sci (Lond) 2007; 112: 599–606. [DOI] [PubMed] [Google Scholar]