

Abstract
Aims/Introduction
Complete mechanisms of renoprotective effects of sodium–glucose cotransporter 2 (SGLT2) inhibitors have not been elucidated yet. Mitochondrial biogenesis is regulated by membrane GTPases, such as optic atrophy factor 1 and mitofusion 2. Here, we investigated whether SGLT2 inhibition in mice fed with a high‐fat diet (HFD) improved mitochondrial morphology and restored mitochondrial biogenesis‐related molecules.
Materials and Methods
Mice were fed a control diet or HFD with or without ipragliflozin treatment. After 16 weeks, the kidneys were taken out and utilized for the analysis.
Results
HFD‐fed mice treated with ipragliflozin showed increased caloric intake and ate more food than the control HFD‐fed mice. Body and kidney weights, and blood glucose levels were not altered by ipragliflozin treatment in HFD‐fed mice. Histological analysis showed that, compared with control mice, HFD‐fed mice displayed tubular vacuolation, dilatation and epithelial cell detachment; ipragliflozin ameliorated these alterations. Furthermore, ultrastructural analysis showed that the tubule mitochondria of HFD‐fed mice exhibited significant damage. Again, ipragliflozin reversed the damage to a normal state, and restored optic atrophy factor 1 and mitofusion 2 levels in HFD‐fed mice. Increased urine 8‐hydroxydeoxyguanosine levels in HFD‐fed mice were suppressed by ipragliflozin as well. In vitro experiments using HK‐2 cells revealed that either high glucose or high palmitate suppressed optic atrophy factor 1 and mitofusion 2 levels. Suppression of SGLT2 by a specific small interfering ribonucleic acid or ipragliflozin restored these GTPase levels to their normal values.
Conclusions
SGLT2 inhibition might act directly on tubular cells and protect kidney tubular cells from mitochondrial damage by metabolic insults regardless of blood glucose levels or improvement in bodyweight reduction.
Keywords: High‐fat diet, Mitochondria, Sodium–glucose cotransporter 2
Introduction
Metabolic syndrome and type 2 diabetes are pandemic. However, effective treatments for the organ failure associated with these health problems have not been found. Sodium–glucose cotransporter 2 (SGLT2) inhibitors are a new class of antidiabetic drugs that have been confirmed to reduce the risk of cardiovascular events and show renoprotective effects in patients with type 2 diabetes.
Empagliflozin Cardiovascular Outcome Event Trial in Type 2 Diabetes Mellitus Patients–Removing Excess Glucose was used to show that empagliflozin suppressed the incidence or worsening of diabetic nephropathy and deterioration of renal function1. Indeed, renal replacement therapy was reduced by 55% in the empagliflozin group1. In addition, the Canagliflozin Cardiovascular Assessment Study trial showed that canagliflozin significantly reduced cardiovascular risk, reduced the urinary albumin excretion rate, resulted in a 40% reduction in the composite renal replacement therapy and reduced renal death2. The SGLT2 inhibitor, empagliflozin, has been shown to attenuate renal hyperfiltration in individuals with type 1 diabetes, likely by affecting tubuloglomerular feedback mechanisms3. Such attenuation of hyperfiltration with SGLT2 inhibitors is likely a class effect of all SGLT2 inhibitors, and is the most sophisticated explanation for the renoprotective effects of SGLT2 inhibitors. However, various potential renoprotective effects of SGLT2 inhibitors have been proposed in experimental animal models.
The kidney is an organ with a high energy demand and is rich in mitochondria4. In addition, persistent mitochondrial dysfunction can also lead to chronic deficiencies in cell and organ function similar to disorders of the heart, brain and kidney, which are organs known to be associated with mitochondrial disease. Mitochondrial dysfunction causes podocyte injury, tubular epithelial cell damage and endothelial dysfunction5. Mitochondrial fusion and fission are necessary not only for mitochondrial morphology maintenance, but also for mitochondrial deoxyribonucleic acid (DNA) integrity, regulating cellular survival and death, transmitting redox‐sensitive signals, and participating in metabolic processes. Mitochondrial fusion depends on mitofusion (Mfn)1 or Mfn2 and the dynamin family GTPase optic atrophy factor 1 (Opa1)6. Dynamin‐related protein‐1 (Drp‐1) is required for mitochondrial fission in mammalian cells7, 8. The proximal tubules in the kidney have many mitochondria that are in a more oxidized state than those in the distal tubule segments in which tubules can utilize glycolysis as their main energy source9. Mitochondrial dysfunction was shown to occur in insulin resistance associated with high‐fat diet (HFD)‐induced oxidative stress in mice10.
Here, we show that in mice fed a HFD, the SGLT2 inhibitor improves proximal tubular cell integrity through modulation of mitochondrial damage.
Methods
Animal experimental model
Eight‐week‐old male C57/BL6 mice (Sankyo Lab Service, Tokyo, Japan) were utilized in all experiments. The mice were first fed a control diet or HFD (60% fat; Research Diets Inc., New Brunswick, NJ, USA) for 8 weeks. After 8 weeks of being on the HFD, the HFD‐induced obese mice were divided into two groups: HFD with vehicle (0.5% methylcellulose) or HFD with oral ipragliflozin administration (HFD ipra; 10 mg/kg; Figure 1a). All mice were euthanized 16 weeks after HFD feeding. Ipragliflozin was provided by Astellas (Astellas Pharma Inc., Tokyo, Japan) with a co‐research agreement. The bodyweight and blood glucose levels (Antsence III; Fukuda Denshi Co., Tokyo, Japan) were monitored every week. The amount of food intake was measured every 2 days. Urinary 8‐hydroxydeoxyguanosine (8‐OHdG) levels were measured according to the manufacturer's protocol (Japan Institute for the Control of Aging [JaICA], Shizuoka, Japan). The animal experiment was approved by the Institutional Animal Care and Use Committee of Kanazawa Medical University (protocol number. 2014‐86).
Figure 1.
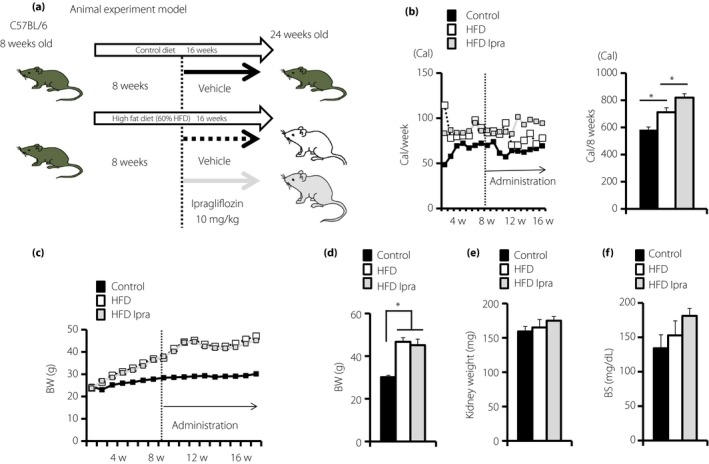
Animal model and characteristics of each group of mice. (a) The animal model. Eight‐week‐old male C57/BL6 mice were divided into the control, high‐fat diet (60% HFD/Research diet), and high‐fat diet and ipragliflozin groups. Ipragliflozin was administered to HFD mice (10 mg/kg) when they were 16–24 weeks‐of‐age. All mice were euthanized at 24 weeks‐of‐age (n = 6–8). (b) Follow up of food intake (n = 6–8). (c,d) Bodyweight (BW) was measured every week, and (e) kidney weights and (f) serum blood glucose levels were measured at 24 weeks‐of‐age (n = 6–8). The values are expressed as the mean ± standard error of the mean for the animals in each group, P < 0.05. BS, blood glucose levels; HFD, high‐fat diet; Ipra, ipragliflozin.
Electron microscopy
Kidney tissues were fixed in 0.1 mol/L cacodylate acid with 2% glutaraldehyde at 4°C and dehydrated at room temperature. Electron microscopy and transmission electron microscopy were carried out by the Hanaichi Ultrastructure Research Institute (Aichi, Japan). The mitochondrial morphology was imaged and analyzed using ImageJ software (National Institutes of Health, Bethesda, MD, USA).
Western blot analysis
Proteins were harvested using radioimmunoprecipitation assay lysis buffer (lysis buffer, phenylmethylsulfonyl fluoride, protease inhibitor cocktail and sodium orthovanadate, which were purchased from Santa Cruz Biotechnology (Dallas, TX, USA). Protein lysates in sample buffer were boiled at 94°C for 5 min, and the lysates were separated on sodium dodecylsulfate‐polyacrylamide gels and transferred onto polyvinylidene fluoride membranes (Pall Corporation, Pensacola, FL, USA) by using the semidry method. After blocking with Tris‐buffered saline with Tween 20 containing 5% non‐fat dry milk or 5% bovine serum albumin, the membranes were incubated with primary antibodies (SGLT2 1:50, Opa1 1:1000, Mfn2 1:1000, Drp‐1 1:800 dilution) at 4°C overnight. The membranes were washed with Tris‐buffered saline with Tween 20 three times and then incubated with HRP‐conjugated secondary antibodies for 1 h at room temperature. After washing with Tris‐buffered saline with Tween 20 three times, the blots were developed with an enhanced chemiluminescence detection system (Pierce Biotechnology, Rockford, IL, USA) and visualized using an ImageQuant LAS 400 camera system (GE Healthcare Life Sciences, Uppsala, Sweden). Antibodies were purchased from following (SGLT2:#GTX59872 (GeneTex, Inc. Irvine, CA, USA), Opa1:#ab119685 and Mfn2:#ab56889 (Abcam, Cambridge, UK), Drp‐1:#8570 (Cel Signaling Technology, Danvers, MA, USA)).
Cell culture
HK‐2 cells (human proximal endothelial cells) were cultured in medium (Opti‐MEM, Manassa, VA, USA) with epidermal growth factor human recombinant and bovine pituitary extract. Palmitate (P0500; Sigma, St. Louis, MO, USA) was dissolved in 0.1% dimethyl sulfoxide into final stock concentration 10 mmol/L11, 12, and dimethyl sulfoxide was used as the control. In the presence or absence of SGLT2 inhibitor or small interfering ribonucleic acid (siRNA)‐mediated knockdown of SGLT2, palmitate (adjusted to 150 μmol/L) or high glucose (30 mmol/L) were incubated in media for 48 h.
Transfection experiment
HK‐2 cells were transfected with siRNA (100 nmol/L) targeting SGLT2 (Invitrogen, Carlsbad, CA, USA; SGLT2: 5′‐GUCAUUGCUGCAUAUUUCC). When the cells were 70% confluence, Lipofectamine 2000 (following the manufacturer's instructions; Invitrogen, Carlsbad, CA, USA) and the target RNA were added to the keratinocyte‐SFM (1X; Life Technologies, Green Island, NY, USA) and incubated in cell culture for 6 h. The medium was replaced with fresh medium with or without high glucose (30 mmol/L) or palmitate (150 μmol/L) treatment for 48 h.
Mito‐tracker green staining
The treated HK‐2 cells were cultured in eight‐well culture slides. When the cells reached 80–90% confluence, we removed the medium and added pre‐warmed MitoTracker® Green (100 nmol/L; Invitrogen) for 30 min at 37°C. After being washed twice with phosphate‐buffered saline, the cells were fixed by 4% formaldehyde and permeated by TritonR X‐100. Slides were washed two times by phosphate‐buffered saline and then mounted with mounting medium containing 4′,6‐diamidino‐2‐phenylindole (Vector Laboratories, Burlingame, CA, USA).
Statistical analysis
The data are expressed as the mean ± standard error of the mean. One‐way anova followed by Tukey's multiple comparison test (statistical significance was defined as P < 0.05) was used for statistical analysis using the GraphPad Prism software (Ver 5.0f; La Jolla, CA, USA).
Results
To elucidate whether SGLT2 inhibitors induced renoprotective effects regardless of improvements in metabolic status or bodyweight, we analyzed ad libitum HFD‐fed mice, the model of metabolic syndrome and type 2 diabetes with insulin resistance. In HFD‐fed mice, caloric intake and bodyweight increased compared with those of control‐fed mice (Figure 1b–d). Kidney weights and blood glucose levels appeared to be unchanged (Figure 1e,f). Interestingly, ipragliflozin‐treated HFD‐fed mice had increased dietary food intake compared with the HFD group (Figure 1b). Consistent with the enhanced food intake in ipragliflozin‐treated mice, there was no reduction in bodyweight by ipragliflozin treatment in the HFD group (Figure 1c). Kidney weights and blood glucose levels were not significantly altered by ipragliflozin in HFD‐fed mice (Figure 1d–f).
Compared with control diet‐fed mice, the mice in the HFD group showed tubular vacuolation, tubular dilatation and tubular epithelial cell detachment. Ipragliflozin ameliorated these alterations (Figure 2a). The ultrastructural analysis of the kidney by transmission electron microscopy showed rounded and fragmented mitochondria in HFD‐fed mice when compared with control‐fed mice (Figure 2a). The mitochondrial inner membrane was also broken in the HFD group (Figure 2a). The mitochondrial damage was ameliorated by ipragliflozin treatment (Figure 2a). Mitochondrial dysfunction can accelerate glycolysis and oxidative stress, and mitochondrial abnormalities are induced by oxidative stress in metabolically abnormal mice fed an HFD13. Oxidative stress reduced Opa1 levels and disrupted mitochondrial morphological dynamic alterations14. Therefore, we analyzed mitochondrial membrane GTPase protein expression by western blot analysis.
Figure 2.
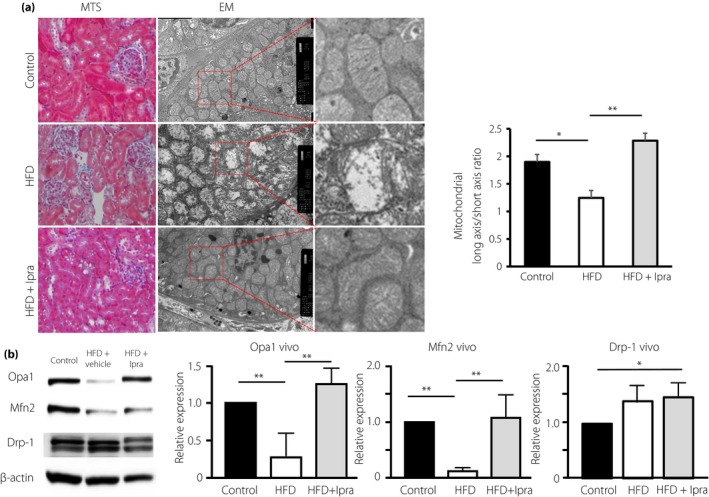
Proximal morphology and activity of the mitochondrial GTPase. (a) Masson's trichrome stain (MTS; magnification: ×400) and electron microscopy (EM) analysis. Mitochondrial morphology (long/short axis ratio) was analyzed using ImageJ software. (b) Protein expression levels of Opa1 and mitofusion 2 (Mfn2) and dynamin‐related protein1 (Drp‐1) in the kidney were analyzed by western blot analysis. (c–e) Densitometric analysis of the western blot was normalized to β‐actin (n = 3 in each group). The values are expressed as the mean ± standard error of the mean for animals in each group. HFD, high‐fat diet; Ipra, ipragliflozin.
In the HFD group, the levels of Opa1 and Mfn2, the GTPases related to mitochondrial fusion, were decreased (Figure 2b). Drp‐1, the GTPase related to mitochondrial fission, was increased in the HFD group (Figure 2b). In the ipragliflozin group, Opa1 and Mfn2 were restored (Figure 2b). HFD‐induced Drp‐1 levels were not significantly altered by ipragliflozin (Figure 2b).
Mitochondrial damage and deficiency in either Opa1 or Mfn2 induced oxidative stress. In regard to this, urinary 8‐OHdG, an oxidative stress marker, was increased in the HFD group, and ipragliflozin treatment restored the levels to those seen in control mice (Figure 3). 8‐OHdG is produced when DNA is damaged by oxidative stress. Because mitochondrial DNA has a single‐stranded circular structure, mitochondrial DNA is less protected against oxidative stress15, 16.
Figure 3.
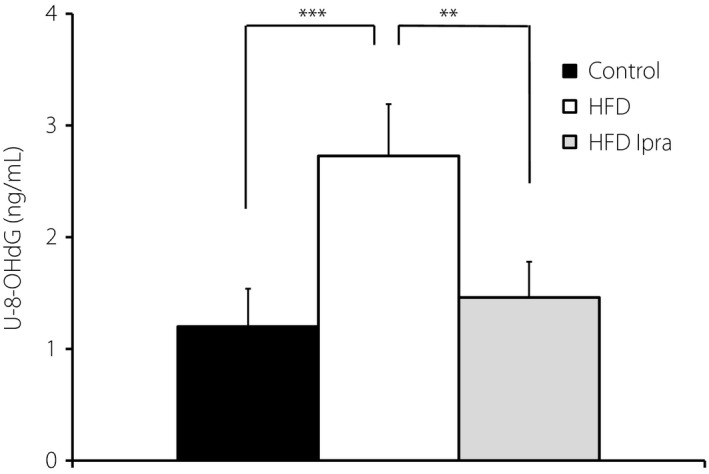
The concentration of 8‐hydroxydeoxyguanosine (8‐OHdG) in urine (U‐8‐OHdG). Urine was collected in a metabolic cage for 24 h. Urinary 8‐OHdG levels were analyzed by using a commercially available kit according to the manufacturer's instructions. The values are expressed as the mean ± standard error of the mean for animals in each group (n = 6 in each group). **P < 0.01; ***P < 0.005. HFD, high‐fat diet; Ipra, ipragliflozin.
To validate the effects of SGLT2 inhibition on tubular mitochondria, we carried out an in vitro analysis utilizing tubular epithelial cell line HK‐2 cells. We first examined the effect of SGLT2 inhibition on the expression of the glucose‐regulated mitochondrial membrane GTPase protein in proximal tubular cells. Incubation in a high‐glucose (HG) medium (30 mmol/L) significantly suppressed Mfn2 and Opa1 protein levels (Figure 4a–c) in HK‐2 cells. SGLT2 knockdown using a specific siRNA in HK‐2 cells restored HG‐suppressed Mfn2 and Opa1 levels (Figure 4a–c). Furthermore, the incubation with palmitate remarkably decreased the expression of Mfn2 and Opa1 in HK‐2 cells (Figure 4d–f); in the presence of the SGLT2 inhibitor ipragliflozin, palmitate lost its effect on Mfn2 and Opa1 levels in HK‐2 cells (Figure 4d–f), suggesting that the free fatty acid‐altered mitochondrial membrane GTPase protein in proximal tubular cells relies on the glucose uptake mediated by SGLT2. HG and palmitate combination media significantly disrupted mitochondria in HK‐2 cells analyzed by mitotracker green; either ipragliflozin or SGLT2 siRNA restored the expression of mitochondria (Figure 5a,b).
Figure 4.
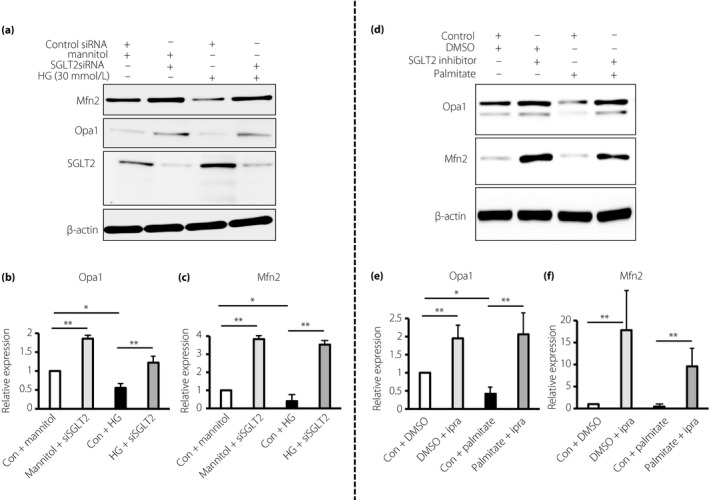
Sodium–glucose cotransporter 2 (SGLT2) knockdown or SGLT2 inhibition improved the expression levels of mitochondrial GTPase under the high glucose or palmitate condition. Western blot analysis for (a–c) mitochondrial GTPase expression and SGLT2 suppression by small interfering SGLT2 (siSGLT2) or (d–f) inhibition by ipragliflozin (10 nmol/L) incubated in (a–c) high‐glucose (HG) medium (30 mmol/L) or (d–f) palmitate (150 μmol/L) for 48 h. (a–c) HK‐2 cells were transfected with small interfering ribonucleic acid (siRNA; 100 nmol/L) targeting SGLT2 or control scramble. For (d–f), dimethyl sulfoxide was used as the control. The harvested proteins were analyzed by western blot analysis. Densitometric analysis of the western blot was normalized to β‐actin (n = 3 in each group). The values are expressed as the mean ± standard error of the mean for animals in each group. *P < 0.05; **P < 0.01. Con, control group; DMSO, dimethyl sulfoxide; Ipra, ipragliflozin; Mfn2, mitofusion 2.
Figure 5.
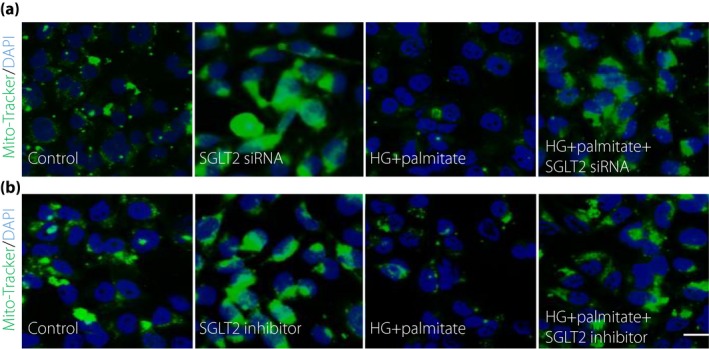
Sodium–glucose cotransporter 2 (SGLT2) deficiency restored the high‐glucose (HG) and palmitate combination‐suppressed mitochondrial expression. MitoTracker Green assay analysis of mitochondrial expressions after (a) SGLT2 small interfering ribonucleic acid (siRNA) or (b) ipragliflozin with or without HG and palmitate treatment in HK‐2 cells. For each slide, six different fields of view at ×400 magnification were evaluated. Scale bar, 80 μm. Representative data from three independent analyses are shown. DAPI, 4′,6‐diamidino‐2‐phenylindole.
Discussion
In the present study, we found that ipragliflozin affected kidney tubular mitochondrial homeostasis independently from either bodyweight reduction or glucose‐lowering effect. Here, we showed the following: (i) in HFD‐fed mice, mitochondria kidney proximal tubular cells were damaged and ipragliflozin restored normal mitochondrial morphology; (ii) small GTPases – Opa1 and Mfn2 – that are important for mitochondrial fusion, were reduced in HFD‐fed mice kineys, but ipragliflozin restored them; (iii) ipragliflozin suppressed oxidative stress evaluated by urinary 8‐OHdG in HFD‐fed mice; and (iv) in in vitro culture proximal tubular cell line HK‐2 cells, suppression of SGLT2 restored mitochondrial biogenesis in HG or/and high‐palmitate media associated with normalization of Opa1 and Mfn2 levels. These data shed light on novel insights into the molecular mechanisms of the renoprotective effects of SGLT2 inhibitors in diabetes patients.
To understand the renoprotective effects of SGLT2 inhibition, we might require separate interpretation of the in vivo and in vitro models in our study. HFD has been shown to induce a metabolic abnormality that suppressed both Opa1 and Mfn2 levels17. According to a recent report, Opa1, which plays a key role in mitochondrial fusion and participates in cristae remodeling, was increased by insulin signals18. Interestingly, Mfn2 deficiency led to oxidative stress that contributed to the onset of insulin resistance; overexpression of Mfn2 suppressed the insulin resistance induced by palmitate in rat skeletal muscle cells19. Interestingly, these data suggested that Mfn2 could restore Opa1 levels in vivo through amelioration of insulin signaling; another report stated Mfn2 itself contributes in the degradation process of Opa120. Molecular deficiencies related to mitochondrial biogenesis subsequently induced mitochondrial defects. Mitochondrial defects or the HFD‐diet itself21 caused oxidative stress, a key inducer of mitochondrial damage. Ipragliflozin intervention inhibited such a vicious cycle by restoring Opa1 and Mfn2 levels to normal values in vivo without altering blood glucose levels or reducing bodyweight. In contrast, HFD‐induced Drp‐1 overexpression was not altered by ipragliflozin in vivo. Although the mechanisms by which Drp‐1 expression could not be restored by the inhibition of SGLT2 are still unclear, systemic metabolic alterations, such as improvement of insulin resistance and lipid metabolism, could be responsible for such altered regulation between Opa1, Mfn2 and Drp‐1 in vivo 19, 20.
In vitro, our data showed the presence of metabolic insults with either HG or high palmitate, and mitochondrial biogenesis is significantly diminished by the loss of mitochondrial fusion proteins. Inhibition of SGLT2 can inhibit the effect of these metabolic insults by preventing the loss of these molecules and restoring mitochondrial homeostasis. Even though we utilized HFD‐fed mice as a model for metabolic syndrome or type 2 diabetes that showed insulin resistance with metabolic defects, fundamentally, ipragliflozin directly acted on the proximal tubule of the kidney. Therefore, the effects of ipragliflozin on Opa1 and Mfn2 in kidney tubules should be based on the inhibition of glucose influx into the tubular cells. In regard to this, the in vitro experiment using HG or/and high‐palmitate media experiments supported such local effects of ipragliflozin or SGLT2 suppression.
There was a significant limitation to the present study. In regard to in vivo models, we believed some of the effects of ipraliflozin could be associated with the amelioration of insulin resistance in HFD‐fed animals. However, we did not see direct evidence of such alterations, as initially we did not thing such an amelioration of insulin resistnace could affect the mitochondrial phenotyope of our experimental set. For complete understanding, we should utilize some interventions, such as metformin, pioglitazone or exercise, to adjust the levels of insulin resistance together with the ipragliflozin group as a reference. However, this could be beyond of our the of the present study. Second, our in vitro study clearly showed metabolic insults, HG or/and high‐palmitate media, and induced mitochondrial defects with deficiencies in Opa1 and Mfn2. However, the mechanisms by which glucose influx into tubular cells affected such alterations in these GTPase were not entirely clear. Son et al.22 reported that higher glycolysis showed a close association with suppressed levels of Opa1 and Mfn2; therefore, high metabolic stress induced by HG or/and high‐palmitate conditions could induce higher demand for glycolysis in the kidney tubule. However, the presence of glycolysis in the proximal tubule has been under intense debate23, even though recent analysis showed a pathological significance of glycolysis in the kidney proximal tubule24, 25, 26, 27. To answer these questions, further studies are obviously required.
In conclusion, we showed that SGLT2‐mediated uptake of glucose diminished mitochondrial homeostasis and found a novel, potentially renoprotective effect of ipragliflozin.
Disclosure
The funding source collaborated with the authors in data interpretation and writing of the report. TT is an employee of Astellas Pharma Inc. KK and DK received lecture honoraria from Astellas Pharma Inc.
Acknowledgments
Essentially, this work was supported by a grant from Astellas Pharma Inc. This work was also partially supported by grants from the Japan Society for the Promotion of Science for KK (23790381 and 23790381) and DK (25282028 and 25670414). This work was partially supported by a Grant for Promoted Research awarded to KK (S2015‐3, S2016‐3 and S2017‐1) from Kanazawa Medical University. Boehringer Ingelheim, Mitsubishi‐Tanabe Pharma and Ono Pharmaceutical contributed to establishing the Division of Anticipatory Molecular Food Science and Technology. KK is under a consultancy agreement with Boehringer Ingelheim.
J Diabetes Investig 2018; 9: 1025–1032
References
- 1. Wanner C, Inzucchi SE, Lachin JM, et al Empagliflozin and progression of kidney disease in type 2 diabetes. N Engl J Med 2016; 375: 323–334. [DOI] [PubMed] [Google Scholar]
- 2. Neal B, Perkovic V, Mahaffey KW, et al Canagliflozin and cardiovascular and renal events in type 2 diabetes. N Engl J Med 2017; 377: 644–657. [DOI] [PubMed] [Google Scholar]
- 3. Cherney D, Cooper M, Tikkanen I, et al Contrasting influences of renal function on blood pressure and HbA1c reductions with empagliflozin in patients with type 2 diabetes and hypertension. Circulation 2014; 129: 587–597.24334175 [Google Scholar]
- 4. Weinberg JM, Venkatachalam MA, Roeser NF, et al Mitochondrial dysfunction during hypoxiayreoxygenation and its correction by anaerobic metabolism of citric acid cycle intermediates. PNAS 2000; 97: 2826–2831. [DOI] [PMC free article] [PubMed] [Google Scholar]
- 5. Che R, Yuan Y, Huang S, et al Mitochondrial dysfunction in the pathophysiology of renal diseases. Am J Physiol Renal Physiol 2014; 306: F367–F378. [DOI] [PubMed] [Google Scholar]
- 6. Chan DC. Mitochondria: dynamic organelles in disease, aging, and development. Cell 2006; 125: 1241–1252. [DOI] [PubMed] [Google Scholar]
- 7. Smirnova E. Dynamin‐related protein Drp1 is required for mitochondrial division in mammalian cells. Mol Biol Cell 2001; 12: 2245–2256. [DOI] [PMC free article] [PubMed] [Google Scholar]
- 8. Hu Q, Li J, Nitta K, et al FGFR1 is essential for N‐acetyl‐seryl‐aspartyl‐lysyl‐proline regulation of mitochondrial dynamics by upregulating microRNA let‐7b‐5p. Biochem Biophys Res Commun 2017; 495: 2214–2220. [DOI] [PubMed] [Google Scholar]
- 9. Hall AM, Unwin RJ, Parker N, et al Multiphoton imaging reveals differences in mitochondrial function between nephron segments. J Am Soc Nephrol 2009; 20: 1293–1302. [DOI] [PMC free article] [PubMed] [Google Scholar]
- 10. Bonnard C, Durand A, Peyrol S, et al Mitochondrial dysfunction results from oxidative stress in the skeletal muscle of diet‐induced insulin‐resistant mice. J Clin Invest 2008; 118: 789–800. [DOI] [PMC free article] [PubMed] [Google Scholar]
- 11. Sharma S, Kanwar K, Kanwar SS. Ascorbyl palmitate synthesis in an organic solvent system using a Celite‐immobilized commercial lipase (Lipolase 100L). 3 Biotech 2016; 6: 183. [DOI] [PMC free article] [PubMed] [Google Scholar]
- 12. López C, Cruz‐Izquierdo A, Picó EA, et al Magnetic biocatalysts and their uses to obtain biodiesel and biosurfactants. Front Chem 2014; 2: 72. [DOI] [PMC free article] [PubMed] [Google Scholar]
- 13. Lenaz G. Role of mitochondria in oxidative stress and ageing. Biochim Biophys Acta 1998; 1366: 53–67. [DOI] [PubMed] [Google Scholar]
- 14. Liu H, Mao P, Wang J, et al Allicin protects PC12 cells against 6‐OHDA‐induced oxidative stress and mitochondrial dysfunction via regulating mitochondrial dynamics. Cell Physiol Biochem 2015; 36: 966–979. [DOI] [PubMed] [Google Scholar]
- 15. Richter C, Park J‐W, Ames BN. Normal oxidative damage to mitochondrial and nuclear DNA is extensive. Proc Natl Acad Sci USA 1988; 85: 6465–6467. [DOI] [PMC free article] [PubMed] [Google Scholar]
- 16. Shimazu T, Hirschey MD, Newman J, et al Suppression of oxidative stress by beta‐hydroxybutyrate, an endogenous histone deacetylase inhibitor. Science 2013; 339: 211–214. [DOI] [PMC free article] [PubMed] [Google Scholar]
- 17. Khraiwesh H, Lopez‐Dominguez JA, Lopez‐Lluch G, et al Alterations of ultrastructural and fission/fusion markers in hepatocyte mitochondria from mice following calorie restriction with different dietary fats. J Gerontol A Biol Sci Med Sci 2013; 68: 1023–1034. [DOI] [PMC free article] [PubMed] [Google Scholar]
- 18. Parra V, Verdejo HE, Iglewski M, et al Insulin stimulates mitochondrial fusion and function in cardiomyocytes via the Akt‐mTOR‐NFκB‐Opa‐1 signaling pathway. Diabetes 2014; 63: 75–88. [DOI] [PMC free article] [PubMed] [Google Scholar]
- 19. Nie Q, Wang C, Song G, et al Mitofusin 2 deficiency leads to oxidative stress that contributes to insulin resistance in rat skeletal muscle cells. Mol Biol Rep 2014; 41: 6975–6983. [DOI] [PubMed] [Google Scholar]
- 20. Sood A, Jeyaraju DV, Prudent J, et al A Mitofusin‐2–dependent inactivating cleavage of Opa1 links changes in mitochondria cristae and ER contacts in the postprandial liver. Proc Natl Acad Sci USA 2014; 111: 16017–16022. [DOI] [PMC free article] [PubMed] [Google Scholar]
- 21. Du Z, Yang Y, Hu Y, et al A long‐term high‐fat diet increases oxidative stress, mitochondrial damage and apoptosis in the inner ear of d‐galactose‐induced aging rats. Hear Res 2012; 287: 15–24. [DOI] [PubMed] [Google Scholar]
- 22. Son JM, Sarsour EH, Kakkerla Balaraju A, et al Mitofusin and optic atrophy shift metabolism to mitochondrial respiration during aging. Aging Cell 2017; 16: 1136–1145. [DOI] [PMC free article] [PubMed] [Google Scholar]
- 23. Hato T, Friedman AN, Mang H, et al Novel application of complementary imaging techniques to examine in vivo glucose metabolism in the kidney. Am J Physiol Renal Physiol 2016; 310: F717–F725. [DOI] [PMC free article] [PubMed] [Google Scholar]
- 24. Mandel LJ. Metabolic substrates, cellular energy production, and the regulation of proximal tubular transport. Annu Rev Physiol 1985; 47: 85–101. [DOI] [PubMed] [Google Scholar]
- 25. Wirthensohn G, Guder WG. Renal substrate metabolism. Physiol Rev 1986; 66: 469–497. [DOI] [PubMed] [Google Scholar]
- 26. Kim J, Devalaraja‐Narashimha K, Padanilam BJ. TIGAR regulates glycolysis in ischemic kidney proximal tubules. Am J Physiol Renal Physiol 2015; 308: F298–F308. [DOI] [PMC free article] [PubMed] [Google Scholar]
- 27. Greer SN, Metcalf JL, Wang Y, et al The updated biology of hypoxia‐inducible factor. EMBO J 2012; 31: 2448–2460. [DOI] [PMC free article] [PubMed] [Google Scholar]