

Abstract
Aims/Introduction
A decrease in the size of the pancreas is observed in islet autoantibody‐positive non‐diabetic donors and acute‐onset type 1 diabetes irrespective of the diabetes duration. Little is known, however, about the relationship between the size of the pancreas and type 1 diabetes subtypes, including fulminant type 1 diabetes.
Materials and Methods
We examined the pancreatic volume (PV) in 44 adult patients with type 1 diabetes (16 acute‐onset type 1 diabetes, 18 slowly progressive type 1 diabetes and 10 fulminant type 1 diabetes) and 39 age‐ and body mass index‐matched non‐diabetic controls. PV was measured by computed tomography. The ability to secrete insulin was assessed by stimulated C‐peptide after intravenous glucagon administration.
Results
PV was significantly correlated with bodyweight in both control participants and type 1 diabetes patients. The PV index (PVI; PV/bodyweight) was decreased by 39% in type 1 diabetes compared with that in controls. PVI was significantly decreased in acute‐onset type 1 diabetes patients and slowly progressive type 1 diabetes patients (both P < 0.0001), but not in fulminant type 1 diabetes patients (P = 0.10), compared with control participants. In cases patients with recent‐onset type 1 diabetes (0–7 days post‐diagnosis), PVI was significantly decreased in acute‐onset type 1 diabetes patients (n = 8, P = 0.0005), but not in fulminant type 1 diabetes patients (n = 7, P = 0.44), compared with controls. PVI showed no correlations with the diabetes duration, C‐peptide levels, glycated hemoglobin, glutamic acid decarboxylase autoantibody levels, serum amylase or daily total insulin dose in type 1 diabetes subtypes.
Conclusions
The present results show that patients with acute‐onset type 1 diabetes and slowly progressive type 1 diabetes have small pancreases irrespective of the diabetes duration or C‐peptide levels. In contrast to earlier findings on acute‐onset type 1 diabetes, we found no reduction of PVI at the onset of fulminant type 1 diabetes.
Keywords: Fulminant type 1 diabetes, Pancreatic volume, Type 1 diabetes
Introduction
Type 1 diabetes is caused by an autoimmune‐mediated destruction of insulin‐producing β‐cells. Exocrine abnormalities in the morphology, pathology and function of the type 1 diabetes pancreas have been reported several times over the past decades1, 2, 3. Reduced pancreatic weight has been shown in patients with various subtypes of type 1 diabetes at autopsy4, 5. Recent radiographic imaging modalities, such as computed tomography (CT)6, 7 and magnetic resonance imaging8, 9, 10 have also shown reduced pancreatic volume (PV) in patients with acute‐onset type 1 diabetes. Reduced PV has recently been observed in adults with newly diagnosed acute‐onset type 1 diabetes9 and islet autoantibody‐positive non‐diabetic donors (before the onset of type 1 diabetes)11.
An absence of insulinotropic effects on pancreatic exocrine tissue has been proposed as a possible mechanism for reduced PV in type 1 diabetes1, 2, 3, 12. Previous reports, however, have shown no close relationship between acinar atrophy and surviving β‐cells13. Indeed, our group found that the pancreatic weight was reduced in patients with slowly progressive type 1 diabetes14 (otherwise known as latent autoimmune diabetes in adults), regardless of the number of residual β‐cells in autopsy specimens4. However, little is known about the correlation between the size of the pancreas (weight/volume) and β‐cell function in patients with type 1 diabetes.
Fulminant type 1 diabetes is characterized by an extremely rapid onset, a near‐normal glycated hemoglobin (HbA1c) level at diagnosis and almost no residual insulin secretion from just after onset15. Elevated titers of immunoglobulin A antibodies to enterovirus16 and the presence of enteroviral capsid protein VP117 in the islets at diabetes onset have prompted speculation that enterovirus viral infection plays a crucial role in the pathogenesis of fulminant type 1 diabetes. To our knowledge, no reports have been reported on PV in recent‐onset patients with fulminant type 1 diabetes. We carried out the current study to examine the relationship between pancreas size and subtypes of type 1 diabetes, including fulminant type 1 diabetes, based on multidetector CT images, and then to clarify the correlation between PV and endocrine pancreatic function assessed by glucagon stimulation in type 1 diabetes.
Methods
Participants
A total of 44 patients with type 1 diabetes and 39 age‐ and body mass index (BMI)‐matched controls from Showa University Hospital, Tokyo, Japan, were selected for enrollment in the present retrospective study. Based on diagnostic criteria and clinical information at diabetes onset, the patients were classified into three type 1 diabetes subtypes: acute‐onset type 1 diabetes18, slowly progressive type 1 diabetes19 and fulminant type 1 diabetes18. The non‐diabetic control participants met the following criteria: (i) blood glucose levels <110 mg/dL in fasting or <140 mg/dL after eating; and (ii) HbA1c value of <6.0%. The exclusion criteria were as follows: (i) aged <20 years or >80 years; (ii) pancreatic disease, including acute pancreatitis; and (iii) a history of alcohol abuse. The non‐diabetic control participants for the current study were selected randomly from patients who had undergone abdominal CTs for medical indications. The non‐diabetic control participants underwent the following procedures or treatments for the following conditions: screening for pulmonary embolism (n = 8), esophageal cancer (n = 7), gastric cancer (n = 4), lung cancer (n = 4), primary aldosteronism (n = 3), rectal cancer (n = 2), colon cancer (n = 2), appendicitis (n = 3), kidney stone (n = 1), inguinal hernia (n = 1), germ cell tumor (n = 1), liver hemangioma (n = 1), small intestine ileus (n = 1), nephrotic syndrome (n = 1), assessment and screening for acute abdominal pain (n = 1).
The study was approved by the ethics committee of the Showa University School of Medicine.
Pancreatic volume measurement
CT images were acquired using standard clinical protocol for abdominal/pelvis CT by a multidetector CT (LightSpeed Plus [4DAS] or LightSpeed Plus, GE Healthcare Japan, Tokyo, Japan; SOMATOM Definition AS+ or SOMATOM Sensation64, Siemens Healthcare, Erlangen, Germany). CT scans were carried out at a tube voltage of 120 kVp, tube current of 180–200 mA (with partial auto‐exposure control), tube rotation of 0.5–0.8 s/rotation, pitch factor of 0.6–1.5 and scanning time of 6.2–16 s. From these CT scans, 5‐mm axial images were obtained. PV was calculated from contrast‐enhanced CT or non‐contrast‐enhanced CT images. Iodine contrast medium (Iomeron 300, Eisai, Tokyo, Japan; Omnipaque 300, Daiichi‐Sankyo, Tokyo, Japan; Iopamiron 300, Bayer Health Care, Leverkusen, Germany) was intravenously injected at a rate of 3.0 mL/s by a power injector. The pancreas was manually outlined on axial image slices using Ziostation2® (Ziosoft Inc., Tokyo, Japan). The areas of the slices were summed throughout the volume of the pancreas. The images were analyzed by one experienced radiologist (HS) with no knowledge of the patients’ medical records or histories. The mean intraobserver CV of the pancreatic volume (five cases studied on five different occasions) was 3.0% (range 2.4–3.8%). The interobserver CV of the PV was calculated by another radiologist (JM) with 8 years of experience in abdominal imaging. The mean interobserver CV of the PV (five cases studied) was 2.7% (range 0.3–4.6%).
Laboratory analysis
Blood samples were taken in the morning after a 12‐h overnight fast. HbA1c (%) was estimated as a National Glycohemoglobin Standardization Program‐equivalent value (%) calculated by the following formula: HbA1c (%) = HbA1c (Japan Diabetes Society) (%) + 0.4%20. Fasting C‐peptide and the 6‐min value of C‐peptide after glucagon (1 mg) stimulation (stimulated C‐peptide) were measured at the time the CT scans were carried out. Serum C‐peptide, serum amylase or creatinine and fasting plasma glucose levels were measured by immunoenzymometric assay and the glucose oxidase method, respectively.
Glutamic acid decarboxylase autoantibody levels were measured by a radioimmunoassay (RIA) and/or enzyme‐linked immunosorbent assay method21, 22, with cut‐off values of 1.5 U/mL (RIA) and 5.0 U/mL (enzyme‐linked immunosorbent assay). Insulinoma‐associated antigen‐2 autoantibody (IA‐2Ab) levels were measured by the RIA method23, with a cut‐off value of 0.4 U/mL.
Statistical analysis
The Student's t‐test was used for comparisons between two groups. One‐way anova with Tukey analysis was used for comparisons across multiple groups. Correlations were analyzed using the Pearson correlation coefficient. Differences were considered significant if two‐tailed P‐values were <0.05. The statistical analysis was carried out with JMP Pro 13.0 (SAS Institute Inc., Tokyo, Japan). The BMI (kg/m2) was calculated as weight/(height squared).
Results
Table 1 summarizes the characteristics of the diabetes patients and control participants at the time the CT scans were carried out. The mean (standard deviation) ages of the patients with type 1 diabetes and non‐diabetic control participants were 50.6 years (13.9 years) and 48.1 years (11.3 years), respectively. The mean height, bodyweight, BMI and body surface area were comparable between the patients with type 1 diabetes and non‐diabetic control participants. The HbA1c level was comparable between acute‐onset type 1 diabetes and slowly progressive type 1 diabetes patients, but lower in fulminant type 1 diabetes patients than in acute‐onset type 1 diabetes and slowly progressive type 1 diabetes patients. Among the diabetes patients, the fasting C‐peptide and stimulated C‐peptide levels were the lowest in the fulminant type 1 diabetes patients and highest in the slowly progressive type 1 diabetes patients. There were no significant differences in GADAb or IA‐2Ab levels among the type 1 diabetes subtypes. Serum amylase levels were comparable between acute‐onset type 1 diabetes and slowly progressive type 1 diabetes patients, but higher in fulminant type 1 diabetes patients than in acute‐onset type 1 diabetes and slowly progressive type 1 diabetes patients. The estimated glomerular filtration rate was comparable between the patients with type 1 diabetes and non‐diabetic control participants.
Table 1.
Clinical characteristics between type 1 diabetes and controls
| Type 1 diabetes | Controls | ||||||||
|---|---|---|---|---|---|---|---|---|---|
| Total | Acute‐onset type 1 diabetes | Slowly progressive type 1 diabetes | Fulminant type 1 diabetes | P † | P ‡ | P § | P ¶ | ||
| n | 44 | 16 | 18 | 10 | – | – | – | 39 | – |
| Age (years) | 50.6 ± 13.9 | 47.1 ± 13.6 | 56.2 ± 9.1 | 48.2 ± 18.0 | NS | NS | NS | 48.1 ± 11.3 | NS |
| Height (cm) | 162.4 ± 7.8 | 161.2 ± 6.4 | 162.0 ± 8.5 | 164.4 ± 8.6 | NS | NS | NS | 164.1 ± 9.6 | NS |
| Weight (kg) | 58.1 ± 10.0 | 55.2 ± 9.0 | 60.2 ± 9.8 | 60.4 ± 10.9 | NS | NS | NS | 58.7 ± 10.9 | NS |
| Body mass index (kg/m2) | 22.0 ± 3.0 | 21.2 ± 3.3 | 22.9 ± 2.4 | 22.3 ± 3.7 | NS | NS | NS | 21.7 ± 3.1 | NS |
| Body surface area (m2) | 1.57 ± 0.16 | 1.53 ± 0.14 | 1.61 ± 0.16 | 1.59 ± 0.16 | NS | NS | NS | 1.59 ± 0.18 | NS |
| Duration of disease (years) | 7.9 ± 10.4 | 10.0 ± 14.7 | 9.3 ± 7.1 | 2.1 ± 3.7 | NS | NS | NS | – | – |
| HbA1c (%) | 9.3 ± 2.3 | 10.3 ± 2.2 | 9.4 ± 2.3 | 7.5 ± 0.7 | NS | ** | NS | 5.5 ± 0.3 | ** |
| Fasting C‐peptide, ng/mL†† (n) | 0.53 ± 0.48, (31) | 0.44 ± 0.32, (9) | 0.80 ± 0.50, (15) | 0.09 ± 0.09, (7) | NS | NS | * | – | – |
| Stimulated C‐peptide, ng/mL (n) | 1.00 ± 0.94, (31) | 0.79 ± 0.72, (9) | 1.50 ± 0.97, (15) | 0.19 ± 0.15, (7) | NS | NS | * | – | – |
| GADA titer (RIA), IU/mL (n) | 835 ± 3,925, (35) | 166 ± 561, (12) | 1,699 ± 5,763, (16) | 4.1 ± 3.8, (7) | NS | NS | NS | – | – |
| GADA titer (ELISA), IU/mL‡‡, (n) | 563 ± 823, (31) | 261 ± 657, (9) | 518 ± 809, (16) | 8.1 ± 15.2, (6) | NS | NS | NS | – | – |
| IA‐2 titer, IU/mL§§ (n) | 3.8 ± 8.4, (36) | 5.5 ± 10.7, (12) | 4.4 ± 8.5, (16) | 0.01 ± 0.00, (8) | NS | NS | NS | – | – |
| Serum amylase (IU/L) | 99 ± 96 | 73 ± 34 | 81 ± 59 | 171 ± 169 | NS | * | NS | 75 ± 33 | NS |
| Estimated GFR (mL/min/1.73 m2) | 87.9 ± 33.2 | 92.6 ± 50.3¶¶ | 86.4 ± 19.5 | 83.3 ± 16.2 | NS | NS | NS | 86.1 ± 16.2 | NS |
Values are presented as mean ± standard deviation for categorical variables. *P < 0.05, **P < 0.01. †Comparison between acute‐onset type 1 diabetes and slowly progressive type 1 diabetes. ‡Comparison between acute‐onset type 1 diabetes and fulminant type 1 diabetes. §Comparison slowly progressive type 1 diabetes and fulminant type 1 diabetes. ¶Comparison between total type 1 diabetes (acute‐onset, slowly progressive and fulminant type 1 diabetes combined) and controls. ††When C‐peptide levels fell below the lower limit of detection (i.e., <0.02), a fill value of 0.001 was used. ‡‡When glutamic acid decarboxylase autoantibody (GADAb) titers by enzyme‐linked immunosorbent assay (ELISA) fell below the lower limit of detection (i.e., <5.0), a fill value of 0.1 was used. §§When insulinoma‐associated protein 2 (IA‐2) titers fell below the lower limit of detection (i.e., <0.4), a fill value of 0.01 was used. ¶¶Two patients with long‐standing acute‐onset type 1 diabetes (49 and 19 years, respectively) showed decreased kidney function (22.6 and 36.5 mL/min/1.73 m2, respectively). GFR, glomerular filtration rate; HbA1c, glycated hemoglobin; NS, statistically non‐significant. RIA, radioimmunoassay.
Correlation between PV and bodyweight in patients with diabetes and non‐diabetic control participants
PV was significantly correlated with bodyweight in non‐diabetic control participants (r = 0.36, P = 0.02, Figure 1a) and in patients with type 1 diabetes (r = 0.52, P = 0.003; Figure 1b). Thus, pancreatic volume index (PVI: PV/bodyweight) was used for comparisons across multiple groups and analysis of the correlation between PV and clinical parameters in the present study.
Figure 1.
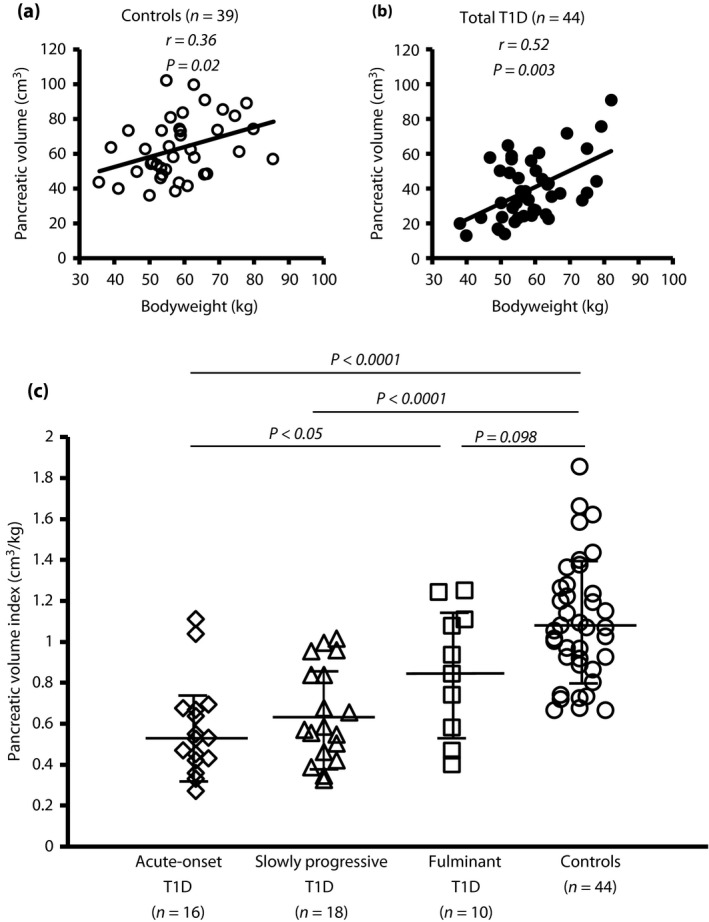
Pancreatic volumes of type 1 diabetes subtypes. (a, b) The pancreatic volume was significantly associated with bodyweight in (a) non‐diabetic control participants (open circles) and (b) patients with type 1 diabetes (type 1 diabetes; closed circles). (c) The mean pancreatic volume index (pancreatic volume/bodyweight) was significantly smaller in patients with acute‐onset type 1 diabetes (n = 16, open rhombus) and slowly progressive type 1 diabetes (n = 18, open triangles) compared with non‐diabetic control participants (n = 44, open circles). The mean pancreatic volume index was lower in fulminant type 1 diabetes (n = 10, open squares) compared with non‐diabetic controls. One‐way anova with Tukey analysis was used for comparisons across multiple groups. Data are mean ± standard deviation.
Comparison of PVI between subtypes of type 1 diabetes
PVI was significantly lower in patients with type 1 diabetes than in non‐diabetic control participant (0.67 cm3/kg vs 1.09 cm3/kg, P < 0.0001). The mean PVI was significantly lower in patients with acute‐onset type 1 diabetes and slowly progressive type 1 diabetes (0.57 cm3/kg and 0.65 cm3/kg, respectively) than in non‐diabetic control participants (1.09 cm3/kg, P < 0.0001; Figure 1c). The mean PVI (0.86 cm3/kg) was not statistically significant in fulminant type 1 diabetes compared with non‐diabetic control participants (P = 0.098).
Figure S1 show representative CT images of the pancreas of a newly diagnosed patient with acute‐onset type 1 diabetes and a non‐diabetic control participants (PVI 0.65 cm3/kg and 1.15 cm3/kg, respectively). The patient underwent abdominal CT on admission 2 months after the onset of typical diabetes symptoms. The patient's pancreas was thinner and reduced in volume compared with the pancreas of the non‐diabetic control participant.
There were no associations between the PV and age in the patients with type 1 diabetes or in the non‐diabetic controls (r = −0.19, P = 0.21 and r = −0.10, P = 0.53, respectively).
No reduction of PVI at the onset of fulminant type 1 diabetes
So far, no data are available on PVI at onset in patients with fulminant type 1 diabetes vs that of patients with acute‐onset type 1 diabetes. For further insight, we compared PVI measurements between recent‐onset acute‐onset type 1 diabetes (n = 8) and fulminant type 1 diabetes (n = 7; 0–7 days post‐diagnosis). None of the diabetes patients had symptoms of acute pancreatitis, such as fluid collection, necrosis or enlargement of the pancreas. Although PVI was significantly reduced in acute‐onset type 1 diabetes (0.63 cm3/kg) compared with controls (1.09 cm3/kg vs acute‐onset type 1 diabetes, P = 0.0005), corroborating a previous report from Williams et al.9, no such reduction was observed in fulminant type 1 diabetes (0.94 cm3/kg vs controls, P = 0.44; Figure 2a). Table S1 shows the patient characteristics. The average (standard deviation) patient age and BMI were similar between acute‐onset type 1 diabetes and fulminant type 1 diabetes. Fulminant type 1 diabetes patients had a significantly shorter duration from appearance of diabetes symptoms and lower HbA1c level than patients with acute‐onset type 1 diabetes. Serum amylase levels were higher in fulminant type 1 diabetes than in acute‐onset type 1 diabetes. PVI was uncorrelated with serum amylase levels in recent‐onset acute‐onset type 1 diabetes and fulminant type 1 diabetes (r = −0.39, P = 0.44 and r = −0.60, P = 0.16, respectively).
Figure 2.
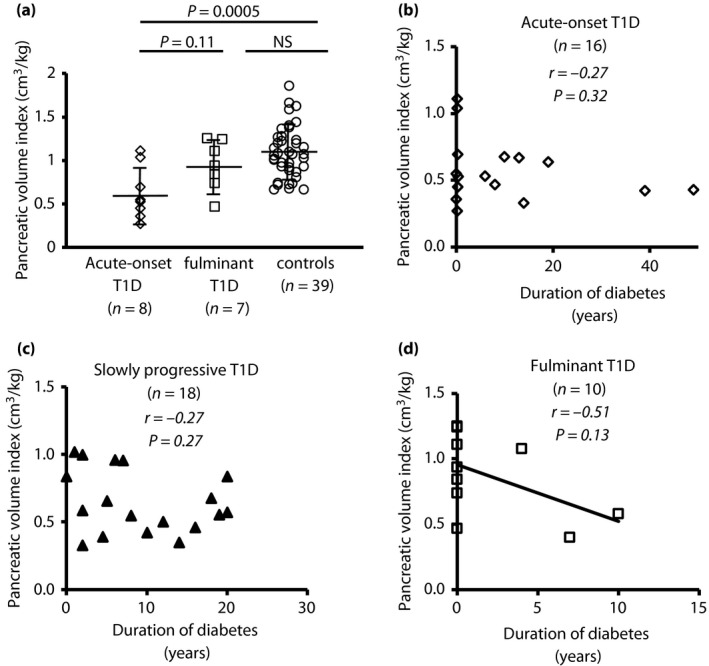
Pancreatic volume index in recent‐onset acute and fulminant type 1 diabetes. (a) Among recent‐onset cases (0–7 days post‐diagnosis), the mean pancreatic volume index (pancreatic volume/bodyweight) was significantly reduced in acute‐onset type 1 diabetes (type 1 diabetes; open rhombus, n = 8), but not in fulminant type 1 diabetes (n = 7, open squares), compared with non‐diabetic control participants (n = 44, open circles). One‐way anova with Tukey analysis was used for comparisons across multiple groups. Data are mean ± standard deviation. (b–d) The duration of diabetes was uncorrelated with pancreatic volume index in (b) acute‐onset type 1 diabetes and (c) slowly progressive type 1 diabetes, but (d) tended to negatively correlate with pancreatic volume index in fulminant type 1 diabetes. NS, not significant.
The duration of diabetes was uncorrelated with PVI in acute‐onset type 1 diabetes and slowly progressive type 1 diabetes (acute‐onset type 1 diabetes, r = −0.27, P = 0.32, Figure 2b; slowly progressive type 1 diabetes, r = −0.27, P = 0.27, Figure 2c), but tended to correlate negatively with PVI in fulminant type 1 diabetes (r = −0.51, P = 0.13, Figure 2d). Additional analysis of the correlation between the disease duration and PV in type 1 diabetes subtypes showed a correlation similar to that found for PVI (Figure S2).
No correlation of fasting C‐peptide or stimulated C‐peptide with PVI in diabetes patients
Figure 3 shows the results of a correlation analysis between PVI and fasting or stimulated C‐peptide in type 1 diabetes patients. PVI did not significantly correlate with fasting or stimulated C‐peptide in total type 1 diabetes or in any type 1 diabetes subtype.
Figure 3.
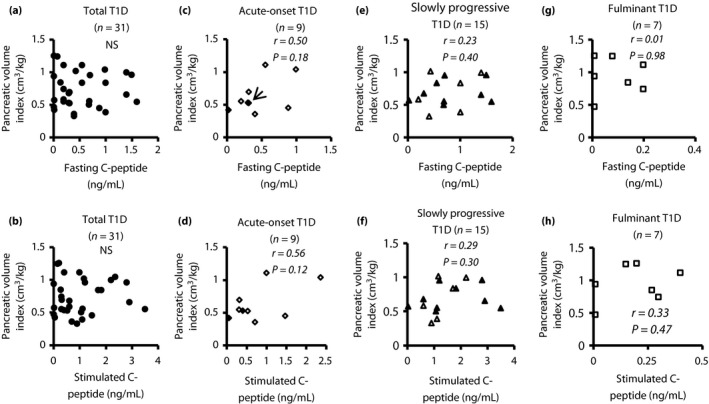
Correlation between pancreatic volume index and fasting C‐peptide or stimulated C‐peptide. (a, b) No statistically significant correlation was found between pancreatic volume index (pancreatic volume/bodyweight) and fasting or stimulated C‐peptide in total type 1 diabetes (type 1 diabetes; n = 31, closed circle). (c, d) Pancreatic volume index in acute‐onset type 1 diabetes was significantly correlated with fasting C‐peptide (n = 9, r = 0.50, P = 0.18) and stimulated C‐peptide (n = 9, r = 0.56, P = 0.12, open rhombus: patients with recent‐onset acute‐onset type 1 diabetes; circled rhombus: established patients [6–49 years]). (c) Two cases showed similar values. Accordingly, these data appeared to overlap (arrow). (e, f) No statistically significant correlation was found between pancreatic volume and fasting or stimulated C‐peptide in slowly progressive type 1 diabetes (n = 15, open triangles: patients with short duration diabetes [<5 years]; closed triangles: patients with a long duration of diabetes [≥5 years]). (g, h) No statistically significant correlation was found between pancreatic volume index and fasting or stimulated C‐peptide in fulminant type 1 diabetes (n = 7, open squares: patients with recent onset). NS, not significant.
Interestingly, no statistically significant correlation was found between PV and fasting or stimulated C‐peptide in slowly progressive type 1 diabetes, whereas PV in acute‐onset type 1 diabetes was significantly correlated with both fasting C‐peptide (r = 0.70, P = 0.04) and stimulated C‐peptide (r = 0.77, P = 0.01). PV in fulminant type 1 diabetes was significantly correlated with stimulated C‐peptide (r = 0.76, P = 0.048), but not with fasting C‐peptide (Figure S3).
Correlations between PVI and other clinical parameters in diabetes patients
We analyzed possible correlations between PVI and clinical parameters. PVI showed no significant correlation with serum amylase levels, HbA1c or the total daily insulin dose (data not shown). In addition, PVI in slowly progressive type 1 diabetes, including that in patients in whom insulin therapy was initiated early to prevent the progressive decline of β‐cell function, showed no association with the period of insulin treatment (n = 18, r = −0.21, P = 0.39, respectively), suggesting that the insulin therapy might not have reversed the exocrine changes. Next, we carried out analysis to clarify the correlation between PVI and islet autoimmunity. PVI was also uncorrelated with GADAb levels detected by RIA and enzyme‐linked immunosorbent assay, though it showed a significant negative association with IA‐2Ab levels (n = 36, r = −0.35, P = 0.03, respectively; Figure S4).
Discussion
The current study showed an approximately 40% reduction of PVI in patients with type 1 diabetes compared with age‐ and BMI‐matched non‐diabetic control participants. The duration of the diabetes and C‐peptide levels were not major determinants of PVI among the type 1 diabetes subtypes. In contrast with a previous report describing reduced PVI in recent‐onset acute‐onset type 1 diabetes9, a further finding from our study presents the first evidence that PVI undergoes no reduction in recent‐onset fulminant type 1 diabetes.
Although the precise pathogenesis of acute‐onset type 1 diabetes is still incompletely understood, enterovirus infection has been identified as a potential environmental trigger for the disease24, 25, 26, 27. Enteroviral RNA was detected in the circulation of individuals at a high risk of developing acute‐onset type 1 diabetes28. Furthermore, Rodriguez‐Calvo observed the hyperexpression of major histocompatibility complex class I and an infiltration of CD8 T cells in pancreas tissue from a double autoantibody‐positive individual without diabetes29. Wiberg et al.30 similarly observed abundant CD45‐positive cells infiltrating the exocrine pancreases of non‐diabetic patients who tested positive for islet autoantibody, showing that subclinical pancreatic inflammation begins long before the acute‐onset type 1 diabetes onset. A recent report by Li et al.31 showed that serum trypsinogen levels are significantly lower in non‐diabetic patients testing double positive for islet autoantibodies compared with seronegative non‐diabetic controls. These results imply that enterovirus infection or cryptogenic pancreatitis during the progression to type 1 diabetes results in inflammation of the exocrine tissue and thereby decreased pancreas size even before the onset of acute‐onset type 1 diabetes. Earlier research on pathology has prompted speculation that the mechanisms underlying the decreased pancreas size in acute‐onset type 1 diabetes largely stem from a loss of insulinotropic effects acting on the exocrine pancreas1, 2, 3, 12. Yet, the present our study, like several recent reports9, 32, showed no relationship between PVI and fasting and stimulated C‐peptide levels in patients with recent‐onset acute‐onset type 1 diabetes (0–7 days post‐diagnosis; r = 0.39, P = 0.38 and r = 0.48, P = 0.27, respectively). These data suggest that the decreased PVI at acute‐onset type 1 diabetes onset is unrelated to the loss of β‐cell function during the development of acute‐onset type 1 diabetes. A large cohort of patients at high risk of developing acute‐onset type 1 diabetes would be required to clarify the mechanism(s) of the decreased PVI at the acute‐onset type 1 diabetes onset. On the contrary, reduced PVI was not observed at fulminant type 1 diabetes onset, despite virus involvement in the pathogenesis of both acute‐onset type 1 diabetes24, 25, 26, 27 and fulminant type 1 diabetes16, 17, 33. Inflammatory injury of the exocrine pancreas can be assumed to occur concomitantly with severe insulitis, as patients with recent‐onset enterovirus‐induced fulminant type 1 diabetes frequently manifest elevated serum amylase levels and abundant immune cells infiltrating the exocrine pancreas33. This elevation of serum pancreatic enzyme can be taken as a sign of transient exocrine pancreatic damage; however, the increased serum pancreatic enzyme levels at the onset of fulminant type 1 diabetes rapidly returned to the normal range during treatment of diabetic ketoacidosis alone34. Indeed, pathological findings of pancreatitis, such as edematous change, necrosis, hemorrhage, cyst formation and atrophy of the exocrine pancreas, were all wholly undetectable for at least several months after the onset of fulminant type 1 diabetes34. The findings from the present study suggest that abrupt and extensive virus‐initiated immune response acting preferentially against islet‐cells leave the PVI unchanged in recent‐onset fulminant type 1 diabetes.
Only a few studies to date have examined PV in patients with slowly progressive type 1 diabetes or latent autoimmune diabetes in adults35. The PVI reduction in the current study was comparable between acute‐onset type 1 diabetes and slowly progressive type 1 diabetes. This was extremely intriguing, as the pathogenesis of type 1 diabetes and residual β‐cell function demonstrably differ between acute‐onset type 1 diabetes and slowly progressive type 1 diabetes36. Our group previously reported that patients with slowly progressive type 1 diabetes often manifest reduced pancreatic weight and pancreatic intraepithelial neoplasia with obstructive chronic pancreatitis, compared with non‐diabetic control participants5, 37. In the investigation by Suda et al.38, acinar cells around pancreatic intraepithelial neoplasia lesions were damaged through ductal hyperpressure and leakage of pancreatic digestive fluid caused by tall, columnar, mucin‐rich cells. Preliminary data from our group on slowly progressive type 1 diabetes autopsy specimens have shown a negative association between pancreatic weight and the numbers of CD8‐positive cells infiltrating the exocrine pancreas (Fukui T, Kobayashi T, unpublished observations). Hence, reduced PVI in patients with slowly progressive type 1 diabetes might be associated with pancreatic exocrine inflammation caused by pancreatic intraepithelial neoplasia or with other factors independent of residual β‐cell function, such as gut microbiota or autoimmunity against exocrine tissue.
Another novel finding in the present study was a significant association between PVI and the levels of IA‐2Ab in patients with type 1 diabetes. Conflicting results, however, have been reported on the correlation of IA‐2Ab titers with PVI in Caucasian patients with type 1 diabetes9. This prompted us to investigate the effect of IA‐2 Ab positivity on PVI by comparing PVI between the IA‐2‐positive patients (n = 14) and IA‐2‐negative patients (n = 22) in the present study. As it turned out, there was no major difference in PVI between the two groups (0.58 ± 0.26 cm3/kg and 0.71 ± 0.26 cm3/kg, respectively). Further studies using large numbers of participants will be required to clarify the correlation between IA‐2 Ab and PVI in patients with type 1 diabetes.
There were several limitations to the current study. First, the current study was a relatively small sample, and the retrospective study limited the precision of the results. In particular, the enrollment of patients with fulminant type 1 diabetes was difficult in the present study, as just 19.4% of type 1 diabetes patients had fulminant type 1 diabetes in the Japanese national survey39. Second, we were unable to clarify the essential factor(s) for reduced pancreas size in patients with acute‐onset type 1 diabetes and slowly progressive type 1 diabetes. Given that the pancreas is composed of both endocrine and exocrine tissues, including the pancreatic duct, we believe that advanced, non‐invasive longitudinal imaging studies are warranted to gain a better understanding of the roles of the exocrine tissues and the pathogenesis of type 1 diabetes throughout the whole pancreas. Finally, fat and parenchyma were both included in the PV measurements for cases with ectopic fat accumulation in the pancreas, a condition known as pancreatic steatosis, as the imaging software used was poor at distinguishing between them.
We conclude that patients with acute‐onset type 1 diabetes and slowly progressive type 1 diabetes have small pancreases irrespective of the diabetes duration or C‐peptide levels, and that the undiminished pancreatic volume observed at fulminant type 1 diabetes onset proves that pancreatic size undergoes no reduction before the disease appears. The size of the pancreas should be evaluated in addition to the β‐cell function when type 1 diabetes is diagnosed and followed.
Disclosure
The authors declare no conflict of interest.
Supporting information
Figure S1 | Small pancreas in patients with recent‐onset type 1 diabetes. (a, b) Representative computed tomography images of the pancreas of a newly diagnosed patient with acute‐onset type 1 diabetes and a non‐diabetic control participant (pancreatic volume index: 0.65 cm3/kg and 1.15 cm3/kg, respectively).
Figure S2 | Correlation between pancreatic volume and duration of diabetes. (a–c) The duration of diabetes was uncorrelated with pancreatic volume in (a) acute‐onset type 1 diabetes and (b) slowly progressive type 1 diabetes, (c) but tended to negatively correlate with pancreatic volume in fulminant type 1 diabetes.
Figure S3 | Correlation between pancreatic volume (PV) and fasting C‐peptide or stimulated C‐peptide. (a, b) No statistically significant correlation was found between pancreatic volume (PV and fasting or stimulated C‐peptide in total type 1 diabetes (type 1 diabetes; n = 31, closed circle). (c, d) PV in acute‐onset type 1 diabetes was significantly correlated with fasting C‐peptide (n = 9, r = 0.70, P = 0.04) and stimulated C‐peptide (n = 9, r = 0.77, P = 0.01, open rhombus: patients with recent‐onset acute‐onset type 1 diabetes; circled rhombus: established patients [6–49 years]). (e, f) No statistically significant correlation was found between PV and fasting or stimulated C‐peptide in slowly progressive type 1 diabetes (n = 15, open triangles: patients with a short duration diabetes [<5 years]; closed triangles: patients with a long duration of diabetes [≥5 years]). (e, f) Two cases showed similar values. Accordingly, these data appeared to overlap (arrow). (g, h) PV was not correlated with fasting C‐peptide, but that was significantly correlated with stimulated C‐peptide (n = 7, open squares: patients with recent onset).
Figure S4 | Correlation between pancreatic volume index and islet autoantibodies. While the pancreatic volume index showed no correlation with glutamic acid decarboxylase autoantibody (GADAb) titers detected by (a) radioimmunoassay or (b) enzyme‐linked immunosorbent assay (ELISA), it showed a significant negative relationship with (c) the levels of insulinoma‐associated antigen‐2 autoantibodies (IA‐2Ab). GADAb titers assessed by radioimmunoassay (RIA) were actual measured values. When GADAb titers assessed by ELISA fell below the lower limit of detection (<5.0), a fill value of 0.1 was used. When IA‐2 titers fell below the lower limit of detection (<0.4), a fill value of 0.01 was used.
Table S1 | Clinical characteristics on admission between recent‐onset acute type 1 diabetes and fulminant type 1 diabetes.
Acknowledgments
The authors thank Jiro Munechika MD PhD for pancreatic volume measurement. This research received no specific grant from any funding agency in the public, commercial or not‐for‐profit sectors. Results from this study were presented at the American Diabetes Association 77th Annual Scientific Meeting, San Diego, California, 9–13 June 2017.
J Diabetes Investig 2018; 9: 1091–1099
References
- 1. Gepts W. Pathologic anatomy of the pancreas in juvenile diabetes mellitus. Diabetes 1965; 14: 619–633. [DOI] [PubMed] [Google Scholar]
- 2. Frier BM, Saunders JH, Wormsley KG, et al Exocrine pancreatic function in juvenile‐onset diabetes mellitus. Gut 1976; 17: 685–691. [DOI] [PMC free article] [PubMed] [Google Scholar]
- 3. Dandona P, Freedman DB, Foo Y, et al Exocrine pancreatic function in diabetes mellitus. J Clin Pathol 1984; 37: 302–306. [DOI] [PMC free article] [PubMed] [Google Scholar]
- 4. Nakanishi K, Kobayishi T, Miyashita H, et al Relationships among residual β cells, exocrine pancreas, and islet cell antibodies in insulin‐dependent diabetes mellitus. Metabolism 1993; 42: 196–203. [DOI] [PubMed] [Google Scholar]
- 5. Kobayashi T, Aida K, Fukui T, et al Pancreatic ductal hyperplasia/dysplasia with obstructive chronic pancreatitis: an association with reduced pancreatic weight in type 1 diabetes. Diabetologia 2016; 59: 865–867. [DOI] [PMC free article] [PubMed] [Google Scholar]
- 6. Goda K, Sasaki E, Nagata K, et al Pancreatic volume in type 1 and type 2 diabetes mellitus. Acta Diabetol 2001; 38: 145–149. [DOI] [PubMed] [Google Scholar]
- 7. Philippe MF, Benabadji S, Barbot‐Trystram L, et al Pancreatic volume and endocrine and exocrine functions in patients with diabetes. Pancreas 2011; 40: 359–363. [DOI] [PubMed] [Google Scholar]
- 8. Gaglia JL, Guimaraes AR, Harisinghani M, et al Noninvasive imaging of pancreatic islet inflammation in type 1A diabetes patients. J Clin Invest 2011; 121: 442–445. [DOI] [PMC free article] [PubMed] [Google Scholar]
- 9. Williams AJ, Thrower SL, Sequeiros IM, et al Pancreatic volume is reduced in adult patients with recently diagnosed type 1 diabetes. J Clin Endocrinol Metab 2012; 97: 2109–2113. [DOI] [PubMed] [Google Scholar]
- 10. Virostko J, Hilmes M, Eitel K, et al Use of the electronic medical record to assess pancreas size in type 1 diabetes. PLoS One 2016; 11: e0158825. [DOI] [PMC free article] [PubMed] [Google Scholar]
- 11. Campbell‐Thompson M, Wasserfall C, Montgomery EL, et al Pancreas organ weight in individuals with disease‐associated autoantibodies at risk for type 1 diabetes. JAMA 2012; 308: 2337–2339. [DOI] [PubMed] [Google Scholar]
- 12. Henderson JR, Daniel PM, Fraser PA. The pancreas as a single organ: the influence of the endocrine upon the exocrine part of the gland. Gut 1981; 22: 158–167. [DOI] [PMC free article] [PubMed] [Google Scholar]
- 13. Löhr M, Klöppel G. Residual insulin positivity and pancreatic atrophy in relation to duration of chronic type 1 (insulin‐dependent) diabetes mellitus and microangiopathy. Diabetologia 1987; 30: 757–762. [DOI] [PubMed] [Google Scholar]
- 14. Stenström G, Gottsäter A, Bakhtadze E, et al Latent autoimmune diabetes in adults: definition, prevalence, beta‐cell function, and treatment. Diabetes 2005; 54: S68–S72. [DOI] [PubMed] [Google Scholar]
- 15. Imagawa A, Hanafusa T, Miyagawa J, et al A novel subtype of type 1 diabetes mellitus characterized by a rapid onset and an absence of diabetes‐related antibodies. N Engl J Med 2000; 342: 301–307. [DOI] [PubMed] [Google Scholar]
- 16. Imagawa A, Hanafusa T, Makino H, et al High titres of IgA antibodies to enterovirus in fulminant type‐1 diabetes. Diabetologia 2005; 48: 290–293. [DOI] [PubMed] [Google Scholar]
- 17. Tanaka S, Nishida Y, Aida K, et al Enterovirus infection, CXC chemokine ligand 10 (CXCL10), and CXCR3 circuit: a mechanism of accelerated beta‐cell failure in fulminant type 1 diabetes. Diabetes 2009; 58: 2285–2291. [DOI] [PMC free article] [PubMed] [Google Scholar]
- 18. Kawasaki E, Maruyama T, Imagawa A, et al Diagnostic criteria for acute‐onset type 1 diabetes mellitus (2012): report of the Committee of Japan Diabetes Society on the Research of Fulminant and Acute‐onset Type 1 Diabetes Mellitus. J Diabetes Investig 2014; 5: 115–118. [DOI] [PMC free article] [PubMed] [Google Scholar]
- 19. Kobayashi T, Tamemoto K, Nakanishi K, et al Immunogenetic and clinical characterization of slowly progressive IDDM. Diabetes Care 1993; 16: 780–788. [DOI] [PubMed] [Google Scholar]
- 20. The Committee of Japan Diabetes Society on the Diagnostic Criteria of Diabetes Mellitus . Report of the committee on the classification and diagnostic criteria of diabetes mellitus. J Diabetes Investig 2010; 1: 212–228. [DOI] [PMC free article] [PubMed] [Google Scholar]
- 21. Powell M, Prentice L, Asawa T, et al Glutamic acid decarboxylase autoantibody assay using 125I‐labelled recombinant GAD65 produced in yeast. Clin Chim Acta 1996; 256: 175–188. [DOI] [PubMed] [Google Scholar]
- 22. Brooking H, Ananieva‐Jordanova R, Arnold C, et al A sensitive non‐isotopic assay for GAD65 autoantibodies. Clin Chim Acta 2003; 331: 55–59. [DOI] [PubMed] [Google Scholar]
- 23. Masuda M, Powell M, Chen S, et al Autoantibodies to IA‐2 in insulin‐dependent diabetes mellitus. Measurements with a new immunoprecipitation assay. Clin Chim Acta 2000; 291: 53–66. [DOI] [PubMed] [Google Scholar]
- 24. Richardson SJ, Willcox A, Bone AJ, et al The prevalence of enteroviral capsid protein vp1 immunostaining in pancreatic islets in human type 1 diabetes. Diabetologia 2009; 52: 1143–1151. [DOI] [PubMed] [Google Scholar]
- 25. Ylipaasto P, Klingel K, Lindberg AM, et al Enterovirus infection in human pancreatic islet cells, islet tropism in vivo and receptor involvement in cultured islet beta cells. Diabetologia 2004; 47: 225–239. [DOI] [PubMed] [Google Scholar]
- 26. Richardson SJ, Leete P, Bone AJ, et al Expression of the enteroviral capsid protein VP1 in the islet cells of patients with type 1 diabetes is associated with induction of protein kinase R and downregulation of Mcl‐1. Diabetologia 2013; 56: 185–193. [DOI] [PubMed] [Google Scholar]
- 27. Von Herrath M, Sanda S, Herold K. Type 1 diabetes as a relapsing‐remitting disease? Nat Rev Immunol 2007; 7: 988–994. [DOI] [PubMed] [Google Scholar]
- 28. Oikarinen S, Martiskainen M, Tauriainen S, et al Enterovirus RNA in blood is linked to the development of type 1 diabetes. Diabetes 2011; 60: 276–279. [DOI] [PMC free article] [PubMed] [Google Scholar]
- 29. Rodriguez‐Calvo T, Suwandi JS, Amirian N, et al Heterogeneity and lobularity of pancreatic pathology in type 1 diabetes during the prediabetic phase. J Histochem Cytochem 2015; 63: 626–636. [DOI] [PMC free article] [PubMed] [Google Scholar]
- 30. Wiberg A, Granstam A, Ingvast S, et al Characterization of human organ donors testing positive for type 1 diabetes‐associated autoantibodies. Clin Exp Immunol 2015; 182: 278–288. [DOI] [PMC free article] [PubMed] [Google Scholar]
- 31. Li X, Campbell‐Thompson M, Wasserfall CH, et al Serum trypsinogen levels in type 1 diabetes. Diabetes Care 2017; 40: 577–582. [DOI] [PMC free article] [PubMed] [Google Scholar]
- 32. Campbell‐Thompson ML, Kaddis JS, Wasserfall C, et al The influence of type 1 diabetes on pancreatic weight. Diabetologia 2016; 59: 217–221. [DOI] [PMC free article] [PubMed] [Google Scholar]
- 33. Tanaka S, Aida K, Nishida Y, et al Pathophysiological mechanisms involving aggressive islet cell destruction in fulminant type 1 diabetes. Endocr J 2013; 60: 837–845. Review. [DOI] [PubMed] [Google Scholar]
- 34. Imagawa A, Hanafusa T. Pathogenesis of fulminant type 1 diabetes. Rev Diabet Stud 2006; 3: 169–177. [DOI] [PMC free article] [PubMed] [Google Scholar]
- 35. Lu J, Hou X, Pang C, et al Pancreatic volume is reduced in patients with latent autoimmune diabetes in adults. Diabetes Metab Res Rev 2016; 32: 858–866. [DOI] [PubMed] [Google Scholar]
- 36. Kobayashi T, Tanaka S, Harii N, et al Immunopathological and genetic features in slowly progressive insulin‐dependent diabetes mellitus and latent autoimmune diabetes in adults. Ann N Y Acad Sci 2006; 1079: 60–66. Review. [DOI] [PubMed] [Google Scholar]
- 37. Nakanishi K, Kobayashi T, Miyashita H, et al Exocrine pancreatic ductograms in insulin‐dependent diabetes mellitus. Am J Gastroenterol 1994; 89: 762–766. [PubMed] [Google Scholar]
- 38. Suda K, Mogaki M, Oyama T, et al Histopathologic and immunohistochemical studies on alcoholic pancreatitis and chronic obstructive pancreatitis: special emphasis on ductal obstruction and genesis of pancreatitis. Am J Gastroenterol 1990; 85: 271–276. [PubMed] [Google Scholar]
- 39. Imagawa A, Hanafusa T, Uchigata Y, et al Fulminant type 1 diabetes: a nationwide survey in Japan. Diabetes Care 2003; 26: 2345–2352. [DOI] [PubMed] [Google Scholar]
Associated Data
This section collects any data citations, data availability statements, or supplementary materials included in this article.
Supplementary Materials
Figure S1 | Small pancreas in patients with recent‐onset type 1 diabetes. (a, b) Representative computed tomography images of the pancreas of a newly diagnosed patient with acute‐onset type 1 diabetes and a non‐diabetic control participant (pancreatic volume index: 0.65 cm3/kg and 1.15 cm3/kg, respectively).
Figure S2 | Correlation between pancreatic volume and duration of diabetes. (a–c) The duration of diabetes was uncorrelated with pancreatic volume in (a) acute‐onset type 1 diabetes and (b) slowly progressive type 1 diabetes, (c) but tended to negatively correlate with pancreatic volume in fulminant type 1 diabetes.
Figure S3 | Correlation between pancreatic volume (PV) and fasting C‐peptide or stimulated C‐peptide. (a, b) No statistically significant correlation was found between pancreatic volume (PV and fasting or stimulated C‐peptide in total type 1 diabetes (type 1 diabetes; n = 31, closed circle). (c, d) PV in acute‐onset type 1 diabetes was significantly correlated with fasting C‐peptide (n = 9, r = 0.70, P = 0.04) and stimulated C‐peptide (n = 9, r = 0.77, P = 0.01, open rhombus: patients with recent‐onset acute‐onset type 1 diabetes; circled rhombus: established patients [6–49 years]). (e, f) No statistically significant correlation was found between PV and fasting or stimulated C‐peptide in slowly progressive type 1 diabetes (n = 15, open triangles: patients with a short duration diabetes [<5 years]; closed triangles: patients with a long duration of diabetes [≥5 years]). (e, f) Two cases showed similar values. Accordingly, these data appeared to overlap (arrow). (g, h) PV was not correlated with fasting C‐peptide, but that was significantly correlated with stimulated C‐peptide (n = 7, open squares: patients with recent onset).
Figure S4 | Correlation between pancreatic volume index and islet autoantibodies. While the pancreatic volume index showed no correlation with glutamic acid decarboxylase autoantibody (GADAb) titers detected by (a) radioimmunoassay or (b) enzyme‐linked immunosorbent assay (ELISA), it showed a significant negative relationship with (c) the levels of insulinoma‐associated antigen‐2 autoantibodies (IA‐2Ab). GADAb titers assessed by radioimmunoassay (RIA) were actual measured values. When GADAb titers assessed by ELISA fell below the lower limit of detection (<5.0), a fill value of 0.1 was used. When IA‐2 titers fell below the lower limit of detection (<0.4), a fill value of 0.01 was used.
Table S1 | Clinical characteristics on admission between recent‐onset acute type 1 diabetes and fulminant type 1 diabetes.