

Abstract
Background
Arterial hypertension adversely affects left atrial (LA) size and function, effect on function may precede effect on size. Many techniques were used to assess LA function but with pitfalls.
Objectives
Early detection of left atrial dysfunction with speckle tracking echocardiography in hypertensive patients with normal left atrial size.
Patients and methods
The study was conducted on 50 hypertensive patients and 50 age matched normotensive controls, all with normal LA volume index and free from any other cardiovascular disease that may affect the LA size or function. They were all subjected to history taking, clinical examination and echocardiographic study with assessment of LA functions [total LA stroke volume, LA expansion index by conventional 2D echocardiography and Global peak atrial longitudinal strain by speckle tracking (PALS)], left ventricular (LV) systolic and diastolic functions, and LV mass.
Results
Different indices of LA dysfunction (Total LA stroke volume, LA expansion index and global PALS) were significantly lower in the hypertensive group despite the normal LA volume index in all the studied subjects. The presence of diabetes mellitus (DM) and higher grade of LV diastolic dysfunction were significantly associated with lower global PALS. The higher age, systolic blood pressure (BP), body mass index (BMI), LA volume index, and LV mass index and the lower LA expansion index were associated with lower global PALS.
Conclusion
Speckle tracking echocardiography is a useful novel technique in detecting LA dysfunction in hypertension even before LA enlargement occurs.
Abbreviations: LA, left atrium; LV, left ventricle; BP, blood pressure; BMI, body mass index; STE, speckle-tracking echocardiography; LASV, LA stroke volume; ROI, region of interest; HR, heart rate; DM, diabetes mellitus; PALS, peak atrial longitudinal strain
Keywords: Left atrium, Left atrial dysfunction, Hypertension, Speckle tracking
1. Introduction
Arterial hypertension is associated with morphologic and functional LA abnormalities. An increase in LA size in patients with hypertension is a common finding in clinical practice, and the mechanisms underlying this enlargement have been extensively analyzed.1 Most of studies included patients regardless of LA size. This raises the question of whether LA dysfunction in patients with hypertension may be detected in the absence of LA enlargement. This question may be of clinical interest, because LA size is often used as a surrogate marker of LA function in clinical practice.2 Also, LA enlargement and dysfunction are considered risk factors for development of atrial fibrillation and cerebro-vascular strokes in hypertensive patients.3
Speckle-tracking echocardiography (STE) allows direct and angle-independent analysis of myocardial deformation, thus providing sensitive and reproducible indices of myocardial fiber dysfunction that overcome most of the limitations of Doppler-derived strain measures.4 The assessment of LA strain dynamics by STE in hypertensive patients may be of particular interest in those with no evidence of LA enlargement, because it may provide additional information for the early detection of LA abnormalities.5 So, we aimed for early detection of left atrial dysfunction by speckle tracking echocardiography in hypertensive patients with normal LA size.
2. Materials and methods
This was a cross sectional study that included 50 patients with systemic arterial hypertension (defined as Systolic BP ≥ 140 mmHg and/or diastolic BP ≥ 90 mmHg or Antihypertensive treatment with a documented history of hypertension).6 All patients should have an echocardiographic evidence of normal LA size (defined as LA volume index < 28 ml/m2)7 and 50 age matched non hypertensive control subjects. All were presented to ain shams university hospitals echo lab from June 2015 to march 2016. This study was approved by our Local Institutional Human Research Committee & subjects gave written informed consent.
Excluded from the study were patients with conditions that affect LA size and function like [a] Patients with documented coronary artery disease (defined as history of MI or revascularization, SWMA on echocardiography or positive stress test of any type) [b] Any type of cardiomyopathy (e.g. Dilated, ischemic, hypertrophic…) [c] Mitral valve disease [d] Atrial fibrillation-flutter.
The whole study population was subjected to
[I] History taking (a) Risk factors including: Age, gender, diabetes mellitus, hypertension, smoking, dyslipidemia and positive family history of cardiac disease. (b) Drug history “Types, doses, and duration” (c) History of any cardiac problem “e.g. ischemic heart diseases, heart failure, arrhythmias” (d) Paracardiac problem “Renal, broncho-pulmonary, or chronic liver disease”.
[II] General and local cardiac examination including arterial blood pressure measurement (by conventional sphygmomanometer), pulse, body weight, body surface area and body mass index.
[III] Echocardiography was performed using Vivid S5 or Vivid 9; GE Medical Systems. A standard echocardiographic study using 2D, M-mode and Doppler techniques were performed in addition to speckle tracking for LA.
2.1. Standard assessment of left atrium
LA volumes were calculated from apical four-chamber and two-chamber views using the biplane Area-Length method.7 Maximal and minimal LA volumes were measured just before mitral valve opening, and at mitral valve closure, respectively. The LA volume index was calculated in ml/m2 automatically by the machine (Inputs: A1: Max. planimetered LA area in apical 4-chamber (A4C) view, A2: Max. planimetered LA area in apical 2-chamber (A2C) view, L: Length measured from back wall to line across mitral valve hinge points (cm), Weight (kg or Ib) and Height (cm or in)).
The following indices of LA function were calculated: Total LA stroke volume (LASV) could be obtained as the difference between maximal and minimal LA volumes. LA expansion index could be obtained as the ratio of total LASV to minimum LA volume × 100.7
2.2. Speckle tracking echocardiography
Recordings were processed using acoustic-tracking software (Echo Pac, GE, USA), allowing off-line semi-automated analysis of speckle-based strain. Good ECG was considered a prerequisite for a good analysis. Apical four-chamber, two-chamber and three-chamber images were recorded using conventional two-dimensional grayscale imaging, during breath hold. Care was taken to optimize visualization of the LA cavity and to maximize LA area in apical views, avoiding foreshortening of the left atrium.8 Three consecutive heart cycles were recorded and averaged. The frame rate was set between 60 and 80 frames per second; these settings are recommended to combine temporal resolution with adequate spatial definition, and to enhance the feasibility of the frame-to-frame tracking technique. Offline analysis was then performed. LA endocardial surface was manually traced in both apical four- and two-chamber views by a point and click approach. An epicardial surface tracing was then automatically generated by the system, thus creating a region of interest (ROI).9 To trace the ROI in the discontinuity of LA wall corresponding to pulmonary veins and LA appendage, the direction of LA endocardial and epicardial surfaces at the junction with these structures was extrapolated. After manual adjustment of ROI width and shape, the software divided the ROI into 6 segments, and the resulting tracking quality for each segment was automatically scored as either acceptable or non-acceptable, with the possibility of further manual correction.
Segments in which no adequate image quality could be obtained were rejected by the software and excluded from the analysis. In subjects with adequate image quality, a total of 12 segments were then analyzed.10 Lastly the software generated the longitudinal strain curves for each segment and a mean curve of all segments that reflect the pathophysiology of atrial function.11 Setting zero strain at LV end-diastole, the LA strain pattern is characterized by a predominant positive wave that peaks at the end of ventricular systole, followed by two distinct descending phases in early diastole and late diastole.12
The systolic component of LA strain mostly reflects LA reservoir function, whereas the early diastolic and late diastolic components mostly reflect LA conduit function and LA contractile function, respectively.12 Global peak atrial longitudinal strain was then determined which is the most robust measure of LA function (mainly the reservoir function which is the most affected LA function in hypertension).13
LV systolic function was measured in 2D apical 4-chamber and 2-chamber views using biplane method of discs (modified Simpson’s rule).7
LV diastolic function was determined using peak E velocity, peak A velocity, E/A ratio, and the deceleration time. The early diastolic E′ velocity and late diastolic A′ velocity were estimated by Doppler tissue imaging, by placing the sample volume at the septal annulus of the mitral valve and E/E′ ratio was calculated. The patients were graded according to LV diastolic dysfunction into 3 grades: grade 1 (impaired relaxation), grade 2 (pseudo-normal pattern) and grade III (restrictive pattern)14 Fig. 1.
Fig. 1.

LV diastolic function assessed by [A] TDI [B] Doppler Mitral inflow.
LV wall thickness: LV mass (LVM, in grams) was calculated using the Penn formula15:
where LVIDd is LV end-diastolic internal diameter; PWTd, diastolic posterior wall thickness; and IVSTd, diastolic interventricular septal thickness. LVM was subsequently indexed to body surface area (BSA) to obtain LV mass index.
2.3. Statistical analysis
Data were collected, revised, coded and entered to the Statistical Package for Social Science (IBM SPSS) version 20. Qualitative data were presented as number and percentages while quantitative data were presented as mean, standard deviations and ranges. The comparison between two groups with qualitative data were done by using Chi-square test while Fisher exact test was used instead of Chi-square test when the expected count in any cell was found less than 5. The comparison between two independent groups regarding quantitative data with parametric distribution was done by using Independent t-test. Correlation of global PALS with different risk factors was done using Pearson correlation coefficient.
3. Results
3.1. Demographic data
Both groups were matching regarding age, gender, HR, BMI and BSA (non-significant difference). DM was more common among the hypertensive group while smoking was more common among the control group Table 1.
Table 1.
Comparison between both groups regarding demographic and clinical measures and risk factors.
| No HTN | HTN | p-value | ||
|---|---|---|---|---|
| No. = 50 | No. = 50 | |||
| Gender | Female | 25 (50.0%) | 30 (60.0%) | 0.421 |
| Male | 25 (50.0%) | 20 (40.0%) | ||
| Age | Mean ± SD | 54.06 ± 8.35 | 56.04 ± 10.72 | 0.305 |
| HR (bpm) | Mean ± SD | 77.24 ± 10.68 | 79.94 ± 10.87 | 0.213 |
| BMI (Kg/m2) | Mean ± SD | 25.20 ± 2.73 | 25.96 ± 3.61 | 0.238 |
| BSA (m2) | Mean ± SD | 1.76 ± 0.09 | 1.73 ± 0.09 | 0.130 |
| DM | Negative | 40 (80.0%) | 26 (52.0%) | 0.003 |
| Positive | 10 (20.0%) | 24 (48.0%) | ||
| Smoking | Negative | 29 (58.0%) | 42 (84.0%) | 0.004 |
| Positive | 21 (42.0%) | 8 (16.0%) | ||
Both groups were homogenous except for DM and smoking.
3.2. LV measurements
All the studied subjects had normal LVEF, hypertensive group had significantly higher LV mass index and subsequently worse LV diastolic dysfunction Table 2.
Table 2.
Comparison between both groups regarding LV measurements.
| No HTN | HTN | Independent t-test |
|||
|---|---|---|---|---|---|
| No. = 50 | No. = 50 | t | p-value | ||
| LVEF (%) | Mean ± SD | 67.02 ± 5.90 | 69.50 ± 6.72 | −1.961 | 0.053 |
| Range | 55–78 | 57–80 | |||
| LV mass index (gm/m2) | Mean ± SD | 77.18 ± 11.70 | 84.50 ± 22.71 | −2.026 | 0.045 |
| Range | 57–95 | 56–137 | |||
| LV diastolic dysfunction |
No HTN | HTN | Chi-square test |
||
| No. = 50 | No. = 50 | X2 | p-value | ||
| I | 12 (24.0%) | 29 (58.0%) | 31.926 | 0.000 | |
| II | 0 (0.0%) | 10 (20.0%) | |||
| None | 38 (76.0%) | 11 (22.0%) | |||
The LV mass index and LV diastolic function are the 2 LV measurements that were significantly affected in the hypertensive group.
3.3. LA parameters
Although the LA volume index was within the normal range in all studied subjects, active LA emptying volume “which represents the contractile function of the LA” was significantly lower in hypertensive group [i.e. contractile function of LA is affected in hypertensive patients even before the LA size is enlarged]. Also the LA expansion index “which represents the reservoir function of the LA” was significantly lower in hypertensive group [i.e. reservoir function of LA is also affected before LA enlargement occurs]. Regarding global peak atrial longitudinal strain (PALS) “which represents LA global dysfunction, specifically describing the reservoir function of LA” was significantly lower in hypertensive group. So, we can conclude that changes in global PALS as well as other indices of LA dysfunction occurred even before LA volume increase Table 3.
Table 3.
Comparison between both groups regarding LA parameters.
| No HTN | HTN | Independent t-test |
|||
|---|---|---|---|---|---|
| No. = 50 | No. = 50 | t | p-value | ||
| LA volume index (ml/m2) | Mean ± SD | 17.78 ± 2.71 | 20.74 ± 4.69 | −3.869 | 0.000 |
| Range | 13–23 | 13–27 | |||
| Total LA stroke volume (ml) | Mean ± SD | 29.30 ± 3.69 | 27.02 ± 5.18 | 2.534 | 0.013 |
| Range | 22–36 | 17–35 | |||
| LA expansion index (%) | Mean ± SD | 257.58 ± 19.05 | 223.68 ± 41.96 | 5.202 | 0.000 |
| Range | 190–287 | 143–287 | |||
| Global PALS (%) | Mean ± SD | 41.36 ± 2.86 | 24.00 ± 6.92 | 16.399 | 0.000 |
| Range | 35–46 | 8–36 | |||
The LA size (LA volume index) as well as the different indices of LA dysfunction (Total LA stroke volume, LA expansion index and global PALS); were significantly lower in the hypertensive group despite the normal LV volume index in all the studied subjects.
3.4. Correlation of global PALS with risk factors of the hypertensive subjects
Diabetics and patients with higher grade of LV diastolic dysfunction were found to have lower global PALS Table 4.
Table 4.
Correlation of global PALS with different risk factors.
| Global PALS (%) | Independent t-test | ||||
|---|---|---|---|---|---|
| Gender | Female | 23.51 ± 5.25 | 15–35 | 0.728 | 0.468 |
| Male | 22.47 ± 9.02 | 8–36 | |||
| DM | Negative | 28.35 ± 4.24 | 23 –36 | 6.098 | 0.000 |
| Positive | 19.29 ± 6.15 | 8–32 | |||
| Smoking | Negative | 20.95 ± 5.51 | 15–36 | 1.205 | 0.231 |
| Positive | 19.75 ± 3.73 | 8–18 | |||
| LV diastolic dysfunction | None | 28.55 ± 3.5 | 24–35 | 23.737 | 0.000 |
| I | 25.52 ± 5.74 | 14–36 | |||
| II | 14.6 ± 3.66 | 8–18 | |||
The presence of DM and higher grade of LV diastolic dysfunction were significantly associated with lower global PALS.
In Table 5 and Fig. 2 we tried to find the effect of different studied parameters on global PALS in hypertensive patients, we found that older subjects, those with higher systolic BP and those with higher BMI [Risk factors for LA dysfunction], as well as subjects with higher LV mass index [a common complication of hypertension], and finally Larger LA volume index “although all values of LA volume index were within the normal range” had lower global PALS. Regarding conventional indices of LA function, subjects with lower LA expansion index had lower global PALS while total LA stroke volume didn’t affect global strain significantly [because global PALS mainly represents the reservoir function of LA more than its contractile function].
Table 5.
Correlation of global PALS (%) with the studied parameters of hypertensive patients.
| Global PALS (%) |
||
|---|---|---|
| r | p-value | |
| Age | −0.866** | <0.001 |
| Bedside systolic blood pressure | −0.633** | <0.001 |
| Bedside diastolic blood pressure | −0.113 | 0.563 |
| HR (bpm) | −0.252 | 0.078 |
| BMI (Kg/m2) | −0.764** | <0.001 |
| BSA (m2) | −0.167 | 0.246 |
| LA volume index (ml/m2) | −0.668** | <0.001 |
| Total LA stroke volume (ml) | −0.072 | 0.820 |
| LA expansion index (%) | 0.828** | <0.001 |
| LVEF (%) | 0.024 | 0.718 |
| LV mass index (gm/m2) | −0.655** | <0.001 |
**Highly significant.
The higher age, systolic BP, BMI, LA volume index, and LV mass index and the lower LA expansion index were associated with lower global PALS.
Fig. 2.

Correlations with global PALS with [A] Age, [B] SBP, [C] BMI, [D] LA volume index, [E] LA expansion index, [F] LV mass index.
By using the receiver operating characteristic [ROC] curve we found that the cut off value for global PALS below which we can detect impairment of LA function [as assessed by global PALS] even if the LA is of normal size in hypertensive patients was ≤35% with sensitivity of 98% and specificity of 98% Fig. 3.
Fig. 3.
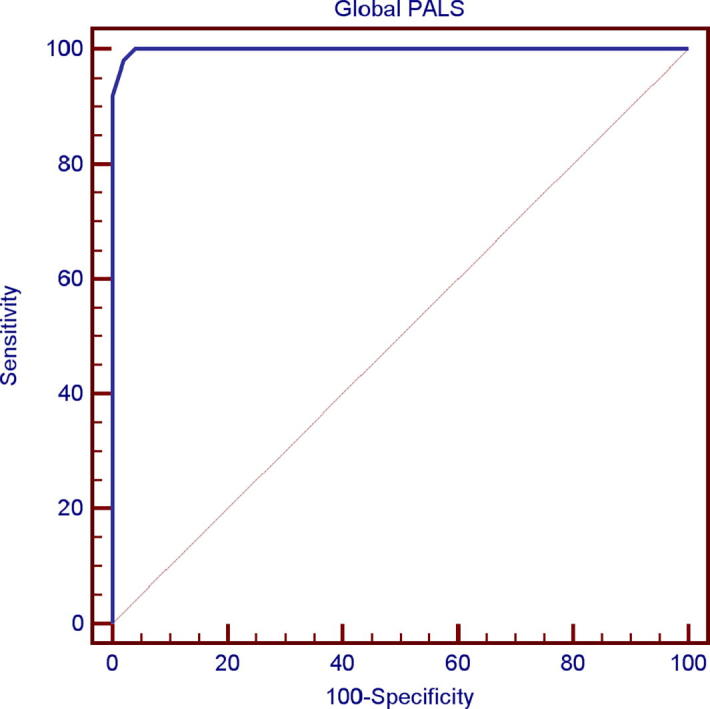
ROC curve for global PALS. “Below this value “≤35%”, the studied subject had LA dysfunction before LA enlargement with sensitivity of 98% and specificity of 98%”.
4. Discussion
Arterial hypertension is one of the independent risk factors for atrial fibrillation which is in turn responsible for increased cardiovascular mortality.16 In recent years, strain rate imaging (SRI) has been shown to be an accurate method for quantifying regional myocardial function independent of cardiac rotation and tethering effect. Meanwhile, a few studies have focused on quantifying LA function in hypertensive patients.17
In this study we tried to detect early LA dysfunction in hypertensive patients and we meant by early that it’s before changes in LA size represented in LA volume.
Regarding choice of controls, we used a control group of 50 healthy subjects whom we chose to be matching with the hypertensive group regarding their criteria; age, gender, heart rate, BMI and BSA, this aimed at minimizing the impact of these factors on LA function while comparing it between both groups.
Many studies didn’t match all these criteria between the diseased and control groups, in a study done by Mondillo et al.11 (n = 190), both groups were age matched but not matching in BMI. Also, in 2 another studies, both groups were matching regarding age but not BMI.[18], [19] In 2014, Sahebjam et al.20 (n = 124) matched their candidates regarding age, HR and BSA but not regarding gender and BMI. In these studies in which BMI wasn’t matched between both groups, BMI couldn’t be tested as a negative factor on LA function.
Regarding LV measurements, both groups were matching for LVEF only, but the hypertensive group had greater LV mass index and worse LV diastolic function and this was expected as a result of hypertension. This was in concordance with Miyoshi et al.18 (n = 190) in which hypertensive group had greater LV mass and higher grade of LV diastolic dysfunction (P = 0.02 and 0.03 respectively).
The key point in our study was to ensure that all the studied subjects had normal LA size, and the best to express this is LA volume index. This was important for early detection of LA dysfunction before LA enlargement. This keypoint was also evident in a study by Mondillo et al.11 where all the subjects had normal LA size.
In our study, although all subjects had normal LA volume, hypertensive group had larger LA volume compared to the control group. Furthermore, LA function measured in conventional methods [Total LA stroke volume and LA expansion index] was more affected in the hypertensive group. This is in contrast to the study done by Tsai et al.21 (n = 93), as there was no significant difference between the 2 groups regarding corresponding parameters of LA function (e.g LA expansion index) although a larger LA volume was found in the hypertensive group. A possible explanation for this difference is that the number of hypertensive patients was double the number of the control group.
By measurement of global peak atrial longitudinal strain, the global PALS [which represents the reservoir function of LA] was impaired in hypertensive group compared to the control group. This was in concordance with the results of Mondillo et al.11 where they found that hypertensive patients had early LA strain abnormalities compared to normal subjects (P < 0.001). Also, a study conducted by Cameli et al.22 (n = 116) showed that one of early effects of hypertension was affection of LA deformation indices expressed in reduced longitudinal strain which indicated preclinical LA dysfunction (P = 0.002). Furthermore, another study by Hassanin23 concluded that LA longitudinal strain representing its reservoir function was reduced in hypertensive group with highly significant P-value. In 2007, a study was conducted by Kokubu et al.19 (n = 130), they concluded that LA deformation indices were reduced in hypertensive patients (P < 0.001). Sahebjam M et al in 2014 Sahebjam et al.20 concluded that hypertension significantly affected LA reservoir function (detected by LA speckle tracking).
When different risk factors and studied parameters were correlated with global LA strain, risk factors that were found to affect LA strain adversely were DM, older age and higher BMI. The following studies were compared to our results:
Regarding diabetes mellitus, Mondillo et al.11 stated that DM adversely affected LA strain and these changes were independent of LA dilatation and are more prominent in patients with hypertension and DM together. In 2015, Tadic et al.24 (n = 164) stated the deleterious effect of type II DM on LA remodeling expressed in reduced LA strain using speckle tracking echocardiography. In contrary to our results, a study conducted by Sahebjam et al.20 found that DM didn’t affect LA strain in hypertensive patients (P = 0.17). This could be explained by that around half of hypertensive patients (also with DM) enrolled in this study were on RAAS inhibitors and so they had a relatively higher LA strain value.
Regarding age, a study conducted by Okamatsu et al.25 (n = 140) concluded that aging adversely affects LA size and function as assessed by LA strain (P < 0.001). On the other hand, Sahebjam et al Sahebjam et al.20 found no correlation between age and LA strain in hypertensive patients (P = 0.8). This could be due to that the mean age in this study (54 years) was far below the elderly age group (above 65 years old).
In studying the body mass index, a study done in 2015 stated that overweight and obese hypertensive patients had worse LA function (measured by 2D strain) compared with hypertensive patients with normal BMI (P < 0.001).24 Corresponding results were found by Miyoshi et al.,18 BMI independently affected LA strain negatively by 2D speckle tracking echocardiography.
Other parameters that were related adversely to global LA strain in the current study were systolic blood pressure, LV diastolic function, LV mass index, LA volume index and LA expansion index.
Regarding systolic blood pressure, in the study conducted by Miyoshi et al.,18 systolic blood pressure adversely affected LA strain in hypertensive patients.18 Also, Tadic et al.24 found that blood pressure variability (poor control of blood pressure) in hypertension was correlated to reduced LA strain (P = 0.002). In the study conducted by Miyoshi et al.,18 they found a significant correlation between LV diastolic dysfunction (E/e′) and reduced LA systolic strain (P < 0.001). Tsai et al.21 concluded a negative impact of LV diastolic dysfunction (E/e′) on LA function. In 2015, Xu26 (n = 248) showed that higher LV mass index significantly correlated with reduced LA function assessed by speckle tracking (P = 0.03). Also, Miyoshi et al.18 showed that LV mass index adversely affected LA strain. In contrary, Kokubu et al.19 found no correlation between LV mass index and LA systolic strain this is because they compared 2 hypertensive groups with and without high LV mass index. Cameli et al.22 found that higher LA volume index was found to be an independent predictor of reduced LA systolic strain (P = 0.002). Similarly, Miyoshi et al.18 found a similar correlation between LA size and LA function expressed in LA strain by 2D speckle tracking. This correlation is somewhat logic because changes in both LA size and function are the 2 arms by which systemic hypertension affects LA hemodynamics.
Regarding LA expansion index, Saraiva et al.5 (n = 64), found that lower LA expansion index correlated well with reduced global LA strain (P = 0.03). This could be explained by that both LA expansion index and global LA strain represent LA reservoir function which is affected early in hypertensive patients.
In our study, LA stroke volume didn’t correlate significantly with global peak atrial longitudinal strain which could be explained by that LA stroke volume represents LA booster pump function which is not expressed fully in the global PALS.
Regarding LVEF, it didn’t affect LA strain significantly. A possible explanation for this is that all the studied subjects in the current study had normal LVEF and so it may be of significant impact in the reduced LVEF values. This was corresponding to Kokubu et al.19 in their study that showed no correlation between LVEF and LA strain. Also, Mondillo et al.11 found that LVEF did not significantly affect LA deformation indices by speckle tracking.
5. Conclusions
Early LA dysfunction in hypertensive patients could be detected by speckle tracking technique even before overt LA enlargement as different indices of LA dysfunction (Total LA stroke volume, LA expansion index and global PALS) were significantly lower in the hypertensive group despite the normal LA volume index.
6. Limitations
DM could not be excluded as more than 50% of hypertensive patients were diabetics, also, LV diastolic dysfunction could not be excluded as most of hypertensive patients had LV diastolic dysfunction. Duration of HTN was difficult to be assessed accurately in the study population. A relatively small study population number was included and a further study with large number is warranted.
7. Funds
None
8. Conflicts of interest
The authors have no conflicts of interest
Acknowledgement
Many thanks for the workers in the Echo lab without the help of them this piece of work could never have been done.
Footnotes
Peer review under responsibility of Egyptian Society of Cardiology.
References
- 1.Tsioufis C., Taxiarchou E., Syrseloudis D. Left ventricular mass but not geometry determines left atrial size in the early stages of hypertension. J Hum Hypertens. 2009;23:674–679. doi: 10.1038/jhh.2009.13. [DOI] [PubMed] [Google Scholar]
- 2.Thomas L. Assessment of atrial function. Heart Lung Circ. 2007;16:234–242. doi: 10.1016/j.hlc.2007.03.009. [DOI] [PubMed] [Google Scholar]
- 3.Baltabaeva A., Marciniak M., Bijnens B. How to detect early left atrial remodelling and dysfunction in mild to moderate hypertension. J Hypertens. 2009;27:2086–2093. doi: 10.1097/HJH.0b013e32832f4f3d. [DOI] [PubMed] [Google Scholar]
- 4.Vianna-Pinton R., Moreno C.A., Baxter C.M. Two-dimensional speckle-tracking echocardiography of the left atrium: feasibility and regional contraction and relaxation differences in normal subjects. J Am Soc Echocardiogr. 2009;22:299–305. doi: 10.1016/j.echo.2008.12.017. [DOI] [PubMed] [Google Scholar]
- 5.Saraiva R.M., Demirkol S., Buakhamsri A. Left atrial strain measured by two-dimensional speckle tracking represents a new tool to evaluate left atrial function. J Am Soc Echocardiogr. 2010;23:172–180. doi: 10.1016/j.echo.2009.11.003. [DOI] [PubMed] [Google Scholar]
- 6.Mancia G., Fagard R., Narkiewicz K. 2013 ESH/ESC Guidelines for the management of arterial hypertension: The Task Force for the Management of Arterial Hypertension of the European Society of Hypertension (ESH) and of the European Society of Cardiology (ESC) Eur Heart J. 2013;34:2159–2219. doi: 10.1093/eurheartj/eht151. [DOI] [PubMed] [Google Scholar]
- 7.Lang R.M., Bierig M., Devereux R.B. Recommendations for chamber quantification: a report from the American Society of Echocardiography’s Guidelines and Standards Committee and the Chamber Quantification Writing Group, developed in conjunction with European Association of Echocardiography, a branch of the European Society of Cardiology. J Am Soc Echocardiogr. 2005;18:1440–1463. doi: 10.1016/j.echo.2005.10.005. [DOI] [PubMed] [Google Scholar]
- 8.Ogawa K., Hozumi T., Sugioka K. Automated assessment of left atrial function from time-left atrial volume curves using a novel speckle tracking imaging method. J Am Soc Echocardiogr. 2009;22:63–69. doi: 10.1016/j.echo.2008.10.016. [DOI] [PubMed] [Google Scholar]
- 9.Saha S.K., Anderson P.L., Caracciolo G. Global left atrial strain correlates with CHADS(2) risk score in patients with atrial fibrillation. J Am Soc Echocardiogr. 2011;24:506–512. doi: 10.1016/j.echo.2011.02.012. [DOI] [PubMed] [Google Scholar]
- 10.D’Ascenzi F., Cameli M., Zacà V. Supernormal diastolic function and role of left atrial myocardial deformation analysis by 2D speckle tracking echocardiography in elite soccer players. Echocardiography. 2011;28:320–326. doi: 10.1111/j.1540-8175.2010.01338.x. [DOI] [PubMed] [Google Scholar]
- 11.Mondillo S., Cameli M., Caputo M.L. Early detection of left atrial strain abnormalities by speckle-tracking in hypertensive and diabetic patients with normal left atrial size. J Am Soc Echocardiogr. 2011;24:898–908. doi: 10.1016/j.echo.2011.04.014. [DOI] [PubMed] [Google Scholar]
- 12.Wakami K., Ohte N., Asada K. Correlation between left ventricular end-diastolic pressure and peak left atrial wall strain during left ventricular systole. J Am Soc Echocardiogr. 2009;22:847–851. doi: 10.1016/j.echo.2009.04.026. [DOI] [PubMed] [Google Scholar]
- 13.Manovel A., Dawson D., Smith B., Nihoyannopoulos P. Assessment of left ventricular function by different speckle-tracking software. Eur J Echocardiogr. 2010;11:417–421. doi: 10.1093/ejechocard/jep226. [DOI] [PubMed] [Google Scholar]
- 14.Gottdiener J.S., Bednarz J., Devereux R. American Society of Echocardiography recommendations for use of echocardiography in clinical trials. J Am Soc Echocardiogr: Off Publ Am Soc Echocardiogr. 2004;17:1086–1119. doi: 10.1016/j.echo.2004.07.013. [DOI] [PubMed] [Google Scholar]
- 15.Cameli M., Lisi M., Righini F.M., Massoni A., Mondillo S. Left ventricular remodeling and torsion dynamics in hypertensive patients. Int J Cardiovasc Imag. 2013;29:79–86. doi: 10.1007/s10554-012-0054-0. [DOI] [PubMed] [Google Scholar]
- 16.Raman S.V. The hypertensive heart. An integrated understanding informed by imaging. J Am Coll Cardiol. 2010;55:91–96. doi: 10.1016/j.jacc.2009.07.059. [DOI] [PMC free article] [PubMed] [Google Scholar]
- 17.Boyd A.C., Eshoo S., Richards D.A., Thomas L. Hypertension accelerates the “normal” aging process with a premature increase in left atrial volume. J Am Soc Hypertens. 2013;7:149–156. doi: 10.1016/j.jash.2012.12.008. [DOI] [PubMed] [Google Scholar]
- 18.Miyoshi H., Oishi Y., Mizuguchi Y. Contribution of obesity to left atrial and left ventricular dysfunction in asymptomatic patients with hypertension: a two-dimensional speckle-tracking echocardiographic study. J Am Soc Hypertens. 2014;8:54–63. doi: 10.1016/j.jash.2013.08.005. [DOI] [PubMed] [Google Scholar]
- 19.Kokubu N., Yuda S., Tsuchihashi K. Noninvasive assessment of left atrial function by strain rate imaging in patients with hypertension: a possible beneficial effect of renin-angiotensin system inhibition on left atrial function. Hypertens Res. 2007;30:13–21. doi: 10.1291/hypres.30.13. [DOI] [PubMed] [Google Scholar]
- 20.Sahebjam M., Mazareei A., Lotfi-Tokaldany M. Comparison of left atrial function between hypertensive patients with normal atrial size and normotensive subjects using strain rate imaging technique. Arch Cardiovasc Imag. 2014;2(1). [Google Scholar]
- 21.Tsai W.C., Huang Y.Y., Liu Y.W. Changes of left atrial phasic function assessed by speckle tracking echocardiography in untreated hypertension. J Med Ultrasound. 2012;20:220–227. [Google Scholar]
- 22.Cameli M. Left atrial strain in patients with arterial hypertension. Int Cardiovasc Forum J. 2013;1:31–36. [Google Scholar]
- 23.Hassanin N. Left atrium function in systemic hypertension. Int J Sci Res (IJSR) 2015;4:1813–1816. [Google Scholar]
- 24.Tadic M., Cuspidi C. The influence of type 2 diabetes on left atrial remodeling. Clin Cardiol. 2015;38(1):48–55. doi: 10.1002/clc.22334. [DOI] [PMC free article] [PubMed] [Google Scholar]
- 25.Okamatsu K., Takeuchi M., Nakai H. Effects of aging on left atrial function assessed by two-dimensional speckle tracking echocardiography. J Am Soc Echocardiogr. 2009;22(1):70–75. doi: 10.1016/j.echo.2008.11.006. [DOI] [PubMed] [Google Scholar]
- 26.Xu T.Y., Sun J.P., Lee A.P. Left atrial function as assessed by speckle-tracking echocardiography in hypertension. Medicine (Baltimore) 2015;94(6) doi: 10.1097/MD.0000000000000526. [DOI] [PMC free article] [PubMed] [Google Scholar]