

Abstract
Background:
Chronic and abnormal increase of different types of dyslipidemia leads to some important diseases, such as constriction and abstraction of vessels in various parts of the body, especially in the heart. High lipid profile, such as increased total cholesterol and LDL as well as decreased HDL are recognized as cardiovascular disease risk factors. The present study aimed to estimate the prevalence of different types of dyslipidemia in Iran by a meta-analysis method.
Methods:
A literature search for studies published during 1998-2015 was carried out using both Persian and English databases (SID, Magiran, IranMedex, MedLib, PubMed, and Scopus). Keywords such as lipid, dyslipidemia, CVD, cardiovascular risk factors, hypercholesterolemia, high LDL-C, low HDL-C, and prevalence were used in the search. Random-effects model was used for the analysis using STATA (version 11.2).
Results:
In total, 163 articles were identified of which 49 articles fulfilled the inclusion criteria. The estimated prevalence (95% confidence interval) of eligible articles for high cholesterol ≥200 mg/dl and ≥240 mg/dl was 42% (95% CI: 38-45) and 17% (95% CI: 14-20), respectively. Moreover, the prevalence (95% confidence interval) for high LDL-C ≥130 mg/dl and ≥160 mg/dl was 40% (95% CI: 32-48) and 19% (95% CI: 16-23), respectively. The pooled prevalence estimate for low HDL-C (<40 among males, <50 among females) was 43% (95% CI: 33-53) in both sexes of the Iranian people. All types of lipid component abnormalities (hypercholesterolemia, high LDL-C, and low HDL-C) were more prevalent in women.
Conclusion:
The results indicate that the prevalence of different types of dyslipidemia in Iran is substantial. Given the risk of complications (e.g. cardiovascular disease and control of different types of dyslipidemia) in Iranian people, it is important to reduce the burden of cardiovascular diseases.
Keywords: Cardiovascular diseases , Iran , Dyslipidemias
What’s Known
The components of lipid were investigated in a systematic review
The prevalence of dyslipidemia with respect to gender is substantial in Iran.
What’s New
The prevalence of different types of dyslipidemia in Iran is substantial.
Given the risk of complications (e.g. cardiovascular disease, control of different types of dyslipidemia) in Iranian people, it is important to reduce the burden of cardiovascular diseases.
Introduction
Cardiovascular diseases (CVD) are one of the major health problems in the world and its increasing prevalence is threatening the human health.1,2 While there are many prevention programs for CVD incidence, these disorders are the most common cause of mortality in several countries.3 According to the findings of various studies, the cause of 40-45% of mortality is related to CVD. Based on the third report of the World Health Organization, CVD (e.g. heart failure, stroke, and sudden cardiac death) is the cause of 12 million annual deaths worldwide.4 The prevalence of CVD in developing countries is higher than developed countries.5
CVD includes coronary diseases, brain artery diseases, and peripheral artery diseases.3 In coronary diseases, vessels that provide blood to the heart are obstructed; a common CVD disorder. Coronary artery obstruction is usually caused by arteriosclerosis. The sediment of cholesterol, calcium, or other materials in the inner layer of the artery and connective tissue cause arteriosclerosis.1 Arteriosclerosis causes ischemic coronary artery and finally death6 in which 25% of patients die suddenly without any signs.7 Chronic and abnormal increase of triglyceride (TG) and total cholesterol (TC) concentration leads to some important diseases, such as constriction and abstraction of vessels in various parts of the body, especially in the heart.8 The role of hypercholesterolemia as a major risk factor for coronary artery disease (CAD) has been proven; however, the role of triglyceride is controversial.9 HDL is a protective factor.3
Changes in lifestyle due to the industrialization have altered peoples’ diet and reduced their physical activity, which in turn leads to increased hyperlipidemia. A positive relationship between TC level and the risk of CVD has been indicated. This relationship has been found in many populations, including younger and elderly, male and female, and patients with or without CVD.10 In addition, the elevation of LDL-C level leads to arteriosclerosis.3 Recent studies have shown that the main blood cholesterol is LDL-C. When the concentration of LDL-C elevates, it accumulates in the intima-media of the artery that feeds the brain and heart, and eventually, plaque is produced.7 On the other hand, HDL is a protective factor in CVD. Low HDL level incorporated with high TG level may cause a higher incidence of CVD.3
Studies have reported that CVD is one of the most important health problems in the Mediterranean and Middle Eastern countries (e.g. Iran) with an increasing prevalence.4 According to available reports, the prevalence of CVD is 19.4% in Iran. 2 Hence, a decline in coronary events would be possible by modifying the serum lipid levels. Assessment of a nationwide estimate of dyslipidemia prevalence, as a major CVD risk factor, is essential in order to conduct prevention programs efficiently. It will also enable health policy makers to apply the best treatment programs. Using a meta-analysis method, the present study aimed to assess the prevalence of lipid profile disorders (TC, LDL-C, and HDL-C) in Iran.
Materials and Methods
Search Method
A literature search for studies published from October 1998 until January 2016 was carried out using both Persian (IranMedex, Magiran, SID, Irandoc) and English (Scopus, ISI Web of Science, PubMed) databases. Keywords such as lipid, dyslipidemia, CVD, cardiovascular risk factors, hypercholesterolemia, high LDL-C, low HDL-C, prevalence, public health, and epidemiology were used in the search. Moreover, the references of the identified articles were searched for additional sources of information. As a complementary search tool, the references of the selected citations and non-published national surveys were also hand-searched and relevant articles were evaluated. All articles that contained the above-mentioned search keywords in their title or abstract were included. To reduce bias, two researchers (F. Sayehmiri and F. Kiani) independently performed the search, selection of articles, and data extraction.
Inclusion and Exclusion Criteria
The inclusion criteria were all types of population-based articles (i.e. local, sub-national, or national surveys) that were carried out on individuals aged ≥20 years without a history of CHD, hyperlipidemia, diabetes, or hypertension.
The exclusion criteria were languages other than Persian or English, meta-analysis, systematic review, and studies performed on individuals with a history of CHD, hyperlipidemia, diabetes, hypertension, obesity, overweight, or other diseases. Additionally, studies that were not population-based or included duplicate citations were excluded.
The STROBE (strengthening the reporting of observational studies in epidemiology) statement was used for the quality control of studies. The quality of studies was assessed according to variables related to the study objectives, characteristics of the study population, clear explanation of the inclusion/exclusion criteria, data collection method as well as validity, explicit findings, and appropriate data analysis methods. When necessary, the authors were contacted for additional information.
Data Extraction
Data extraction included information such as primary author, publication year, region, study type (local study or survey), sample size, age groups as well as the reported mean and prevalence of hypercholesterolemia, high LDL and low HDL in total, and gender. Two researchers independently reviewed the articles (abstract and full text) in order to collect the data according to the standard protocol. Disagreements were resolved by a discussion panel. Data were initially noted on collection forms and then entered into Microsoft Excel.
Data Synthesis and Analysis
The variance of prevalence was calculated using binomial distribution and the weighted mean was used for a combination of prevalence in different studies. Each article was assigned a weight based on 1/variance. I2 statistics was used to measure heterogeneity. Since a significant variation was found between the findings of different studies, a random-effects model was used for the analysis. The findings were then presented in forest plots (point estimations and 95% CI). All statistical analysis was performed using STATA (version 11.2).
Results
Initially, 163 full-text articles were identified of which 91 were excluded after title and abstract evaluation. From the remaining 72 articles, after full-text evaluation, 23 were excluded (7 duplicates, 4 lacked data, and 12 did not report prevalence). Eventually, 49 cross-sectional studies2,3,5,7,8,11-54 were selected for meta-analysis (figure 1). The extracted data from these studies are shown in table 1. Due to the severe heterogeneity of the reported prevalence (P<0.001), the meta-analysis was performed using a random-effects method.
Figure1.
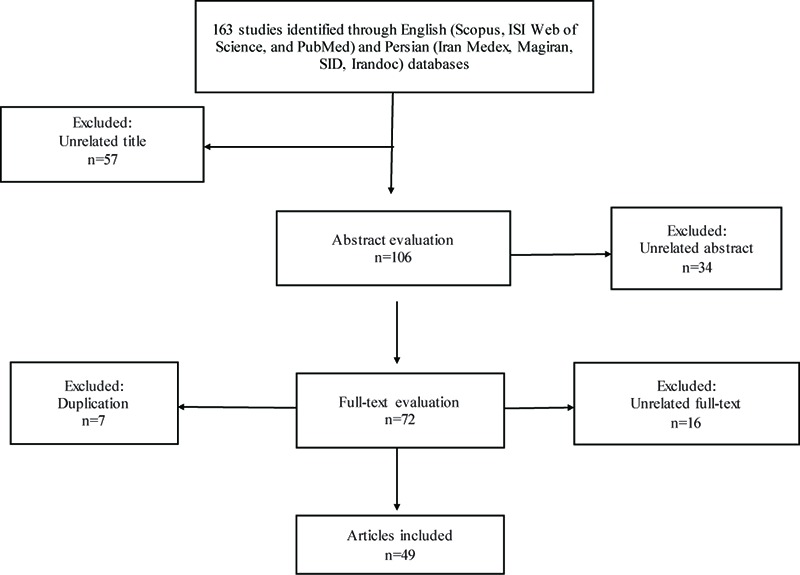
Flow chart of study selection according to MOOSE guidelines.
Table 1.
Summary of the studies on the prevalence of hypercholesterolemia, low HDL-C and high LDL-C levels, mean TC, HDL-C, and LDL-C.
| Reference | Year | Location and study design | Sample size | Age group | Cholesterol (mean±SD) | |
|---|---|---|---|---|---|---|
| Study | Publication | |||||
| Navaie11 | 1994 | 2000 | Tehran; local study | T: 2.705 | ˃30 | T: 196±44.7 |
| M: 1.296 | M: 188±41.1 | |||||
| F: 1.409 | F: 203±46.4 | |||||
| Fakhrzade12 | 1996-1997 | 2002 | Bushehr; local study | T: 1.036 | 30-64 | T: 199.6±47.8 |
| M: 370 | M: 195±46.1 | |||||
| F: 666 | F: 204.2±49.5 | |||||
| Saeedi13 | 1997-1998 | 2003 | Kermanshah; local study | T: 922 | ˃20 | T: 199.5±37.2 |
| M: 329 | M: 196.2±32.5 | |||||
| F: 593 | F: 201.3±39.4 | |||||
| Sarrafzadegan14 | 1998 | 1998 | Isfahan; local study | T: 2.200 | 19-70 | T: 196.4±27.5 |
| M: 1.000 | M: 193.1±28.8 | |||||
| F: 1.200 | F: 199.6±26.4 | |||||
| Karimi8 | 1999 | 2000 | Bushehr; local study | T: 1.206 | ˃20 | T: 181.7±44.4 |
| M: 410 | M: 179.6±43.5 | |||||
| F: 796 | F: 183.7±45.2 | |||||
| Azizi15 | 1999-2000 | 2003 | Tehran; local study | T: 6.246 | 20-60 | T: 210±47 |
| M: 2.339 | M: 206±44 | |||||
| F: 3.907 | F: 213±48 | |||||
| Azizi16 | 1999-2000 | 2003 | Tehran; local study | T: 1.766 | ˃60 | T: 222±46 |
| M: 911 | M: 212±40 | |||||
| F: 855 | F: 244±47 | |||||
| Fakhrzade17 | 2000 | 2005 | Qazvin; local study | T: 1.000 | ˃25 | |
| M: 499 | ||||||
| F: 501 | ||||||
| Yosefinia18 | 2000 | 2007 | Arak; local study | T: 4.303 | ˃30 | |
| M: 2.082 | ||||||
| F: 2.221 | ||||||
| Kelishadi19 | 2000-2001 | 2008 | Isfahan; local study | T: 3.694 | ˃20 | |
| M: 1.924 | ||||||
| F: 1.770 | ||||||
| Sadeghi20 | 2001 | 2005 | Isfahan, Najafabad, Arak; local study | F: 6.391 | ˃20 | F: 203.83±53.3 |
| Mohamadi fards5 | 2002 | 2003 | Isfahan, Najafabad; local study | T: 6.175 | ˃20 | |
| M: 3.005 | ||||||
| F: 3.169 | ||||||
| Mohamadi fards5 | 2002 | 2003 | Arak; local study | T: 6.339 | ˃20 | |
| M: 3.117 | ||||||
| F: 3.222 | ||||||
| Hajzade21 | 2002 | 2007 | Mashhad; local study | T: 2.215 | ˃40 | |
| M: 785 | ||||||
| F: 1.457 | ||||||
| Mellati22 | 2002-2003 | 2009 | Zanjan; local study | T: 2.768 | 21-75 | T: 186.3±41.7 |
| M: 1.310 | M: 182.1±39.4 | |||||
| F: 1.458 | F: 190.5±43.9 | |||||
| Sharifi23 | 2002-2003 | 2008 | Zanjan; local study | T: 2.941 | ˃20 | T: 189.6±38.4 |
| M: 1.396 | M: 182.5±35 | |||||
| F: 1.545 | F: 196.7±41.8 | |||||
| Amiri24 | 2003 | 2004 | Boshehr; local study | T: 2.092 | 25-64 | T: 209.2±52.5 |
| M: 992 | M: 204.96±51.1 | |||||
| F: 1.100 | F: 213.33±53.89 | |||||
| Agheli25 | 2003 | 2005 | Rasht; local study | T: 550 | ˃30 | |
| M: 285 | ||||||
| F: 265 | ||||||
| AghelIi25 | 2003 | 2005 | Ghazvin; local study | T: 550 | ˃30 | |
| M: 274 | ||||||
| F: 276 | ||||||
| Seyffarshad26 | 2003 | 2007 | East Azerbaijan, local study | T: 3.031 | 20-64 | T: 195.6±44.7 |
| M: 1.533 | M: 190.6±40.7 | |||||
| F: 1.498 | F: 199.17±47.3 | |||||
| Mahmoodi27 | 2003-2004 | 2006 | Tehran; local study | T: 232 | ˃55 | T: 185.81±47.05 |
| M: 120 | M: 185.71±49.1 | |||||
| F: 112 | F: 185.91±44.98 | |||||
| Esmaili-Nadimi3 | 2004 | 2004 | Rafsanjan; local study | T: 491 | ˃20 | T: 198.2±47.4 |
| M: 247 | M: 200.8±45.4 | |||||
| F: 244 | F: 195.5±49.2 | |||||
| Nabipour28 | 2004 | 2008 | Persian Gulf (Bushehr, Genaveh, Deilam); local study | T: 3.723 | 25-64 | T: 205.29±52.3 |
| M: 1.746 | M: 201.53±52.2 | |||||
| F: 1.977 | F: 210.05±51.52 | |||||
| Namayande29 | 2004 | 2011 | Yazd; local study | T: 2.000 | 20-74 | |
| M: 1.000 | ||||||
| F: 1.000 | ||||||
| Aghasadeghi30 | 2004-2005 | 2008 | Shiraz; local study | T: 198 | 21-80 | |
| M: 73 | ||||||
| F: 125 | ||||||
| Chehrei31 | 2005 | 2007 | Arak; national survey | T: 750 | 25-58 | T: 175.5±45.6 |
| M: 170 | M: 170.2±45.3 | |||||
| F: 580 | F: 180.9±45.9 | |||||
| Malek32 | 2005 | 2009 | Semnan; local study | T: 3.799 | 30-70 | |
| M: 1.695 | ||||||
| F: 2.104 | ||||||
| Alikhani33 | 2005 | 2009 | Country; national survey | T: 65.781 | 25-64 | T: 197.8±44.9 |
| M: 32.842 | M: 195.1±40 | |||||
| F: 32.932 | F: 200.5±48.8 | |||||
| Ghiasvand34 | 2005 | 2006 | Tehran; local study | T: 266 | 21-46 | T: 182.92±37.46 |
| Ghoddosi35 | 2005 | 2006 | Tehran; local study | T: 6.932 | ˃20 | |
| M: 4.013 | ||||||
| F: 5.619 | ||||||
| Vaghari36 | 2005 | 2009 | Golestan; local study | T: 1.995 | 25-65 | T: 203.6±40.7 |
| M: 997 | M: 196.7±39.5 | |||||
| F: 998 | F: 209.4±42.9 | |||||
| Hatami37 | 2006 | 2007 | Tehran; local study | T: 3.000 | ˃20 | T: 220.64±55.34 |
| M: 1.619 | ||||||
| F: 1.381 | ||||||
| Asgari38 | 2007 | 2007 | Country; national survey | T: 19.017 | 25-64 | T: 185.5±43.8 |
| M: 9.078 | M: 181.4±40.8 | |||||
| F: 9.939 | F: 189.6±47.8 | |||||
| Delavari39 | 2007 | 2008 | Country; national survey | T: 3.024 | 25-64 | |
| Javadi40 | 2007 | 2009 | Qazvin; local study | F: 400 | ˃20 | F: 173.5±32.6 |
| Azabdaftari41 | 2007 | 2009 | Ahvaz; local study | M: 91 | ˃25 | |
| Esteghamati42 | 2007 | 2009 | Country; national survey | T: 3.397 | 20-64 | T: 195.63±1.10 |
| M: 1.645 | ||||||
| F: 1.752 | ||||||
| Saberi43 | 2007 | 2011 | Kashan; local study | M: 429 | 21-73 | |
| Bahonar44 | 2008-2009 | 2010 | Isfahan; local study | T: 585 | ˃20 | T: 198±39 |
| Nikparvar45 | 2008-2009 | 2015 | Bandar Abbas; local study | T: 137 | 20-27 | T: 167.08±33.68 |
| M: 42 | ||||||
| F: 95 | ||||||
| Agajani Delavar46 | 2009 | 2009 | Babol; local study | F: 984 | 30-50 | |
| Asayi47 | 2009 | 2013 | Gonabad; local study | T: 606 | 20-84 | T: 200.13±41.20 |
| M: 205 | M: 200.16±41.1 | |||||
| F: 401 | F: 199.99±41.3 | |||||
| Majdi7 | 2009-2010 | 2012 | North Khorasan; local study | T: 11.704 | ˃20 | T: 193.7±41.3 |
| M: 5.730 | M: 196.4±42.7 | |||||
| F: 5.974 | F: 190.9±39.8 | |||||
| Heydari48 | 2010 | 2010 | Shiraz; local study | M: 341 | 20-54 | |
| Hatmi49 | 2011 | 2011 | Tehran; local study | T: 27.203 | ˃30 | |
| M: 26.785 | ||||||
| F: 418 | ||||||
| Saberi50 | 2011 | 2011 | Rasht; local study | T: 103 | ˃20 | T: 152.9±37 |
| M: 24 | M: 149.2±31.1 | |||||
| F: 79 | F: 154±40.1 | |||||
| Marjani51 | 2011 | 2012 | Golestan; local study | F: 160 | 20-40 | F: 182.03±56.33 |
| Sharifi52 | 2011-2012 | 2015 | Zanjan; local study | M: 120 | ˃30 | |
| Ansari53 | 2012 | 2012 | Isfahan, Markazi; local study | M: 1.914 | ˃20 | |
| Hasankhani2 | 2012 | 2012 | Kermanshah; local study | T: 400 | ˃20 | |
| Javadi54 | 2012 | 2014 | Qazvin; local study | T: 996 | ˃24 | |
| M: 478 | ||||||
| F: 518 | ||||||
| Reference | Prevalence of high cholesterol (%) | LDL-C (mean±SD) | Prevalence of high LDL-C (%) | HDL-C (mean±SD) | Prevalence of low HDL-C (%) | |||||||||
|---|---|---|---|---|---|---|---|---|---|---|---|---|---|---|
| ≥200 | ≥240 | ≥130 | ≥160 | ≤40 | ≤35 | |||||||||
| Navaie11 | T: 42.6 | T: 15.4 | T: 124±37.4 | T: 40.7 | T: 15.5 | T: 36.6±8.9 | T: 44.4 | |||||||
| M: 118±35 | M: 34.9±8.2 | |||||||||||||
| F: 129±38.6 | F: 38.3±9.2 | |||||||||||||
| Fakhrzade12 | T: 47.6 | |||||||||||||
| M: 43.9 | ||||||||||||||
| F: 50.3 | ||||||||||||||
| Saeedi13 | T: 37.5 | T: 122.4±43.3 | T: 37.9±8.6 | T: 14 | ||||||||||
| M: 34.8 | M: 117.3±30 | M: 37.4±4 | ||||||||||||
| F: 39.1 | F: 125.3±48.9 | F: 38.1±10.3 | ||||||||||||
| Sarrafzadegan14 | T: 5.6 | T: 123.7±24 | T: 32 | T: 40.3±5.2 | T: 52.3 | |||||||||
| M: 4.5 | M: 120±25.8 | M: 23.5 | M: 40.2±5.5 | M: 57.6 | ||||||||||
| F: 6.7 | F: 127.3±22.2 | F: 40.5 | F: 40.4±4.9 | F: 47 | ||||||||||
| Karimi8 | T: 34.1 | T: 9.5 | T: 24.5 | T: 9.2 | T: 16.1 | |||||||||
| M: 29.9 | M: 99.3±41.6 | M: 20 | M: 46.3±16.8 | M: 20.7 | ||||||||||
| F: 36.2 | F: 108.8±63.8 | F: 26.8 | F: 49.2±16.7 | F: 13.8 | ||||||||||
| Azizi15 | T: 55 | T: 24 | T: 133±40 | T: 58 | T: 23 | T: 43±11 | T: 19 | |||||||
| M: 53 | M: 20 | M: 129±38 | M: 55 | M: 20 | M: 39±9 | M: 30 | ||||||||
| F: 56 | F: 26 | F: 135±40 | F: 60 | F: 24 | F: 45±11 | F: 13 | ||||||||
| Azizi16 | T: 72.6 | T: 39.7 | T: 150±40 | T: 68.2 | T: 37.8 | T: 43±11 | T: 20.1 | |||||||
| M: 61.2 | M: 25 | M: 140±36 | M: 59 | M: 26.9 | M: 40±10 | M: 3.9 | ||||||||
| F: 84.7 | F: 55 | F: 161±41 | F: 78.3 | F: 46.9 | F: 47±11 | F: 14.8 | ||||||||
| Fakhrzade17 | T: 31.7 | T: 24.7 | T: 10.8 | T: 53.9 | ||||||||||
| Yosefinia18 | T: 20.9 | T: 18.1 | T: 33.1 | |||||||||||
| M: 18.4 | M: 15.7 | M: 60.1 | ||||||||||||
| F: 23.4 | F: 20.2 | F: 46.6 | ||||||||||||
| Kelishadi19 | T: 25.2 | T: 18.23 | T: 24.4 | |||||||||||
| M: 21.31 | M: 14.82 | M: 26.93 | ||||||||||||
| F: 29.1 | F: 21.63 | F: 21.87 | ||||||||||||
| Sadeghi20 | F: 21.5 | F: 123.67±42.01 | F: 17.5 | |||||||||||
| Mohamadi fards5 | T: 20.3 | T: 34.19 | T: 28.5 | |||||||||||
| M: 17.7 | M: 33.5 | M: 38.6 | ||||||||||||
| F: 23 | F: 34.8 | F: 18.25 | ||||||||||||
| Mohamadi fards5 | T: 17.3 | T: 36.35 | T: 29.38 | |||||||||||
| M: 15.1 | M: 33.7 | M: 31.15 | ||||||||||||
| F: 19.4 | F: 39 | F: 27.6 | ||||||||||||
| Hajzade21 | T: 61.2 | |||||||||||||
| M: 59.4 | ||||||||||||||
| F: 63 | ||||||||||||||
| Mellati22 | T: 35.7 | T: 116.7±38.3 | T: 53.2 | T: 39±6.7 | T: 78.5 | |||||||||
| M: 31.3 | M: 112.2±36.7 | M: 49.7 | M: 38±6.4 | M: 63.9 | ||||||||||
| F: 40 | F: 121.2±39.8 | F: 56.6 | F: 39.9±6.9 | F: 93.1 | ||||||||||
| Sharifi23 | T: 47.3 | T: 11.9 | T: 116.33±35.6 | T: 35 | T: 13.8 | T: 42.6±5.1 | T: 55.7 | T: 23.7 | ||||||
| M: 38.6 | M: 7.9 | M: 111.45±34.1 | M: 30.3 | M: 10.8 | M: 39.5±4.4 | M: 63 | M: 27.7 | |||||||
| F: 54.8 | F: 15.1 | F: 121.2±37 | F: 39.3 | F: 16.7 | F: 45.7±5.7 | F: 52.9 | F: 20.1 | |||||||
| Amiri24 | T: 55.1 | T: 24 | T: 131.5±66.7 | T: 50.4 | T: 22.3 | T: 42.9±53.5 | T: 61 | |||||||
| M: 51.2 | M: 21 | M: 129.34±57.47 | M: 46.7 | M: 20.4 | M: 39.21±41.2 | M: 28 | ||||||||
| F: 58.7 | F: 26.7 | F: 133.72±75.78 | F: 53.6 | F: 24 | F: 46.6±62.92 | F: 52 | ||||||||
| Agheli25 | T: 27.5 | T: 14.7 | T: 18.5 | T: 46.45 | ||||||||||
| M: 20.7 | M: 6.3 | M: 12.1 | M: 60.2 | |||||||||||
| F: 34.3 | F: 23 | F: 24.9 | F: 32.5 | |||||||||||
| Agheli25 | T: 25.9 | T: 14.3 | T: 16.5 | T: 10.1 | ||||||||||
| M: 29 | M: 17.8 | M: 13.9 | M: 15.1 | |||||||||||
| F: 22.8 | F: 10.7 | F: 19.1 | F: 5.1 | |||||||||||
| Seyffarshad26 | T: 10.9 | |||||||||||||
| M: 9 | ||||||||||||||
| F: 12.8 | ||||||||||||||
| Mahmoodi27 | T: 29.7 | T: 95.98±36.16 | T: 10.3 | T: 56.9±15.52 | T: 12.9 | |||||||||
| M: 30.8 | M: 95.20±27.34 | M: 10 | M: 53.48±14.63 | M: 16.7 | ||||||||||
| F: 28.6 | F: 96.76±44.98 | F: 10.7 | F: 50.3±14.4 | F: 8.9 | ||||||||||
| Esmaili-Nadimi3 | T: 44.4 | T: 20.6 | T: 113.6±37.7 | T: 32.6 | T: 10.8 | T: 48.9±12.7 | T: 8.4 | |||||||
| M: 115.2±37.5 | M: 47.5±10.7 | |||||||||||||
| F: 111.95±37.9 | F: 50.3±14.4 | |||||||||||||
| Nabipour28 | T: 52 | T: 21.8 | T: 126±57.5 | T: 45.6 | T: 19.7 | T: 45.2±46.1 | T: 48.5 | |||||||
| M: 48.5 | M: 18.7 | M: 122.93±51.42 | M: 42.9 | M: 17.3 | M: 42.14±44.53 | M: 58.5 | ||||||||
| F: 55.4 | F: 24.8 | F: 129.46±63.53 | F: 48.2 | F: 22 | F: 48.11±47.60 | F: 38.5 | ||||||||
| Namayande29 | T: 35.4 | T: 12.2 | T: 26.7 | T: 5.7 | T: 24.2 | |||||||||
| M: 10.63 | ||||||||||||||
| F: 13.25 | ||||||||||||||
| Aghasadeghi30 | T: 29.3 | T: 7.1 | T: 27.8 | T: 6.3 | T: 38.9 | |||||||||
| Chehrei31 | T: 28.5 | T: 104.2±41.9 | T: 25.5 | T: 46.21±12 | T: 31.7 | |||||||||
| M: 30.2 | M: 98.3±40.7 | M: 19.9 | M: 44.3±11.4 | M: 41.6 | ||||||||||
| F: 22.9 | F: 110±43 | F: 27.3 | F: 47.7±12.5 | F: 29.4 | ||||||||||
| Malek32 | T: 30.7 | |||||||||||||
| M: 8.7 | ||||||||||||||
| F: 48.5 | ||||||||||||||
| Alikhani33 | T: 45.1 | |||||||||||||
| M: 42.7 | ||||||||||||||
| F: 47.5 | ||||||||||||||
| Ghiasvand34 | T: 50.8 | T: 110.80±30.15 | T: 25.4 | T: 52.29±22.68 | T: 60.6 | |||||||||
| Ghoddosi35 | T: 24 | T: 22.2 | T: 20.7 | |||||||||||
| M: 19.7 | M: 20.3 | M: 31.4 | ||||||||||||
| F: 26.9 | F: 25.1 | F: 13 | ||||||||||||
| Vaghari36 | T: 50 | |||||||||||||
| M: 44.7 | ||||||||||||||
| F: 57 | ||||||||||||||
| Hatami37 | T: 61 | T: 128.15±41.74 | T: 45.5 | T: 41.68±13.24 | T: 5.4 | |||||||||
| Asgari38 | T: 40.2 | T: 7.3 | T: 42.94±8 | T: 60.4 | ||||||||||
| M: 35.1 | M: 5.6 | M: 40.83±7.23 | M: 49.7 | |||||||||||
| F: 45.3 | F: 8.9 | F: 45.10±8.81 | F: 70.2 | |||||||||||
| Delavari39 | T: 43.5 | T: 80.1 | T: 79.9 | |||||||||||
| M: 41.6 | M: 78.7 | M: 75.5 | ||||||||||||
| F: 45.3 | F: 81.5 | F: 84 | ||||||||||||
| Javadi40 | F: 4.1 | F: 101.2±29 | F: 4.1 | F: 43.6±8 | F: 14.7 | |||||||||
| Azabdaftari41 | T: 42.9 | M: 33 | M: 44 | |||||||||||
| Esteghamati42 | T: 42.9 | T: 14.1 | ||||||||||||
| M: 40.4 | M: 11 | |||||||||||||
| F: 45.4 | F: 17.3 | |||||||||||||
| Saberi43 | T: 51.3 | |||||||||||||
| Bahonar44 | F: 48.2 | T: 117±28 | T: 33.3 | T: 46±11 | T: 26.4 | |||||||||
| Nikparvar45 | T: 21.2 | T: 102.47±29.95 | T: 19 | T: 47.64±9.49 | T: 46.7 | |||||||||
| M: 14.3 | M: 19 | M: 36.7 | ||||||||||||
| F: 24.2 | F: 18.9 | F: 51.6 | ||||||||||||
| Agajani Delavar46 | F: 38.6 | F: 11.4 | F: 24.1 | F: 7.5 | F: 17 | |||||||||
| Asayi47 | T: 45.6 | T: 16.6 | T: 133.05±36.97 | T: 49.6 | T: 22.1 | T: 40.37±6.92 | T: 13.5 | |||||||
| M: 47.1 | M: 17.5 | M: 133.32±38.65 | M: 47.6 | M: 22.3 | M: 39.26±6.72 | M: 17.5 | ||||||||
| F: 44.9 | F: 15.8 | F: 132.91±36.12 | F: 50.6 | F: 21.9 | F: 40.95±6.96 | F: 11.6 | ||||||||
| Majdi7 | T: 34.5 | T: 109.3±3.7 | T: 58.4 | T: 48.4±1.2 | T: 40.9 | |||||||||
| M: 35.3 | M: 107.7±3.9 | M: 56.6 | M: 46.8±1.3 | M: 54.3 | ||||||||||
| F: 33.7 | F: 110.9±3.4 | F: 60.3 | F: 50±1.2 | F: 27.4 | ||||||||||
| Heydari48 | T: 33.4 | T: 49.3 | ||||||||||||
| Hatmi49 | T: 34.8 | T: 25.7 | T: 31.1 | |||||||||||
| Saberi50 | T: 9.7 | T: 84.1±34 | T: 10.7 | T: 44.1±10.7 | T: 30.1 | |||||||||
| M: 4.2 | M: 83.2±28.4 | M: 11.1 | M: 44.1±10.5 | M: 33.3 | ||||||||||
| F: 11.4 | F: 84.4±35.7 | F: 12.7 | F: 46.6±10.8 | F: 29.1 | ||||||||||
| Marjani51 | F: 116.21±39.51 | F: 44±13.39 | F: 29.37 | |||||||||||
| Sharifi52 | M: 24.2 | |||||||||||||
| Ansari53 | M: 28.7 | M: 13.1 | M: 11.3 | |||||||||||
| Hasankhani2 | T: 18.8 | T: 22.8 | T: 26.3 | |||||||||||
| Javadi54 | T: 66.6 | |||||||||||||
| M: 61.3 | ||||||||||||||
| F: 71.6 | ||||||||||||||
T: Total; M: Male; F: Female
Table 2 presents the pooled estimate of the mean of lipid components using a meta-analysis of the data extracted from population-based studies in Iran. From various cities in Iran, 26 studies reported the mean cholesterol level. Based on our meta-analysis, the pooled estimate of the mean cholesterol level in both sexes was 194.89 mg/dl (95% CI: 192.68-197.10).
Table 2.
The pooled estimate of the mean of lipid components based on gender using random effect meta-analysis of data extracted from population-based studies in Iran
| Variable | Number of study | Total | 95% CI | I2 (%) |
|---|---|---|---|---|
| T-C | T: 26 | T: 194.89 | T: 192.68-197.10 | T: 99.4 |
| M: 21 | M: 191. 05 | M: 187.39-194.72 | M: 99.5 | |
| F: 24 | F: 197.49 | F: 193.87-201.11 | F: 99.7 | |
| Mean LDL-C | T: 19 | T: 117.46 | T: 111.94-122.99 | T: 99.7 |
| M: 16 | M: 114.99 | M: 109.40-120.59 | M: 99.3 | |
| F: 19 | F: 120.27 | F: 114.31-126.22 | F: 99.6 | |
| Mean HDL-C | T: 20 | T: 44.22 | T: 42.13-46.32 | T: 99.9 |
| M: 17 | M: 41.87 | M: 39.45-44.29 | M: 99.9 | |
| F: 19 | F: 45.45 | F: 43.24-47.67 | F: 99.9 |
T: Total; M: Male; F: Female
Tables 3- 5 show the pooled estimate of the prevalence of lipid components according to ATPIII cut-off, using a meta-analysis of the extracted data from population-based studies in Iran. The eligible studies for the prevalence estimation of hypercholesterolemia ≥200 mg/dl and ≥240 mg/dl were 31 and 23 articles, respectively. The estimated prevalence of cholesterol ≥200 mg/dl and ≥240 mg/dl in both sexes was 42% (95% CI: 38-45) and 17% (95% CI: 14-20), respectively. The prevalence of cholesterol ≥200 mg/dl is shown in figure 2.
Table 3.
The pooled estimate of the prevalence of lipid components according to ATPIII cut-off, based on gender using random effect meta-analysis of data extracted from population-based studies in Iran (1994-2004)
| Variable | Cut-off point (mg/dl) | Number of studies | Prevalence (%) | 95% CI | I2 (%) |
|---|---|---|---|---|---|
| High cholesterol | ≥200 | T: 17 | T: 43 | T: 38-49 | T: 99.1 |
| M: 12 | M: 45 | M: 38-52 | M: 98.2 | ||
| F: 12 | F: 48 | F: 40-56 | F: 99.0 | ||
| ≥240 | T: 16 | T: 18 | T: 15-22 | T: 99.1 | |
| M: 14 | M: 15 | M: 12-18 | M: 98.0 | ||
| F: 15 | F: 22 | F: 18-26 | F: 98.8 | ||
| High LDL-C | ≥130 | T: 11 | T: 42 | T: 34-50 | T: 99.5 |
| M: 7 | M: 43 | M: 34-53 | M: 98.8 | ||
| F: 7 | F: 52 | F: 41-62 | F: 99.7 | ||
| ≥160 | T: 18 | T: 20 | T: 15-24 | T: 99.4 | |
| M: 13 | M: 20 | M: 15-24 | M: 98.4 | ||
| F: 14 | F: 26 | F: 21-31 | F: 98.8 | ||
| Low HDL-C | T: 8 | T: 40 | T: 29-50 | T: 99.7 | |
| M: ≤ 40 | M: 9 | M: 40 | M: 30-50 | M: 99.4 | |
| F: ≤50 | F: 9 | F: 40 | F: 29-51 | F: 99.6 |
T: Total, M: Male, F: Female
Table 4.
The pooled estimate of the prevalence of lipid components according to ATPIII cut-off, based on gender using random effect meta-analysis of data extracted from population-based studies in Iran (2005-2015)
| Variable | Cut-off point (mg/dl) | Number of studies | Prevalence (%) | 95% CI | I2 (%) |
|---|---|---|---|---|---|
| High cholesterol | ≥200 | T: 16 | T: 39 | T: 35-44 | T: 99.3 |
| M: 9 | M: 31 | M: 15-46 | M: 99.9 | ||
| F: 9 | F: 38 | F: 33-43 | F: 98.8 | ||
| ≥240 | T: 6 | T: 15 | T: 7-22 | T: 99.6 | |
| M: 4 | M: 13 | M: 5-21 | M: 99.4 | ||
| F: 6 | F: 14 | F: 7-22 | F: 99.2 | ||
| High LDL-C | ≥130 | T: 10 | T: 38 | T: 24-52 | T: 99.9 |
| M: 4 | M: 34 | M: 13-56 | M: 98.4 | ||
| F: 5 | F: 37 | F: 14-60 | F: 99.4 | ||
| ≥160 | T: 5 | T: 18 | T: 12-24 | T: 95.1 | |
| M: 4 | M: 18 | M: 13-24 | M: 94.5 | ||
| F: 5 | F: 15 | F: 5-26 | F: 99.2 | ||
| Low HDL-C | T: 9 | T: 45 | T: 34-55 | T: 99.8 | |
| M: ≤ 40 | M: 8 | M: 41 | M: 25-57 | M: 99.8 | |
| F: ≤50 | F: 6 | F: 42 | F: 29-55 | F: 99.7 |
T: Total; M: Male; F: Female
Table 5.
The pooled estimate of the prevalence of lipid components according to ATPIII cut-off, based on gender using random effect meta-analysis of data extracted from population-based studies in Iran (1994-2015)
| Variable | Cut-off point (mg/dl) | Number of studies | Prevalence (%) | 95% CI | I2 (%) |
|---|---|---|---|---|---|
| High cholesterol | ≥200 | T: 31 | T: 42 | T: 38-45 | T: 99.3 |
| M: 26 | M: 39 | M: 30-48 | M: 99.7 | ||
| F: 24 | F: 44 | F: 39-48 | F: 99.1 | ||
| ≥240 | T: 23 | T: 17 | T: 14-20 | T: 99.4 | |
| M: 18 | M: 15 | M: 12-18 | M: 98.9 | ||
| F: 21 | F: 20 | F: 16-24 | F: 99.2 | ||
| High LDL-C | ≥130 | T: 21 | T: 40 | T: 32-48 | T: 99.8 |
| M: 11 | M: 41 | M: 33-48 | M: 98.8 | ||
| F: 11 | F: 46 | F: 38-55 | F: 99.3 | ||
| ≥160 | T: 23 | T: 19 | T: 16-23 | T: 99.3 | |
| M: 17 | M: 19 | M: 16-23 | M: 98.1 | ||
| F: 23 | F: 23 | F: 19-28 | F: 99.0 | ||
| Low HDL-C | T: 17 | T: 42 | T: 35-50 | T: 99.8 | |
| M: ≤ 40 | M: 18 | M: 40 | M: 32-49 | M: 99.7 | |
| F: ≤50 | F: 18 | F: 41 | F: 33-49 | F: 99.6 |
T: Total; M: Male; F: Female
Figure2.

Meta-analysis of the prevalence of hypercholesterolemia (≥200 mg/dl). The square represents the effect of the estimate of individual studies (95 % confidence intervals) with the size of squares proportional to the weight assigned to the study in the meta-analysis. In this chart, studies are stored in order of the publication year and author’s names, based on a random effects model. Rhombic mark shows the prevalence in Iran extracted from all studies.
For the assessment of the mean LDL-C level, 19 articles were analyzed. As shown in table 2, the estimated mean of LDL-C in both sexes was 117.46 mg/dl (95% CI: 111.94-122.99). Furthermore, the prevalence of high LDL-C level was found in 21 (≥130 mg/dl) and 23 (≥160 mg/dl) eligible studies. The pooled estimate of the prevalence of LDL-C ≥130 mg/dl and ≥160 mg/dl in both sexes was 40% (95% CI: 32-48) and 19% (95% CI: 16-23), respectively. The prevalence of LDL-C ≥130 mg/dl is shown in figure 3. As shown in table 2, the pooled estimate of the mean of HDL-C level from the 20 included studies was 44.22 mg/dl (95% CI: 42.13-46.32). From the 17 eligible studies that reported the prevalence of low HDL-C (<40 among males, <50 among females), the estimated prevalence of low HDL-C was 42% (95% CI: 35-530) (table 5). In addition, 19 eligible studies were included in the meta-analysis to assess the prevalence of low HDL-C (<35 mg/dl) for which the prevalence of 28% (95% CI: 19-37) was estimated. The prevalence of low HDL-C (<40 mg/dl) is shown in figure 4.
Figure3.

Meta-analysis of the prevalence of high LDL-C (≥130 mg/dl) in published articles. The midpoint of each line segment represents the estimated prevalence in the study. Rhombic mark shows the prevalence in Iran extracted from all studies.
Figure4.

Meta-analysis of the prevalence of low HDL-C (≤40 mg/dl) in published articles. The midpoint of each line segment represents the estimated prevalence in the study. Rhombic mark shows the prevalence in Iran extracted from all studies.
Mean and Prevalence of Total Cholesterol, LDL-C, and HDL-C Stratified by Gender
The estimated mean and the prevalence of each lipid component, according to sex, are shown in table 2 and table 3 - table 5, respectively. Based on the results, the prevalence of hypercholesterolemia was higher among women. The value for the prevalence of cholesterol ≥200 mg/dl was 39% (95% CI: 30-48) in men and 44% (95% CI: 39-48) in women. The prevalence of cholesterol ≥240 mg/dl was 15% (95% CI: 12-18) in men and 20% (95% CI: 16-24) in women ( table 3). Furthermore, the mean total cholesterol level in men and women was 191.05 mg/dl (95% CI: 187.39-194.72) and 197.49 mg/dl (95% CI: 193.87-201.11), respectively, which was higher in women compared to men (table 2).
The prevalence of high LDL-C and mean LDL-C levels were higher among women. The prevalence of LDL-C (≥130 mg/dl) in men was 41% (95% CI: 33-48) and 46% (95% CI: 38-55) in women. The prevalence of LDL-C (≥160 mg/dl) was 19% (95% CI: 16-23) in men and 23% (95% CI: 19-28) in women (table 3). In addition, the mean LDL-C level in men was 114.99 mg/dl (95% CI: 109.40-120.59) and 120.27 mg/dl (95% CI: 114.31-126.22) in women (table 2).
The mean HDL-C level was higher among women, 41.87 mg/dl (95% CI: 39.45-44.29) in men and 45.45 mg/dl (95% CI: 43.24-47.67) in women. The prevalence of low HDL-C level in women (≤50 mg/dl) was 41% (95% CI: 33-49) and in men (≤40 mg/dl) was 40% (95% CI: 32-49).
Subgroup Analysis for the Year of Publication
The year of publication of each study may also represent a source of heterogeneity. In an attempt to explain heterogeneity within this subgroup, a subgroup analysis was performed. The analysis showed that the prevalence of hypercholesterolemia (≥200 mg/dl and ≥240 mg/dl) was lower (39% and 15%, respectively) in studies published during 2005-2015 than those during 1994-2004 (43% and 18%, respectively). The same trend was obtained for the prevalence of LDL-C (≥130 mg/dl and ≥160 mg/dl), which showed high LDL-C to be less prevalent in studies published during 2005-2015 (38% and 18%, respectively) than those during 1994-2004 (42% and 20%, respectively). However, the reverse was true for the prevalence of low HDL-C, which showed a significantly higher (15.2%) prevalence in studies published during 2005-2015 (45%) than those during 1994-2004 (40%) (table 2).
Discussion
In the present study, we considered the components of lipid in our systematic search. The findings indicated that the prevalence of dyslipidemia with respect to sex differences was considerable in Iran. The overall prevalence of high TC ≥200 mg/dl and TC ≥240 mg/dl levels was 42% (38-45) and 17% (14-20), respectively, among adults aged ≥20 years in Iran. This was according to the population-based studies on both sexes in different cities of Iran. In another meta-analysis in Iran, the prevalence of high TC (≥200 mg/dl) in 14 eligible studies was 41.6% (36.1-47.0), which is similar to our findings.55 Thus, the prevalence of hypercholesterolemia in Iran is expected to be high. However, compared with other studies, the results show that hypercholesterolemia in Iran is lower than the Western European countries. In a systemic review,56 the prevalence of high TC ≥200 mg/dl and TC ≥240 mg/dl was 56.7% and 31.7%, respectively, in adults aged 30-70 in Portugal. According to a report by the American Heart Association in 2013, the prevalence of TC ≥200 mg/dl and TC ≥240 mg/dl was 43.2 % and 28%, respectively, among non-Hispanic white people aged ≥20 years in the United States.57 The prevalence of TC ≥200 mg/dl was 48% in the UK adults aged 19-64 years58 and TC ≥240 mg/dl was 35.2% in some European countries such as England.59 However, the findings of the present study reveal that the prevalence of hypercholesterolemia in Iran is higher compared to other Asian countries. The corresponding figure for TC ≥200 mg/dl was approximately 34.5% in Oman,60 36.9% of Lebanese aged 18-65 years,61 41.6% in Iraq,62 20% in Pakistan,63 37.5% in Turkish people aged ≥20 years,64 17.2% in Nepal,65 23.2% in Eastern India,66 and 15.38% for TC ≥240 mg/dl in individuals aged ≥30 in a Chinese study.67 The present study shows that similar to most other studies, hypercholesterolemia was more prevalent in Iranian women. The results of a study on people aged ≥20 years in the United States were similar to our results and they reported a higher prevalence of hypercholesterolemia in women.68 In this regard, other studies in Pakistan,63 China,67 Arab countries, and others69-71 were also similar to our findings.
In the present study, the reported prevalence of high LDL-C ≥130 mg/dl and ≥160 mg/dl levels in adults of both sexes was 40% (32-48) and 19% (16-23), respectively. In Asia, the prevalence of high LDL-C varies from 24.8% in China,72 32.1% in Lebanon,61 to 44.5% in Turkey,64 46.9% among Indians aged ≥20 years,66 and 57.8% in Iraq.62 The prevalence of high LDL-C in Iran was higher relative to most other western countries. The corresponding figure was 29.7% in adult non-Hispanic white people in the United States57 and 20.8% in Switzerland.73
We found a higher prevalence of hypercholesterolemia and high LDL-C in Iranian women, similar to findings in most other countries. In various studies, TC and LDL-C are similar between men and women in the first two decades of life, but then, the amount of these variables slightly increases in men and has an ascending trend in women. Women aged over 50 years (after menopause) have higher total cholesterol and decreased estrogen plays a role in these changes. Nowadays, estrogen-replacement therapy is recommended to reduce cardiovascular risk after menopause.8,74
The prevalence of low HDL-C level (<40 in males, <50 in females) was 42% (35-50) among adults of both sexes in our study. The reported prevalence of low HDL-C level in the meta-analysis of Tabatabaei et al.55 in Iran (11 eligible studies) was 43.9% (33.4-54.4), which is similar to the findings of the present study. The prevalence of low HDL-C in Asian countries was 67.2% in India,75 56.7% in Nepal,65 54.75% in Taiwan,76 49.9% in Iraq,62 49.3% in Lebanon,61 37.2% in Malaysia,77 21.1% in Turkey,64 33.4% in Korea,78 19.2% in China,72 and 75.4% in Oman.60 The prevalence of low HDL-C was reported as 33.1% and 12.4% in adult American men and women,57 respectively, and 53.4% in Switzerland.73 In the present study, this figure was higher among females than males. Although ethnic diversity, differences in dietary habits, lifestyle of people in different regions, and time of study can lead to various findings, in general, women of all ages have higher HDL-C levels than men and the mean HDL-C level in men is lower than women of all ages.10 Other studies have observed that HDL-C increases with aging in women and the difference in HDL-C levels is greater after the second decade between the two genders.79 Data of Framingham study showed that 0.96 mg/dl decrease in HDL-C level had led to the increased risk of CVD in men and women by 2% and 3%, respectively.80
Sex-related differences in lipid disorders commonly have been observed in western societies, which have high incidences of CVD. However, it has not been seen in communities where the prevalence of CVD is low.81 Such difference is justified in Iran because of the high incidence of CVD.14 One reason for the diversity of findings among different studies might be due to the genetic differences. Other reasons might be insulin resistant, high-fat diet, smoking, and increased BMI.82-85 Age and sex are the two other factors that influence blood lipids.10 There is a positive and strong association between age and increased cholesterol level and CVD.86,87 In recent decades, various changes in lifestyle and rapid socioeconomic changes in many countries have considerably led to increased risk of CVD.4
Conclusion
Many population-based studies have been performed in Iran to determine the prevalence of lipid profile abnormalities. A number of these studies had some heterogeneities in the data. However, the present study indicated that abnormalities in lipid components were considerable in Iran. Moreover, we found that abnormalities in lipid components were more prevalent in Iranian women. Since each plan for the control of these risk factors would have a positive effect on public health, healthcare organizations in Iran should execute well-defined programs to control dyslipidemia in the general population, especially in women. Besides lifestyle and dietary modifications, which have a considerable effect on dyslipidemia, long-term planning to reduce these risk factors must be applied by educating people.
Footnotes
Conflict of Interest: None declared.
References
- 1.Ghatresamani K, Roghani F, Farokhi A. Evaluation of correaltion between plasma homocysteine and oxidized low-density lipoprotein in patients with coronary artery disease . J Birjand Univ Med Sci. 2009;16:47–53. Persian. [Google Scholar]
- 2.Hassankhani H, Zhinalzadeh A, Fakhri M, Asadi P, Almasi A. Shift work and cardiovascular risk factors in the nurses of the emergency and intensive care wards ofeducational hospitals affiliated to Kermanshah University of Medical Sciences in 2012-2013. Journal of Clinical Research in Paramedical Sciences. 2012;1:55–64. Persian. [Google Scholar]
- 3.Nadimi AE, Ahmadi J. Lipid abnormalities in urban population of Rafsanjan (Rafsanjan coronary risk factors study phase 1) J Diabetes Metab Disord. 2004;3:149–54. Persian. [Google Scholar]
- 4.Jamshidi L, Seif L, Moradi M. Prevalence and association between metabolic syndrome and ischemic heart diseases in patients admitted to the hospitals of Hamedan University of Medical Sciences. Medical Science Journal of Islamic Azad University of Mashhad. 2011;7:101–10. Persian. [Google Scholar]
- 5.Mohamadi-Fard N, Sadri G, Sarraf-Zadegan N, Baghaie A, Shahrokhi S, Hoseini S, et al. The prevalence of cardiovascular risk factors in rural and urban population of Isfahan and Markazi Provinces. J Qazvin Univ Med Sci. 2003;7:5–14. Persian. [Google Scholar]
- 6.Aghakhani N, Sharif Nia H, Shamabadi GH, Taghipour B, Nikoonejad AR. Survey of the relationship between cardiovascular risk factors and results of exercise test on patients referring to a hospital in Urmia in 2009. Journal of Community Health. 2014;7:54–61. Persian. [Google Scholar]
- 7.Majdi M, Nickparast N, Bagherzadeh A, Puradine M, SABERY KM, Khani H, et al. The prevalence of hyperlipidemia and some effective factors in teachers of North Khorasan Province. J North Khorasan Uni Med Sci. 2012;4:67–77. Persian. [Google Scholar]
- 8.Karimi F, Rayani M, Akbarzade S, Tahmasebi R, Khakzade M, Arab J. The prevalence of hyperlipidemia in persons over 19 years of Bushehr in 1999. Iran South Med J. 2000;3:98–106. Persian. [Google Scholar]
- 9.Esfahani MA, Jolfaii EG, Torknejad M, Etesampor A, Amiz FR. Postprandial hypertriglyceridemia in non-diabetic patients with coronary artery disease. Indian Heart J. 2004;56:307–9. [PubMed] [Google Scholar]
- 10.Shahebrahimi K, Mirmiran P, Habibi Moieni A, Ghanbili J, Ghanbarian A, Momenan A, et al. Assessment of changes in cardiovascular risk factors in the east Tehran residents. Research in Medicine. 2006;30:267–77. Persian. [Google Scholar]
- 11.Navaei L, Mehrabi Y, Azizi F. Epidemiology of hyperlipidemia, obesity and increased blood pressure in rural areas of Tehran Province. Iran J Endocrinol Metab. 2000;2:253–62. Persian. [Google Scholar]
- 12.Fakhrzadeh H, Nabipour I, Rayani M, Vasiq A. Angina and myocardial infarction in patients with hyperlipidemia in Bushehr: A population based study. Iran J Diabetes Lipid Disord. 2002;2:65–73. Persian. [Google Scholar]
- 13.Saeedi M, Ray A, Rezaei M. Prevalence of hyperlipidemia among adult residents of Kermanshah in 1997 1998. Scientific Journal of Kurdistan University of Medical Sciences. 2003;3:49–54. Persian. [Google Scholar]
- 14.Sarraf-Zadegan N, Sayed-Tabatabaei FA, Bashardoost N, Maleki A, Totonchi M, Habibi HR, et al. The prevalence of coronary artery disease in an urban population in Isfahan, Iran. Acta Cardiol. 1999;54:257–63. [PubMed] [Google Scholar]
- 15.Azizi F, Rahmani M, Ghanbarian A, Emami H, Salehi P, Mirmiran P, et al. Serum lipid levels in an Iranian adults population: Tehran Lipid and Glucose Study. Eur J Epidemiol. 2003;18:311–9. doi: 10.1023/a:1023606524944. [DOI] [PubMed] [Google Scholar]
- 16.Azizi F, Emami H, Salehi P, Ghanbarian A, Mirmiran P, Mirbolooki M. Cardiovascular risk factors in the elderly: Tehran Lipid and Glucose Study (TLGS) Iranian Journal of Endocrinology and Metabolism. 2003;5:3–13. doi: 10.1097/01.hjr.0000050202.47754.1b. Persian. [DOI] [PubMed] [Google Scholar]
- 17.Fakhrzadeh H, Larijani B, Bandarian F, Adibi H, Samavat T, Malek Afzali H, et al. The relationship between ischemic heart disease and coronary risk factors in population aged over 25 in Qazvin: A population-based study. J Qazvin Univ Med Sci. 2005;35:26–34. Persian. [Google Scholar]
- 18.Yousefinia M, Amani A. A Survey of lipid profile in the population over 30 years old based on Arak healthy heart program. Arak Medical University Journal. 2007;10:89–96. Persian. [Google Scholar]
- 19.Kelishadi R, Gharipour M, Sadri GH, Tavasoli AA, Amani A. Cardiovascular disease risk factors, metabolic syndrome and obesity in an Iranian population. East Mediterr Health J. 2008;14:1070–9. [PubMed] [Google Scholar]
- 20.Sadeghi M, Roohafza H, Aghdak P, Kelishadi R, Shirani S. The prevalence of cardiovascular risk factors among women of central parts of Iran: Isfahan Healthy Heart Programme. J Qazvin Univ Med Sci. 2005;9:76–83. Persian. [Google Scholar]
- 21.Hadjzadeh MAR, Neamaty H. The Prevalance of Hypercholesterolemia in Middle-Aged and Elderly Population in Mashhad And its Relation to Hypothyroidism. Medical Journal of Mashhad University of Medical Sciences. 2007;50:161–70. Persian. [Google Scholar]
- 22.Mellati AA, Mousavinasab SN, Sokhanvar S, Kazemi SA, Esmailli MH, Dinmohamadi H. Correlation of anthropometric indices with common cardiovascular risk factors in an urban adult population of Iran: data from Zanjan Healthy Heart Study. Asia Pac J Clin Nutr. 2009;18:217–25. [PubMed] [Google Scholar]
- 23.Sharifi F, Mousavinasab SN, Soruri R, Saeini M, Dinmohammadi M. High prevalence of low high-density lipoprotein cholesterol concentrations and other dyslipidemic phenotypes in an Iranian population. Metab Syndr Relat Disord. 2008;6:187–95. doi: 10.1089/met.2008.0007. [DOI] [PubMed] [Google Scholar]
- 24.Amiri M, Emami SR, Nabipour I, Soltanian A, Sanjideh Z, Koushesh F. Risk factors of cardiovascular diseases in Bushehr Port on the basis of The WHO MONICA Project The Persian Gulf Healthy Heart Project. Iran S Med J. 2004;6:151–61. Persian. [Google Scholar]
- 25.Agheli N, Assef Zadeh S, Rajabi M. The prevalence of cardiovascular risk factors among population aged over 30 years in Rasht and Qazvin. J Qazvin Univ of Med Sci. 2005;35:59–65. Persian. [Google Scholar]
- 26.Seyffarshad M, Kousha A, Pourdowlati S, Karamouz M, Farahbakhsh M, Hakimi S, et al. Cardiac risk factor analysis in East Azerbaijan, Iran. Cardiology. 2007;3:1–4. [Google Scholar]
- 27.Mahmoudi MJ, Saghafi H, Fakhrzadeh H, Heshmat R, Shafaei A, Larijani B. Prevalence of lipid disorders among relatives of patients with premature coronary artery disease. Iranian Journal of Diabetes and Metabolism. 2006;5:271–80. Persian. [Google Scholar]
- 28.Nabipour I, Amiri M, Imami SR, Jahfari SM, Nosrati A, Iranpour D, et al. Unhealthy lifestyles and ischaemic electrocardiographic abnormalities: the Persian Gulf Healthy Heart Study. East Mediterr Health J. 2088;14:858–68. [PubMed] [Google Scholar]
- 29.Namayandeh SM, Sadr S, Ansari Z, Rafiei M. A cross-sectional study of the prevalence of coronary artery disease traditional risk factors in Yazd urban population, Yazd healthy heart project. Iran Cardiovasc Res J. 2011;5:7–13. [Google Scholar]
- 30.Aghasadeghi K, Zarei-Nezhad M, Keshavarzi A, Mehrabani D. The prevalence of coronary risk factors in Iranian lor migrating tribe. Arch Iran Med. 2008;11:322–5. [PubMed] [Google Scholar]
- 31.Chehrei A, Sadrnia S, Keshteli AH, Daneshmand MA, Rezaei J. Correlation of dyslipidemia with waist to height ratio, waist circumference, and body mass index in Iranian adults. Asia Pac J Clin Nutr. 2007;16:248–53. [PubMed] [Google Scholar]
- 32.Malek M, Ghorbani R, Rashidipoor A, Eskandarian R. Prevalence of low HDL-C and high tryglicerid in Semnan province. J Diabetes Metab Disord. 2009;9:75–80. Persian. [Google Scholar]
- 33.Alikhani S, Delavari A, Alaedini F, Kelishadi R, Rohbani S, Safaei A. A province-based surveillance system for the risk factors of non-communicable diseases: A prototype for integration of risk factor surveillance into primary healthcare systems of developing countries. Public Health. 2009;123:358–64. doi: 10.1016/j.puhe.2009.02.011. [ PMC Free Article] [DOI] [PubMed] [Google Scholar]
- 34.Ghiasvand M, Heshmat R, Golpira R, Haghpanah V, Soleimani A, Shoushtarizadeh P, et al. Shift working and risk of lipid disorders: a cross-sectional study. Lipids Health Dis. 2006;5:9. doi: 10.1186/1476-511X-5-9. [ PMC Free Article] [DOI] [PMC free article] [PubMed] [Google Scholar]
- 35.Ghodousi K, Ameli J, Saadat R, Pourfarziani V, Najafipour F, Karami GR, et al. Dyslipidemia and it’s relation with smoking in Tehran. Journal of Gorgan University of Medical Sciences. 2006;8:55–9. Persian. [Google Scholar]
- 36.Veghari G, Joshaghani H, Hoseini S, Sedaghat S, Nik Nezhad F, Angizeh A, et al. The Study of prevalence of Hypercholesterolemia and some relative factors in Golestan province. Journal of Payavard Salamat. 2010;3:10–24. Persian. [Google Scholar]
- 37.Hatmi ZN, Tahvildari S, Gafarzadeh Motlag A, Sabouri Kashani A. Prevalence of coronary artery disease risk factors in Iran: a population based survey. BMC Cardiovasc Disord. 2007;7:32. doi: 10.1186/1471-2261-7-32. [ PMC Free Article] [DOI] [PMC free article] [PubMed] [Google Scholar]
- 38.Asgari F. Iran-non-communicable diseases risk factors surveillance- Data book for 2007. Tehran: Chakameh Ava Group; 2009. pp. 1–82. [Google Scholar]
- 39.Delavari A, Kelishadi R, Forouzanfar MH, Safaei A, Birjandi F, Alikhani S. The first cut-off points for generalized and abdominal obesity in predicting lipid disorders in a nationally representative population in the Middle East: The National Survey of Risk Factors for Non-Communicable Diseases of Iran. Arch Med Sci. 2009;5:542–9. [Google Scholar]
- 40.Azimiyan J, Rajabi M, Javadi M, Javadi A. Prevalence of cardiovascular risk factors among women in Minoodar district of Qazvin; interventional propositions. J Qazvin Univ Med Sci. 2009;13:35–42. Persian. [Google Scholar]
- 41.Azabdaftari N, Amani R, Taha Jalali M. Biochemical and nutritional indices as cardiovascular risk factors among Iranian firefighters. Ann Clin Biochem. 2009;46:385–9. doi: 10.1258/acb.2009.009026. [DOI] [PubMed] [Google Scholar]
- 42.Esteghamati A, Meysamie A, Khalilzadeh O, Rashidi A, Haghazali M, Asgari F, et al. Third national Surveillance of Risk Factors of Non-Communicable Diseases (SuRFNCD-2007) in Iran: methods and results on prevalence of diabetes, hypertension, obesity, central obesity, and dyslipidemia. BMC Public Health. 2009;9:167. doi: 10.1186/1471-2458-9-167. [ PMC Free Article] [DOI] [PMC free article] [PubMed] [Google Scholar]
- 43.Saberi HR, Moravveji AR, Fakharian E, Kashani MM, Dehdashti AR. Prevalence of metabolic syndrome in bus and truck drivers in Kashan, Iran. Diabetol Metab Syndr. 2011;3:8. doi: 10.1186/1758-5996-3-8. [ PMC Free Article] [DOI] [PMC free article] [PubMed] [Google Scholar]
- 44.Bahonar A, Shahnam M, Asadi-Lari M, Bashtam M, Gharipoor M, Taghdisi M, et al. Risk factors of cardiovascular diseases among workers in Isfahan. Iran Occupational Health. 2010;7:14–10. Persian. [Google Scholar]
- 45.Nikparvar M, Boushehri E, Azinfar A, Aboozari R. Assessment of cardiovascular disease risk factors in an Iranian young population. Bimonthly Journal of Hormozgan University of Medical Sciences. 2015;18:441–7. [Google Scholar]
- 46.Delavar MA, Lye MS, Khor GL, Hanachi P, Hassan ST. Prevalence of metabolic syndrome among middle aged women in Babol, Iran. Southeast Asian J Trop Med Public Health. 2009;40:612–28. [PubMed] [Google Scholar]
- 47.Asaei E, Sarshar N, Ghahramani M, Mokhtarian Dalue H. Cardiovascular risk factors in people abovetwenty years old in Gonabad, Iran. Journal of Research and Health. 2013;3:458–65. [Google Scholar]
- 48.Heydari ST, Khoshdel A, Sabayan B, Abtahi F, Zamirian M, Sedaghat S. Prevalence of cardiovascular risk factors among military personnel in Southern Iran. Iran Cardio Res J. 2010;4:22–7. [Google Scholar]
- 49.Hatmi ZN, Mahdavi-Mazdeh M, Hashemi-Nazari SS, Hajighasemi E, Nozari B, Mahdavi A. Trend of lipid ratios associated with well known risk factors of coronary artery disease in different age: a population based study of 31,999 healthy individuals. Int J Cardiol. 2011;151:328–32. doi: 10.1016/j.ijcard.2010.06.007. [DOI] [PubMed] [Google Scholar]
- 50.Saberi A, Hatamian HR, Kazemnejad E, Ghorbannejad N. Hyperlipidemia in migraine: Is it more frequent in migraineurs? Iran J Neurol. 2011;10:46–50. [ PMC Free Article] [PMC free article] [PubMed] [Google Scholar]
- 51.Marjani A, Hezarkhani S, Shahini N. Prevalence of metabolic syndrome among fars ethnic women in North East of Iran. World Journal of Medical Sciences. 2012;7:17–22. [Google Scholar]
- 52.Sharifi F, Anjomshoaa A, Payami M, Heidari some A. Comparison of Cardiovascular and Metabolic Syndrome Risk Factors among War Veterans Suffering from Post Traumatic Stress Disease with Normal Healthy Men in Zanjan. J Zanjan Univ of Med Sci. 2015;23:34–47. Persian. [Google Scholar]
- 53.Ansari R, Khosravi A, Bahonar A, Shirani S, Kelishadi R, Khosravi Z. Risk factors of atherosclerosis in male smokers, passive smokers, and hypertensive nonsmokers in central Iran. ARYA Atheroscler. 2012;8:90–5. [ PMC Free Article] [PMC free article] [PubMed] [Google Scholar]
- 54.Javadi H, Hashemipour S, Abbasi M, Javadi A. Prevalence of metabolic syndrome and its components in over 24 years old population of Qazvin (2012) J Qazvin Univ of Med Sci. 2014;18:7–11. Persian. [Google Scholar]
- 55.Tabatabaei-Malazy O, Qorbani M, Samavat T, Sharifi F, Larijani B, Fakhrzadeh H. Prevalence of dyslipidemia in iran: a systematic review and meta-analysis study. Int J Prev Med. 2014;5:373–93. [ PMC Free Article] [PMC free article] [PubMed] [Google Scholar]
- 56.Costa J, Borges M, Oliveira E, Gouveia M, Carneiro AV. Incidence and prevalence of hypercholesterolemia in Portugal: a systematic review. Part III. Rev Port Cardiol. 2003;22:829–36. [PubMed] [Google Scholar]
- 57.Go AS, Mozaffarian D, Roger VL, Benjamin EJ, Berry JD, Borden WB, et al. Heart disease and stroke statistics--2013 update: a report from the American Heart Association. Circulation. 2013;127:e6–e245. doi: 10.1161/CIR.0b013e31828124ad. [ PMC Free Article] [DOI] [PMC free article] [PubMed] [Google Scholar]
- 58.Henderson L, Irving K, Gregory J, Bates C, Prentice A, Perks J, et al. The National Diet and Nutrition Survey: adults aged 19 to 64 years. Energy, Protein, Carbohydrate, Fat and Alcohol Intake. 2004;2 [Google Scholar]
- 59.Roth GA, Fihn SD, Mokdad AH, Aekplakorn W, Hasegawa T, Lim SS. High total serum cholesterol, medication coverage and therapeutic control: an analysis of national health examination survey data from eight countries. Bull World Health Organ. 2011;89:92–101. doi: 10.2471/BLT.10.079947. [ PMC Free Article] [DOI] [PMC free article] [PubMed] [Google Scholar]
- 60.Al-Lawati JA, Jousilahti P. Body mass index, waist circumference and waist-to-hip ratio cut-off points for categorisation of obesity among Omani Arabs. Public Health Nutr. 2008;11:102–8. doi: 10.1017/S1368980007000183. [DOI] [PubMed] [Google Scholar]
- 61.Sibai AM, Obeid O, Batal M, Adra N, El Khoury D, Hwalla N. Prevalence and correlates of metabolic syndrome in an adult Lebanese population. CVD Prev Control. 2008;3:83–90. [Google Scholar]
- 62.Mula-Abed WA, Chilmeran SK. Prevalence of dyslipidemia in the Iraqi adult population. Saudi Med J. 2007;28:1868–74. [PubMed] [Google Scholar]
- 63.Dennis B, Aziz K, She L, Faruqui AM, Davis CE, Manolio TA, et al. High rates of obesity and cardiovascular disease risk factors in lower middle class community in Pakistan: the Metroville Health Study. J Pak Med Assoc. 2006;56:267–72. [PubMed] [Google Scholar]
- 64.Erem C, Hacihasanoglu A, Deger O, Kocak M, Topbas M. Prevalence of dyslipidemia and associated risk factors among Turkish adults: Trabzon lipid study. Endocrine. 2008;34:36–51. doi: 10.1007/s12020-008-9100-z. [DOI] [PubMed] [Google Scholar]
- 65.Sharma SK, Ghimire A, Radhakrishnan J, Thapa L, Shrestha NR, Paudel N, et al. Prevalence of hypertension, obesity, diabetes, and metabolic syndrome in Nepal. Int J Hypertens. 2011;2011:821971. doi: 10.4061/2011/821971. [ PMC Free Article] [DOI] [PMC free article] [PubMed] [Google Scholar]
- 66.Prasad D, Kabir Z, Dash A, Das B. Coronary risk factors in South Asians: A prevalence study in an urban populace of Eastern India. CVD Prev Control. 2010;5:125–32. [Google Scholar]
- 67.Yao XG, Frommlet F, Zhou L, Zu F, Wang HM, Yan ZT, et al. The prevalence of hypertension, obesity and dyslipidemia in individuals of over 30 years of age belonging to minorities from the pasture area of Xinjiang. BMC Public Health. 2010;10:91. doi: 10.1186/1471-2458-10-91. [ PMC Free Article] [DOI] [PMC free article] [PubMed] [Google Scholar]
- 68.Rosamond W, Flegal K, Furie K, Go A, Greenlund K, Haase N, et al. Heart disease and stroke statistics--2008 update: a report from the American Heart Association Statistics Committee and Stroke Statistics Subcommittee. Circulation. 2008;117:e25–146. doi: 10.1161/CIRCULATIONAHA.107.187998. [DOI] [PubMed] [Google Scholar]
- 69.Gast GC, Grobbee DE, Pop VJ, Keyzer JJ, Wijnands-van Gent CJ, Samsioe GN, et al. Menopausal complaints are associated with cardiovascular risk factors. Hypertension. 2008;51:1492–8. doi: 10.1161/HYPERTENSIONAHA.107.106526. [DOI] [PubMed] [Google Scholar]
- 70.Skoumas J, Pitsavos C, Panagiotakos DB, Chrysohoou C, Zeimbekis A, Papaioannou I, et al. Physical activity, high density lipoprotein cholesterol and other lipids levels, in men and women from the ATTICA study. Lipids Health Dis. 2003;2:3. doi: 10.1186/1476-511X-2-3. [ PMC Free Article] [DOI] [PMC free article] [PubMed] [Google Scholar]
- 71.Al-Nuaim AR. Serum total and fractionated cholesterol distribution and prevalence of hypercholesterolemia in urban and rural communities in Saudi Arabia. Int J Cardiol. 1997;58:141–9. doi: 10.1016/s0167-5273(96)02850-1. [DOI] [PubMed] [Google Scholar]
- 72.He J, Gu D, Reynolds K, Wu X, Muntner P, Zhao J, et al. Serum total and lipoprotein cholesterol levels and awareness, treatment, and control of hypercholesterolemia in China. Circulation. 2004;110:405–11. doi: 10.1161/01.CIR.0000136583.52681.0D. [DOI] [PubMed] [Google Scholar]
- 73.Firmann M, Mayor V, Vidal PM, Bochud M, Pecoud A, Hayoz D, et al. The CoLaus study: a population-based study to investigate the epidemiology and genetic determinants of cardiovascular risk factors and metabolic syndrome. BMC Cardiovasc Disord. 2008;8:6. doi: 10.1186/1471-2261-8-6. [ PMC Free Article] [DOI] [PMC free article] [PubMed] [Google Scholar]
- 74.Aguilar-Salinas CA, Olaiz G, Valles V, Torres JM, Gomez Perez FJ, Rull JA, et al. High prevalence of low HDL cholesterol concentrations and mixed hyperlipidemia in a Mexican nationwide survey. J Lipid Res. 2001;42:1298–307. [PubMed] [Google Scholar]
- 75.Prabhakaran D, Shah P, Chaturvedi V, Ramakrishnan L, Manhapra A, Reddy KS. Cardiovascular risk factor prevalence among men in a large industry of northern India. Natl Med J India. 2005;18:59–65. [PubMed] [Google Scholar]
- 76.Lin CC, Liu CS, Lai MM, Li CI, Chen CC, Chang PC, et al. Metabolic syndrome in a Taiwanese metropolitan adult population. BMC Public Health. 2007;7:239. doi: 10.1186/1471-2458-7-239. [ PMC Free Article] [DOI] [PMC free article] [PubMed] [Google Scholar]
- 77.Rampal S, Mahadeva S, Guallar E, Bulgiba A, Mohamed R, Rahmat R, et al. Ethnic differences in the prevalence of metabolic syndrome: results from a multi-ethnic population-based survey in Malaysia. PLoS One. 2012;7:e46365. doi: 10.1371/journal.pone.0046365. [ PMC Free Article] [DOI] [PMC free article] [PubMed] [Google Scholar]
- 78.Lee MH, Kim HC, Ahn SV, Hur NW, Choi DP, Park CG, et al. Prevalence of Dyslipidemia among Korean Adults: Korea National Health and Nutrition Survey 1998-2005. Diabetes Metab J. 2012;36:43–55. doi: 10.4093/dmj.2012.36.1.43. [ PMC Free Article] [DOI] [PMC free article] [PubMed] [Google Scholar]
- 79.Evans RW. Coronary heart disease, lipid metabolism, and steroid hormones in women. Women and Health. 2000:844–6. [Google Scholar]
- 80.Gordon T, Castelli WP, Hjortland MC, Kannel WB, Dawber TR. High density lipoprotein as a protective factor against coronary heart disease. The Framingham Study. 1977;62:707–14. doi: 10.1016/0002-9343(77)90874-9. [DOI] [PubMed] [Google Scholar]
- 81.Seidell JC, Cigolini M, Charzewska J, Ellsinger BM, Bjorntorp P, Hautvast JG, et al. Fat distribution and gender differences in serum lipids in men and women from four European communities. Atherosclerosis. 1991;87:203–10. doi: 10.1016/0021-9150(91)90022-u. [DOI] [PubMed] [Google Scholar]
- 82.Saku K, Zhang B, Shirai K, Jimi S, Yoshinaga K, Arakawa K. Hyperinsulinemic hypoalphalipoproteinemia as a new indicator for coronary heart disease. J Am Coll Cardiol. 1999;34:1443–51. doi: 10.1016/s0735-1097(99)00372-1. [DOI] [PubMed] [Google Scholar]
- 83.Brinton EA, Eisenberg S, Breslow JL. A low-fat diet decreases high density lipoprotein (HDL) cholesterol levels by decreasing HDL apolipoprotein transport rates. J Clin Invest. 1990;85:144–51. doi: 10.1172/JCI114405. [ PMC Free Article] [DOI] [PMC free article] [PubMed] [Google Scholar]
- 84.Heimburger DC. Nutritions interact with health and disease. In: Goldman L, Bennett JC. Cecil textbook of medicine. 21st ed. Philadelphia: W. B. Saunders Company; 2000. pp. 1097–8. [Google Scholar]
- 85.Sunyer FX, Obesity Goldman L, Bennett JC. Cecil textbook of medicine. 21st ed. Philadelphia: W. B. Saunders Company; 2000. pp. 1155–62. [Google Scholar]
- 86.Kende M. Superiority of traditional village diet and lifestyle in minimizing cardiovascular disease risk in Papua New Guineans. P N G Med J. 2001;44:135–50. [PubMed] [Google Scholar]
- 87.Oppert JM, Thomas F, Charles MA, Benetos A, Basdevant A, Simon C. Superiority of traditional village diet and lifestyle in minimizing cardiovascular disease risk in Papua New Guineans. P N G Med J. 2006;9:135–50. [PubMed] [Google Scholar]