

Abstract
The NAD +‐dependent deacetylase SIRT1 can be oncogenic or tumor suppressive depending on the tissue. Little is known about the role of SIRT1 in non‐small cell lung carcinoma (NSCLC), one of the deadliest cancers, that is frequently associated with mutated K‐RAS. Therefore, we investigated the effect of SIRT1 on K‐RAS‐driven lung carcinogenesis. We report that SIRT1 protein levels are downregulated by oncogenic K‐RAS in a MEK and PI3K‐dependent manner in mouse embryo fibroblasts (MEFs), and in human lung adenocarcinoma cell lines. Furthermore, Sirt1 overexpression in mice delays the appearance of K‐RasG12V‐driven lung adenocarcinomas, reducing the number and size of carcinomas at the time of death and extending survival. Consistently, lower levels of SIRT1 are associated with worse prognosis in human NSCLCs. Mechanistically, analysis of mouse Sirt1‐Tg pneumocytes, isolated shortly after K‐RasG12V activation, reveals that Sirt1 overexpression alters pathways involved in tumor development: proliferation, apoptosis, or extracellular matrix organization. Our work demonstrates a tumor suppressive role of SIRT1 in the development of K‐RAS‐driven lung adenocarcinomas in mice and humans, suggesting that the SIRT1–K‐RAS axis could be a therapeutic target for NSCLCs.
Keywords: K‐RAS, non‐small cell lung carcinoma, SIRT1
Subject Categories: Cancer, Signal Transduction
Introduction
Lung cancer is the most common cause of cancer death worldwide, being the most frequent cancer in men and the fourth most frequent in women 1. Non‐small cell lung carcinomas (NSCLCs) constitute more than 80% of all lung cancers. In turn, NSCLCs can be subdivided into adenocarcinomas (about 40% of all lung cancers), squamous cell carcinomas (around 35% of all lung cancers); large cell carcinomas (around 10% of lung cancers), and some other, much rarer subtypes.
The most frequent driver mutations for NSCLCs are activating mutations in EGFR (around 25% overall incidence), activating mutations in K‐RAS (8–24%, depending on the study), EML4‐ALK rearrangements (1.6–11.6%), and MET overexpression or activating mutations (4–61%) 2. Importantly, K‐RAS mutations are associated with a poorer prognosis compared to other mutations, such as EGFR 3. Also, it has been suggested that K‐RAS mutations could constitute a mechanism of resistance to chemotherapy strategies based on EGFR inhibitors 4. All this has prompted intense efforts to identify targets that K‐RAS cancers depend on for survival 5.
Sirtuins are a family of protein deacylases and mono‐ADP‐ribosyltransferases that are activated by NAD+ in its oxidized form and thus active in cellular scenarios of low energy. Their role in tumor progression is complex. Some sirtuins (SIRT2, 3, 4, and 6) protect against tumor development 6, 7, 8, 9, whereas other sirtuins (SIRT5 10 and SIRT7 11, 12) display oncogenic features. The case of SIRT1 is particularly intricate. On one hand, SIRT1 has been reported to play tumor suppressive roles: It has been found decreased in human breast, liver, and colon tumors 13, 14; increased SIRT1 expression has been correlated with favorable outcome in human head and neck squamous cell carcinomas and ovarian tumors 15, 16; haploinsufficiency of Sirt1 has been described to accelerate tumor development in a p53‐heterozygous background 13, and its overexpression has been shown to block the growth of different types of tumors in cell culture experiments 17, 18 and in mouse models 13, 19, 20, 21. In contrast, SIRT1 can also act as an oncogene: SIRT1 levels have been found increased in several human tumors like breast 22, prostate 23, liver 24, leukemias 25, 26, or NSCLCs 27, 28, 29, 30, 31, 32; overexpression of Sirt1 promoted thyroid tumor formation in mice 33; and SIRT1 downregulation decreased intestinal tumor formation 34.
The functional interaction between SIRT1 and K‐RAS remains poorly understood. SIRT1 has been found to bind to the promoters of RAS proteins 20, 35, and also to directly bind and deacetylate K‐RAS at lysine 104, facilitating K‐RAS activation 36. However, the relevance and mechanisms of these interactions have not yet been fully elucidated.
In this work, we genetically studied the functional interaction between SIRT1 and K‐RAS. We found that mouse Sirt1 acts as a tumor suppressor in the context of K‐RasG12V‐induced mouse lung adenocarcinomas and confirmed these findings in human lung tumors. Moreover, we obtained a list of tumorigenic pathways altered in Sirt1‐overexpressing and K‐RasG12V‐expressing pneumocytes, explaining the tumor suppressive functions of SIRT1 in NSCLCs and highlighting the role of the SIRT1–K‐RAS axis as a novel therapeutic target for NSCLCs.
Results and Discussion
K‐Ras participates in the decrease of Sirt1 protein levels in culture
We have first observed that primary mouse embryo fibroblasts (MEFs) gradually reduce Sirt1 protein levels as time in culture advances (Fig 1A). This was evident for WT MEFs and for MEFs obtained from Sirt1‐Tg mice, expressing an extra copy of the entire Sirt1 gene, along with all of its regulatory sequences 37. Sirt1 mRNA levels decreased more pronouncedly in Sirt1‐Tg MEFs and remained mostly constant in WT MEFs (Fig EV1A). However, when immortalized MEFs from both genotypes were kept in culture for several days, no changes in Sirt1 protein levels were observed (Fig EV1B), indicating that Sirt1 decrease only takes place when the cellular response to culture stress is intact (as in primary MEFs), but not when this response is lost (as in immortalized MEFs).
Figure 1. Sirt1 expression in MEFs decreases with time of culture in a K‐Ras‐enhanced manner.
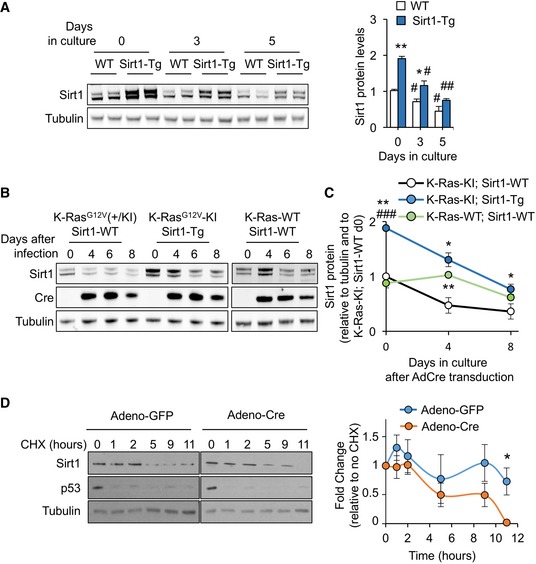
- Western blot against the indicated proteins on samples from WT or Sirt1‐Tg MEFs at 0, 3, and 5 days of culture with 10% FBS. A quantification of the blots (n = 2) is presented in the right panel. Statistical significance of the comparisons between WT and Sirt1‐Tg are represented with *. Statistical significance of the comparisons between the same genotype at day 0 and subsequent days of culture are represented with #.
- Western blot of the indicated proteins at the indicated times after adeno‐Cre infection.
- Quantification of the protein levels of Sirt1 after adeno‐Cre infection. Dots represent the average of at least two independent blots. Statistical significance of the comparisons with K‐Ras‐KI; Sirt1‐WT is represented with *. Statistical significance of the comparisons with K‐Ras‐WT; Sirt1‐WT is represented with #.
- K‐Ras‐KI MEFs infected with the indicated adenoviruses were treated with cycloheximide (CHX) for the indicated times, and the indicated proteins were detected by Western blot. Left panel shows a representative example of n = 5 (GFP) or n = 4 (Cre) different individual clones. Right panel shows the average quantification of Sirt1 protein levels in the four clones.
Figure EV1. K‐Ras activation in Sirt1‐WT and Sirt1‐Tg MEFs.

- mRNA expression of Sirt1 from WT or Sirt1‐Tg MEFs cultured in 10% FBS for the indicated times. Bars represent the average of at least three independent clones.
- Sirt1 protein expression in four different clones of immortalized MEFs, after culturing them during the indicated time. Quantification of the band intensity is shown in the right panel.
- X‐Gal staining of MEFs of the indicated genotypes infected with adeno‐Cre (AdCre) at the indicated times after infection, to detect the LacZ reporter placed in the same polycistronic mRNA with the oncogene K‐RasG12V.
- Growth curve with MEFs of the indicated genotypes after Adeno‐Cre infection.
- mRNA expression of Sirt1 from three independent replicates of K‐Ras‐KI; Sirt1‐WT or K‐Ras‐KI; Sirt1‐Tg MEFs 4 days after infection with the indicated adenoviruses.
Next, we investigated what was the mechanism mediating the decrease in Sirt1 levels in primary MEFs. Growth medium for MEFs contains 10% fetal bovine serum (FBS), very rich in growth factors that activate a plethora of mitogenic pathways. One of the main transducers of mitogenic signals is the small GTPase family of Ras proteins, composed by three members in mammals: K‐Ras, N‐Ras, and H‐Ras 38. As K‐Ras is the member of the Ras family most frequently mutated in human cancer 39, 40, we decided to test whether K‐Ras could be responsible for the downregulation of Sirt1 during chronic mitogenic stimulation. To address this, we crossed Sirt1‐Tg mice with mice expressing a Cre‐inducible oncogenic K‐RasG12V mutant 41 (which from now on we will refer to as K‐Ras‐KI) and obtained MEFs from these mice. We overexpressed Cre by adenoviral transduction and monitored the activation of the K‐RasG12V oncogene measuring the β‐galactosidase surrogate reporter activity over time (Fig EV1C). K‐Ras‐KI; Sirt1‐Tg MEFs proliferated at the same rate as K‐Ras‐KI; Sirt1‐WT MEFs (Fig EV1D). Importantly, MEFs overexpressing the K‐Ras‐KI oncogene showed a more intense reduction in Sirt1 protein levels than K‐Ras‐WT‐expressing MEFs (Fig 1B and C).
To explore the mechanisms responsible for this accelerated reduction in Sirt1 protein levels, we studied the stability of Sirt1 protein by treating cells with the inhibitor of protein synthesis cycloheximide (CHX) for several hours. As indicated in Fig 1D, K‐Ras‐KI MEFs infected with Adeno‐Cre underwent a significant decrease in their Sirt1 levels that became significant after 11 h of CHX treatment when compared with K‐Ras‐KI MEFs infected with Adeno‐GFP as control. Interestingly, we observed a similar reduction in Sirt1 mRNA only in Sirt1‐Tg MEFs, and not in Sirt1‐WT MEFs (Fig EV1E), as shown previously for primary MEFs (Fig EV1A). In all, these results indicate that K‐Ras is at least partly responsible for the progressive decrease of Sirt1 in cultured MEFs. In addition, this reduction is due to decreased Sirt1 protein stability and, only in the case of Sirt1‐Tg MEFs, to decreased Sirt1 mRNA levels.
MAPK and PI3K pathways are involved in Sirt1 protein downregulation in MEFs and human lung tumor cell lines
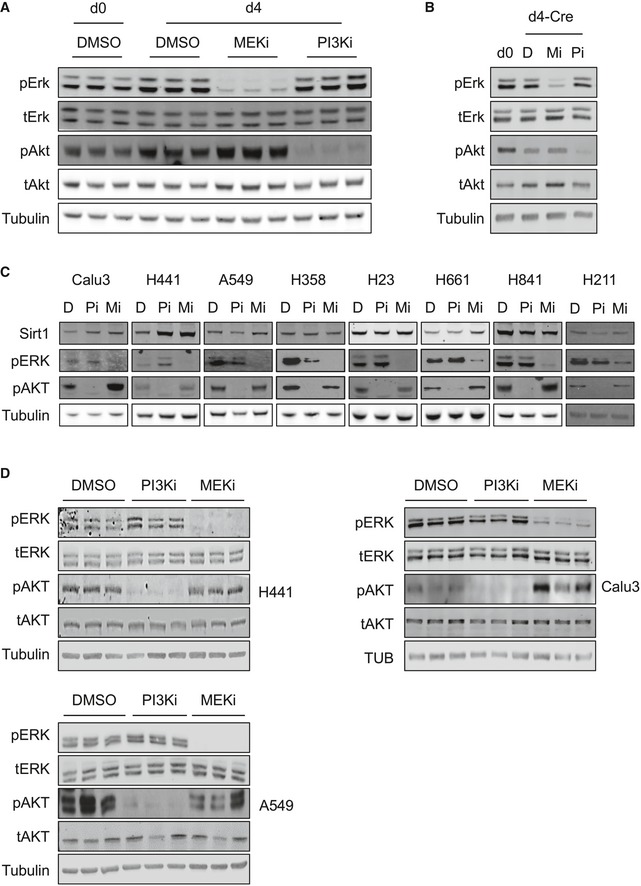
We next investigated the signaling pathways by which K‐Ras reduces Sirt1 protein stability. K‐Ras activates a wide range of signaling pathways, being the RAF‐MEK‐ERK pathway of MAPK and the PI3K pathway the two best characterized 38. We therefore tested whether these K‐Ras‐activated pathways were involved in Sirt1 protein regulation by K‐Ras. To do this, we cultured WT MEFs for 4 days to induce Sirt1 protein decrease and then treated them with either the MEK inhibitor PD0325901 (MEKi) or the PI3K inhibitor CNIO‐PI3Ki 42 (PI3Ki) for 16 h. As expected, culture for 4 days decreased Sirt1 protein levels (Fig 2A). Importantly, when MEFs were treated with MEKi, Sirt1 protein levels were restored to control levels, while treatment with PI3Ki did not alter Sirt1 protein levels (Figs 2A and EV2A). Interestingly, Sirt1 protein stability was reduced with 4 days of culture, and MEK inhibition rescued this effect (Fig 2B and C). To confirm the role of K‐Ras activity in Sirt1 protein destabilization, we infected K‐Ras‐KI MEFs with Adeno‐Cre, and 4 days later, we treated these cells with MEKi or PI3Ki. As shown in Fig 2D, Sirt1 protein levels decreased significantly when K‐Ras‐KI was activated by Adeno‐Cre infection, and this reduction was restored in the presence of MEKi (Figs 2D and EV2B). These data indicate that the RAF‐MEK‐ERK MAPK pathway, and not the PI3K pathway, is partly responsible for the cell culture‐ and K‐Ras‐KI‐induced Sirt1 destabilization in primary MEFs.
Figure 2. PI3K and MEK pathways, targets of K‐Ras, participate in the downregulation of Sirt1 expression.
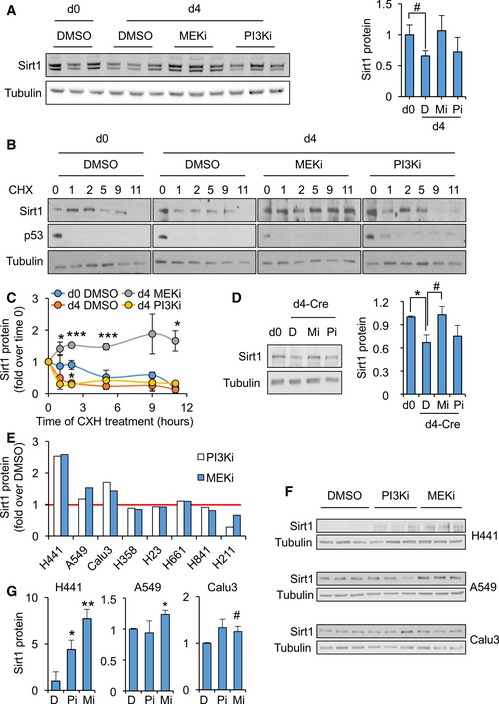
- Left panel: Western blots of the indicated proteins in WT MEFs treated for 16 h with vehicle (DMSO) or the indicated inhibitors. Right panel: quantification of the indicated blots shown in left panel (n = 3).
- Representative Western blots of the indicated proteins in WT MEFs at day 0 or day 4 of culture, treated with vehicle (DMSO) or the indicated inhibitors for 16 h and with cycloheximide for the indicated times.
- Quantification of Sirt1 protein levels from n = 3 (DMSO d0, DMSO d4 and MEKi d4) or n = 2 (PI3Ki d4) independent replicates.
- K‐Ras‐KI MEFs were infected with Adeno‐Cre and treated with MEK inhibitors (Mi) or with PI3K inhibitors (Pi) for 16 h, and the indicated proteins were detected by WB (left panels). Right panel shows a quantification of four independent replicates.
- Levels of Sirt1 after treatment with the indicated inhibitors for 16 h, relative to the control treatment with DMSO, in the indicated cell lines.
- Western blot of the indicated proteins from the cell lines where SIRT1 protein levels were shown to respond to MEK and/or PI3K inhibition in (E).
- Quantification of the three replicates in the Western blots shown in (F).
Figure EV2. Regulation of Sirt1 expression by K‐Ras in MEFs and in human lung tumor cell lines.
- Western blots of the indicated proteins in WT MEFs treated for 16 h with vehicle (DMSO) or the indicated inhibitors.
- K‐Ras‐KI MEFs were infected with Adeno‐Cre and treated with DMSO (D), MEK inhibitors (Mi) or PI3K inhibitors (Pi) for 16 h, and the indicated proteins were detected by WB.
- Western bots of the indicated proteins from the indicated cell lines, treated with vehicle (DMSO, D), MEK inhibitor (Mi), or PI3K inhibitor (Pi) for 16 h.
- Western blots of the indicated proteins from the cell lines where SIRT1 protein levels were shown to respond to MEK and/or PI3K inhibition in Fig 2E.
Source data are available online for this figure.
K‐RAS oncogenic activation is a hallmark mutation in human lung tumors 38. We decided to test whether inhibition of the K‐RAS‐targeted pathways MAPK or PI3K in human lung carcinoma cell lines would restore SIRT1 protein levels, expanding our results from primary, non‐transformed MEFs to cancer cell lines. Interestingly, inhibition of MEK or PI3K resulted in the upregulation of SIRT1 protein levels in three out of seven lung tumor cell lines (H441, A549 and Calu3, Figs 2E and EV2C), and we validated this decrease in the positive cell lines (Figs 2F and G, and EV2D). As shown in Table EV1, SIRT1 levels respond to MEK and/or PI3K inhibition only in lung adenocarcinoma cell lines (Calu3, A549, H441), and not in lines from large cell carcinoma (H661) and small cell carcinoma (H841 and H211). This finding suggests that this response in SIRT1 levels could be specific to adenocarcinomas. Next, we verified K‐RAS mutation status in all checked cell lines and, interestingly, the two lung adenocarcinoma cell lines that did not increase their SIRT1 levels after MEK or PI3K inhibition (H358 and H23) harbored the same K‐RAS mutation (G12C), indicating some specific properties of this mutation.
Previous reports have shown that SIRT1 binds and deacetylates K‐RAS at lysine 104, promoting K‐RAS activation 36. Importantly, in this report SIRT1 overexpression led to a proliferation arrest in human NSCLC cell lines and decreased tumor growth in a xenograft model, which fits with our observations. We could not detect any proliferation arrest in Sirt1‐Tg MEFs (Fig EV1D); however, we observed a progressive loss of Sirt1 protein in cultured normal MEFs, and in MEFs with constitutively active K‐Ras (Fig 1). Interestingly, this reduction in Sirt1 protein was accompanied by a decrease in Sirt1 mRNA only in Sirt1‐Tg MEFs, indicating a stronger pressure by K‐Ras‐activation toward Sirt1 decrease specifically on Sirt1‐overexpressing MEFs. Sirt1 mRNA levels rebound slightly after 7 days in culture (Fig EV1A), which could indicate a compensatory mechanism for the decreased Sirt1 protein levels and stability. These findings suggest that K‐Ras overcomes the described Sirt1‐induced proliferative arrest by decreasing Sirt1 expression through two mechanisms: first, K‐Ras induces a decreased Sirt1 transcription in the cells with high expression of Sirt1 (Sirt1‐Tg, Fig EV1A and E). Second, irrespective of Sirt1 protein levels, K‐Ras induces a decrease in Sirt1 protein stability via MAPKs in MEFs, or via both MAPKs and PI3K in different human lung cancer cell lines (Fig 2), which is consistent with Cheng's data and further expands our basic understanding of the Sirt1–K‐Ras interaction.
Increased Sirt1 levels protect from K‐Ras‐KI‐mediated lung tumors in mice
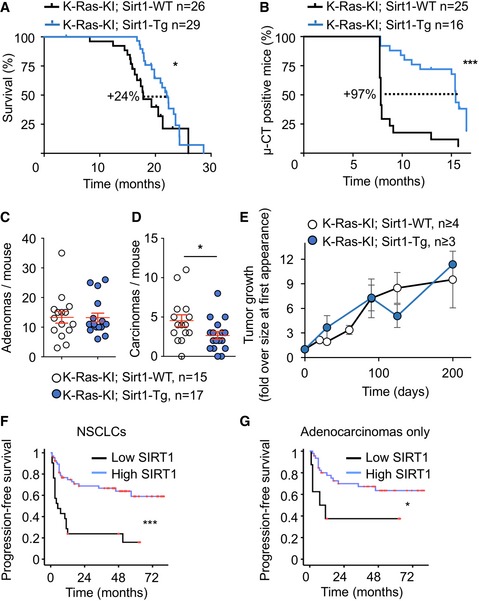
Our above findings indicate that K‐RAS and K‐RAS‐activated pathways downregulate SIRT1 protein levels in primary MEFs and in several human lung carcinoma cell lines. We then tested in vivo whether this functional interaction could have any pathological implication for lung carcinogenesis, where K‐RAS is mutated in a high percentage of cases 2, 38. To do so, we injected tamoxifen to K‐Ras‐KI; Sirt1‐Tg mice. As reported 41, 43, 44, tamoxifen injection to these mice specifically induced lung adenocarcinomas with high efficiency and reproducibility. Importantly, K‐Ras‐KI; Sirt1‐Tg mice lived significantly longer than their K‐Ras‐KI; Sirt1‐WT littermates (24% increase in median lifespan, Fig 3A). We followed tumor appearance by performing periodic μ‐CT scans and recording the time of first tumor appearance. We could observe a drastic delay in the time of appearance of the first tumors in K‐Ras‐KI; Sirt1‐Tg mice, compared with their K‐Ras‐KI; Sirt1‐WT littermates (97% delay in median latency, Fig 3B). We also scored the number and grade of the lung tumors at the time of death. The number of adenomas was not affected by the Sirt1 status (Fig 3C). However, K‐Ras‐KI; Sirt1‐Tg mice presented a lower number of carcinomas (Fig 3D) and in the maximum carcinoma diameter (Fig EV3A), compared with their K‐Ras‐KI; Sirt1‐WT littermates, indicating that increased Sirt1 levels protected from the progression of adenomas into more malignant carcinomas. To further explore the mechanism of Sirt1‐mediated protection, we tracked tumor sizes with time by periodical μ‐CT scans once the tumor appeared, to measure tumor growth. As shown in Fig 3E, Sirt1 levels did not affect tumor growth once the tumors had appeared. This finding allows us to postulate that the observed effects of Sirt1 overexpression on overall survival (Fig 3A), tumor‐free survival (Fig 3B), and incidence of carcinoma (Figs 3B and C, and EV3A) can be mostly ascribed to a delay in the appearance of the tumors and that Sirt1 is protecting against K‐RasG12V activation at the early phases of tumor promotion, but this protection is not so effective once the tumors arise.
Figure 3. Increased Sirt1 expression protects from non‐small cell lung carcinoma in mice and humans.
-
AKaplan–Meier survival curve of mice of the indicated genotypes injected with 4‐OH tamoxifen at 2‐3 months of age.
-
BKaplan–Meier survival curve of mice from (A) censoring for tumor appearance by μCT scanner.
-
C, DQuantification of the number of adenomas (C) and carcinomas (D) per mouse at the time of death by histopathological analysis.
-
EFollow‐up of tumor sizes by periodical μCT scanner, starting from the time point when the tumor was first detected.
-
F, G(F) Kaplan–Meier curve indicating that lung tumors (including all tumors in the TMA, n = 105) displaying high expression of cytoplasmic SIRT1 (at least 20% of their neoplastic cells positive for SIRT1) show longer progression‐free survival time (***P < 0.0005). (G) Kaplan–Meier curve indicating that lung tumors (including only the adenocarcinomas from the TMA, n = 69) displaying high expression of cytoplasmic SIRT1 show longer progression‐free survival time (*P = 0.029).
Figure EV3. Sirt1 effects in mouse and human lung carcinoma.

- Quantification of the maximum carcinoma diameter per mouse at the time of death by histopathological analysis. Red lines represent the means and the standard errors of the mean.
- Kaplan–Meier curve with 105 human lung tumor patients indicating that high expression of cytoplasmic SIRT1 is associated with longer overall survival (**P = 0.003).
In an effort to extend these findings to human lung cancer, we examined the levels of SIRT1 in a series of NSCLCs (n = 105; 69/105 adenocarcinomas, 25/105 squamous cell carcinomas). We observed that tumors with high levels of SIRT1 were associated with a longer progression‐free survival (log‐rank, P = 0.001, Fig 3F) and a longer overall survival (log‐rank, P = 0.003, Fig EV3B). When considering only adenocarcinomas, progression‐free survival was still significantly better in patients with high SIRT1 expression (Fig 3G). These observations support the relevance of high SIRT1 expression in human NSCLCs as an indicator of favorable clinical outcome. Importantly, other reports have previously reported increased expression of SIRT1 in human NSCLC tumors with worse prognosis. Many of these studies focused on squamous cell carcinomas 29, 31, 32, while 67% of the NSCLCs analyzed in our TMA (Fig 3F) were adenocarcinomas. This difference in the analyzed tumor subtypes could explain the divergences between our data in humans and those reported before. There are other reports showing that higher SIRT1 expression is associated with bad prognosis specifically in lung adenocarcinomas 28, 30, 45. This discrepancy can be explained by different patient populations, different set of driver mutations present in the tumors, or other technical differences. Notably, Sirt1 has already been reported to play contrasting roles in different subtypes of other tumor type, AML, acting as a tumor suppressor in MLL‐rearranged AMLs 46 but as a tumor promoter in FLT3‐ITD AMLs 25.
Sirt1‐Tg pneumocytes display an anti‐tumorigenic profile during the early phases of K‐RasG12V activation
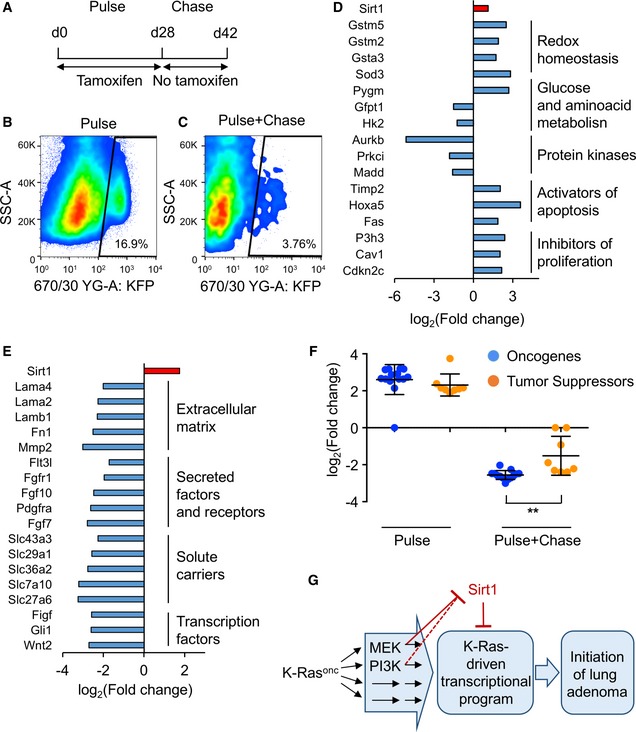
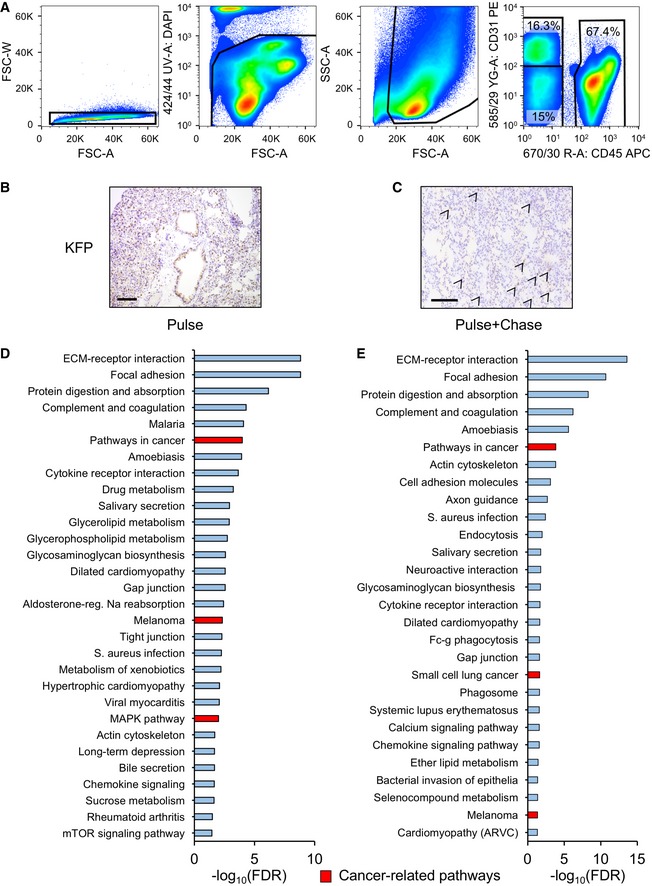
To investigate the mechanisms driving Sirt1‐mediated protection against NSCLC, we decided to characterize pneumocytes where K‐Ras‐KI is activated in Sirt1‐WT and Sirt1‐Tg backgrounds. For this, we used loxP‐flanked Katushka and LacZ reporter genes that become activated upon Cre induction, similar to the inducible system used for the K‐Ras‐KI 47, 48. Using these models, we followed the earliest stages of pneumocytes tumorigenesis (Fig 4A) using Katushka immunohistochemistry or flow cytometry. For cytometry, we homogenized the lungs and stained them using anti‐CD31, that marks endothelial cells; and anti‐CD45, marking lymphocytes (see Fig EV4A for the strategy of isolation). Finally, we analyzed the reporter+, CD31−, CD45− population, to select specifically pneumocytes with activated K‐Ras‐KI (Fig 4B and C). We activated Cre by a pulse of tamoxifen during 4 weeks, and observed a dramatic activation of the expression of the Katushka reporter (pulse, Figs 4B and EV4B). When we stopped tamoxifen treatment, the amount of activated pneumocytes remaining was strongly reduced after a chase of 2 weeks (Figs 4C and EV4C). These results indicate that K‐Ras‐KI‐activated pneumocytes are rapidly cleared from the lung, and only a small fraction of the initially positive cells remain 2 weeks after tamoxifen withdrawal, confirming prior reports 49. We assume that tumors arise from these few long‐term surviving K‐Ras‐KI‐activated pneumocytes, which could be consider as the tumor‐initiating cells.
Figure 4. Sirt1 overexpression in mouse pneumocytes modulates the expression of several tumor‐related genes upon K‐Ras‐KI activation.
-
ATreatment schedule for the isolation of K‐Ras‐KI‐activated pneumocytes. A first phase of 4 weeks of pulse (K‐Ras‐KI activation) by tamoxifen treatment was followed by a chase phase of 2 weeks without tamoxifen for the selection of the remaining K‐Ras‐KI‐activated pneumocytes.
-
B, CRepresentative cytometry heat maps detecting Katushka‐positive cells after only 4 weeks of 4‐OH tamoxifen activation (B), or 4 weeks of 4‐OH tamoxifen pulse + 2 weeks with no tamoxifen treatment chase (C).
-
D, ELists of cancer‐related genes differentially expressed in Sirt1‐Tg pneumocytes compared with Sirt1‐WT pneumocytes in the pulse (D) or in the pulse + chase (E) experiments.
-
FExpression in the indicated experiments of the 13 oncogenes (blue dots) and eight tumor suppressors (orange dots) differentially expressed between WT and Sirt1‐Tg pneumocytes and identified by the KEGG platform as belonging to cancer‐related pathways (red bars in Fig EV4D and E). Middle bars indicate the averages, and error bars represent the standard deviations. Statistical significance between oncogenes and tumor suppressors in each experiment was assessed using the unpaired, two‐tailed Student's t‐test. **P < 0.01.
-
GDiagram depicting our findings on the functional interaction between oncogenic K‐Ras (K‐Rasonc) and Sirt1 in lung tumorigenesis.
Figure EV4. Pneumocyte isolation and characterization.
-
AStrategy for pneumocyte isolation: dissociated lungs were analyzed by cytometry to discard aggregates (first panel); stained with DAPI to exclude dead cells (second panel); and further analyzed by size to discard debris (third panel). Finally, single, alive cells were analyzed for their expression of the lymphocytic marker CD45 or the endothelial marker CD31, and double negatives for CD31/CD45 were considered pneumocytes.
-
B, CRepresentative immunohistochemistry stainings detecting Katushka‐positive cells after only 4 weeks of 4‐OH tamoxifen activation (B) or 4 weeks of 4‐OH tamoxifen pulse + 2 weeks with no tamoxifen treatment chase (C). Size bars represent 200 μm. Arrows indicate Katushka‐positive cells.
-
D, EKEGG pathway clustering of differentially expressed genes between the K‐Ras‐KI; Sirt1‐WT and K‐Ras‐KI; Sirt1‐Tg pneumocytes isolated by FACS sorting in the pulse phase (D) or in the pulse + chase phase (E). Red columns represent cancer‐related pathways.
Based on the above results, we decided to isolate K‐Ras‐KI‐activated pneumocytes from the early phases of activation (pulse: 4 weeks on tamoxifen) and from the surviving cells 2 weeks after the pulse (pulse + chase: 4 weeks on tamoxifen + 2 weeks of rest). We performed RNAseq to detect differentially expressed genes between the Sirt1‐WT and the Sirt1‐Tg backgrounds in both cell populations. We used the β‐galactosidase reporter for the pulse experiment, and the Katushka reporter for the pulse + chase experiment. The differentially expressed genes were grouped according to their function, and we focused our attention on the significantly altered genes between Sirt1‐Tg and Sirt1‐WT pneumocytes that were reported to play a role during tumorigenesis (red‐marked bars in Fig EV4D and E). During the pulse phase, we observed that genes involved in antioxidant defenses were upregulated in the Sirt1‐Tg mice, such as several members of the glutathione S‐transferase family, whose deletion has been found associated with poor prognosis in lung tumors 50, or Sod3, which has been shown to be downregulated in lung tumors 51 (Fig 4D), suggesting that Sirt1 overexpression is associated with stronger oxidative defense. Genes involved in carbohydrate and amino acid metabolism were also differentially regulated in Sirt1‐Tg pneumocytes: increased glycogen phosphorylase (Pygm), that has been found decreased in lung tumors 52; and decreased expression of the tumor inducers glutamine‐fructose‐6 phosphatase transaminase 1 (Gfpt1) 53 and hexokinase 2 (Hk2) 54. We also found in Sirt1‐Tg mice several downregulated protein kinases with pro‐tumorigenic roles: Aurora kinase B (Aurkb); protein kinase C‐iota (Prkci), and MAP‐kinase activating death domain (Madd) 55, 56, 57. Interestingly, Aurkb has been shown to act as a target of K‐Ras signaling, and its disruption reverted K‐Ras‐mediated tumorigenesis in lung cells 57. Finally, several activators of apoptosis and inhibitors of proliferation were also overexpressed in Sirt1‐Tg pneumocytes, as Timp2, Hoxa5, Fas, P3h3, Cav1, and Cdkn2c 58, 59, 60, 61, 62, 63.
We performed the same analysis with the sorted pneumocytes in the pulse + chase experiment (Figs 4E and EV4E). We found that many of the anti‐tumoral genes that were upregulated in Sirt1‐Tg pneumocytes during the pulse experiment (Gstm5, Sod3, Pygm, Timp2, Php3, Cav1 and Cdkn2c) became downregulated during the pulse + chase experiment. Also, the pro‐tumoral genes downregulated in the Sirt1‐Tg pneumocytes during the pulse experiment (Gfpt1, Aurkb, Prkci and Madd) were not downregulated anymore in the pulse + chase experiment. Instead, a different group of pro‐tumoral genes was reduced in Sirt1‐Tg pneumocytes in the pulse + chase experiment, in particular genes related to the extracellular matrix (Mmp2 64 , Lamb1 65), or secreted growth factors or their receptors (Fgf7 66, Fgfr1 67, Pdgfra 68). Moreover, Sirt1‐Tg cells expressed significantly lower mRNA of several solute carrier family members, like Slc27a6, also called Fatp6, a fatty acid transporter 69; Slc29a1, also called Ent1, a nucleoside transporter 70; and Slc43a3, also called Foap‐13, a nucleobase transporter. Two solute carrier members transporting small amino acids were also downregulated in Sirt1‐Tg pneumocytes, namely Slc36a2 71 (also called Pat2) and Slc7a10 72, also known as Asc‐1. Remarkably, amino acid transporters have been found to be essential for nitrogen supply during NSCLC tumor development 73. These divergent results suggest that pneumocytes at the pulse + chase phase have suffered an intense evolution from the pulse phase, and have developed a different transcriptional program.
Finally, to obtain further insight into the effects of Sirt1 overexpression in the process of lung adenocarcinoma tumorigenesis, we performed a new analysis of the differentially expressed genes: we classified each differentially expressed gene identified by the KEGG platform as belonging to cancer‐related pathways (red bars in Fig EV4D and E) into tumor suppressor or oncogene, based on the existing literature, and compared the degree of change between Sirt1‐WT and Sirt1‐Tg pneumocytes in the pulse and in the pulse + chase experiments. As shown in Fig 4F, during the pulse experiment (acute activation of K‐Ras), Sirt1 overexpression led to the increased expression of both oncogenes and tumor suppressors at the same level. However, in the pulse + chase experiment (after cell clearance), the remaining K‐Ras‐activated, Sirt1‐overexpressing pneumocytes showed a marked downregulation of oncogenes, while tumor suppressor genes showed a significantly less pronounced decrease. Altogether, these last results indicate a net balance for tumor suppressive effects of Sirt1 overexpression in the initial stages of lung tumorigenesis and particularly in the subpopulation of cells that have long‐term survival and likely contain the tumor‐initiating cells. These results can also shed some light on the opposing effects of Sirt1 overexpression in different cell types: Sirt1 overexpression can initially trigger both oncogenes and tumor suppressors. Depending on how this situation is resolved, it can result in a net oncogenic function or, as in KRas‐driven mouse lung adenocarcinomas, in a net tumor suppressive function. We summarize all our findings in a schematic model of the K‐Ras‐Sirt1 functional interaction and its relevance for lung adenocarcinoma (Fig 4G).
SIRT1 activity can be induced by fasting and exercise 74, two metabolic interventions that are also associated with reduced cancer incidence 75, 76, 77. Our findings that increased SIRT1 levels and activity can slow lung adenocarcinoma progression in mice and humans provide a partial explanation for this association. Also, SIRT1 is a targetable enzyme and several activators and inhibitors have been developed that can be used to modulate SIRT1 activity 78. Therefore, our results open a therapeutic window for the use of SIRT1‐activating strategies to prevent the first stages of lung cancer development.
Materials and Methods
Cell culture
MEFs were isolated from embryos at 13.5 days post‐coitum and cultured in Dulbecco's modified Eagle's medium (DMEM; Gibco) supplemented with 10% fetal bovine serum and antibiotic/antimycotic (Gibco).
For growth curves, 25,000 cells were plated in 380 mm2 multiwell plates, cultured in media with 10% FBS and counted 4 h later (time point 0), or 4, 6, or 8 days after plating.
For adenoviral infection, cells were incubated with adeno‐Cre particles commercially produced at the University of Iowa at a MOI of 100 for 1 h with periodic rocking to avoid drying.
For β‐galactosidase detection, cells were fixed with 0.5% glutaraldehyde in PBS for 15 min, washed twice with PBS + 1 mM MgCl2, and incubated with X‐Gal staining solution (PBS, 1 mg/ml 5‐bromo‐4‐chloro‐3‐indolyl β‐D‐galactopyranoside (X‐Gal), previously dissolved in N,N‐dimethylformamide), 1 mM MgCl2, 0.1 mM K3Fe(CN)6, 0.1 mM K4Fe(CN)6) overnight until the blue color appears.
For protein stability experiments, cells were incubated with 200 μg/ml cycloheximide (CHX) for the indicated times.
For treatment with inhibitors, cells were treated for 16 h with the PI3K inhibitor CNIO‐PI3K 42 (2 μM), the MEK inhibitor PD0325901 (1 μM) or vehicle (DMSO), and cell lysates were prepared for WB analysis.
Human lung tumor cell lines were purchased from the ATCC and periodically tested for mycoplasma.
Western blot
Whole‐cell extracts were prepared using RIPA buffer (50 mM Tris–HCl, pH 8.1, 1% sodium dodecyl sulfate, 10 mM EDTA) containing proteinase (1 mM phenyl‐methyl‐sulfonyl fluoride‐PMSF, 2 mg/ml leupeptin, 2 mg/ml aprotinin, and 1 mg/ml pepstatin), phosphatase (1 mM NaF and 10 mM sodium orthovanadate), and deacetylase (5 mM nicotinamide—NAM, 1 mM sodium butyrate) inhibitors, resolved using NuPAGE 4–12% gradient Bis‐Tris gels (Invitrogen), transferred to nitrocellulose and hybridized in TBS‐0.01% Tween‐20 + 5% BSA overnight at 4°C using antibodies against mouse Sirt1 (1:1,000, ab12193) and Cre recombinase (1:1,000, ab40011), from Abcam; γ‐tubulin (1:5,000, GTU‐88), from Sigma; total ERK (554100), from BD Biosciences; phospho‐ERK (1:1,000, #9101), pAkt‐Ser473 (1:1,000, #4058), tAkt (1:500, #9272), or human SIRT1 (1:1,000, #2493), from Cell Signaling. For WB quantitation, band and background intensities were analyzed using ImageJ.
Animal experimentation
Animal experimentation at the CNIO, Madrid, was performed according to protocols approved by the CNIO‐ISCIII Ethics Committee for Research and Animal Welfare (CEIyBA). Mice (Mus musculus) of both sexes and mixed background were generated by crossing K‐Ras+/LSLG12Vgeo mice 41 with Sirt1Tg mice 37 and Katushka‐KI mice 47.
For the survival curves, mice that were sacrificed due to verified non‐tumor causes (dermatitis, fighting wounds, eye soreness) were censored out from the curves. For the rest of experiments with mice, we only analyzed those animals that did not die in cage, but were sacrificed following human‐end point criteria.
For the induction of Cre recombination in Figs 3 and EV2A, 2‐ to 3‐month‐old mice were subjected to a single i.p. injection of 1 mg of 4‐OH tamoxifen (Sigma) dissolved in corn oil. For Figs 4 and EV3, mice were given a diet enriched with tamoxifen (TD.130859, ENVIGO) for 4 weeks. Mice were then sacrificed (pulse experiment) or, in the pulse + chase experiment, the diet was switched to a standard diet without tamoxifen for 2 weeks before sacrifice.
Computed tomography (CT) imaging was done as described previously 79. Briefly, food was removed to all mice the afternoon of the preceding day. Analyses were performed during the morning. Mice were anesthetized with a continuous flow of 1–3% isoflurane/oxygen mixture (2 l/min) and were injected with 500 μCi of 18F‐FDG into the tail vein in a volume of 0.1 ml. Images were acquired using eXplore Vista PET/CT (GE Healthcare) 45 min after injection of the radiotracer. The microCT scan consisted of 400 projections collected in one full rotation of the gantry in approximately 10 min. The image acquisition was not respiratory‐gated. The X‐ray tube settings were 40 kV and 300 μA. All quantitative evaluations were performed on the scans reconstructed by filter‐back projection. Regions of interest (ROI) were drawn over tumors using MMWS/Vista software. For the follow‐up of tumor appearance and tumor size, mice were CT‐scanned every 15–20 days.
Histopathology
Tissue samples were fixed in 10% neutral buffered formalin (4% formaldehyde in solution), paraffin‐embedded and cut at 3 μm, mounted in Superfrost®plus (Thermo Fischer Scientific) slides, and dried overnight. For different staining methods, slides were deparaffinized in xylene and re‐hydrated through a series of graded ethanol until water. Consecutive sections were stained with hematoxylin and eosin (H&E), and an automated immunostaining platform was used for immunohistochemistry (Ventana Discovery XT, Roche). Antigen retrieval was first performed with high or low pH buffer (CC1m, Roche), endogenous peroxidase was blocked (peroxide hydrogen at 3%), and slides were then incubated with the primary antibody: rabbit polyclonal anti‐tRFP (1:2,000; Evrogen AB233). After the primary antibody, slides were incubated with the corresponding visualization system (OmniRabbit, Ventana, Roche) conjugated with horseradish peroxidase. Immunohistochemical reaction was developed using 3,30‐diaminobenzidine tetrahydrochloride (DAB) as a chromogen (Chromomap DAB, Ventana, Roche), and nuclei were counterstained with Carazzi's hematoxylin (Panreac). Finally, the slides were dehydrated, cleared, and mounted with a permanent mounting medium (Tissue‐Tek Glass® mounting medium, Sakura) for microscopic evaluation. For quantification and evaluation of mice tumors, the five lobes of the lungs (four right and one left) were placed in the same plane and a H&E staining of a single section across all the lobes was blindly examined by an expert pathologist.
Human lung cancer samples
Primary lung tumors were collected and handled anonymously at collaborating institutions (Instituto Angel H. Roffo and Hospital Britanico) after approval by their Institutional Review Boards (IRB) and following standard ethical and legal protection guidelines of human subjects, including informed consent. Experiments conformed to the principles set out in the WMA Declaration of Helsinki and the Department of Health and Human Services Belmont Report. Patients with local disease (stage I to resectable stage III) were treated surgically and those with advanced disease (stages III and IV) received systemic and/or local treatment. The observation period ranged from 2 to 79 months, with a median follow‐up of 20.5 months. Inclusion criteria of newly diagnosed lung cancer patients were based on the histopathologic information, covering from early to advanced stages, defined according to the histological typing of lung tumors of the World Health Organization 80. A tissue microarray was constructed at the Spanish National Cancer Center and used in this study. This array included a series of archived paraffin‐embedded blocks from 105 NSCLCs patients. Tumor tissues were embedded in paraffin, and 5‐μm sections were stained with hematoxylin and eosin to identify viable, morphologically representative areas of the specimen from which needle core samples were taken, using a precision instrument (Beecher Instruments). From each specimen, triplicate or quadruplicate cores with diameters of 0.6 mm were punched and arrayed on the recipient paraffin block.
Immunohistochemistry and statistical analysis of human samples
Five‐μm sections of these tissue array blocks were cut and placed on charged polylysine‐coated slides and used for immunohistochemistry analysis. Protein expression patterns of SIRT1 were assessed using the tissue microarray outlined above. Standard avidin–biotin immunoperoxidase procedures were used for immunohistochemistry. Antigen retrieval methods (0.01% citric acid for 15 min under microwave treatment) were utilized prior to incubation with primary antibody overnight at 4°C. Primary antibodies were used for immunohistochemistry under the following conditions: SIRT1 (SIR11, S5196, Sigma Aldrich), rabbit polyclonal at 1:200. The biotinylated goat anti‐rabbit secondary antibody (Vector Laboratories) was used at 1:1,000. The absence of primary antibody was used as negative control. Diaminobenzidine was utilized as the final chromogen and hematoxylin as the nuclear counterstain. For the study of SIRT1 as a tumor marker prognostic, REMARK reporting guidelines have been followed. The number of neoplastic cells expressing each protein in the cytoplasm was evaluated. The cutoff of expression for prognostic evaluation was selected based on the median values of expression among the groups under analysis. The consensus value of the three or four representative cores from each tumor sample arrayed was used for statistical analyses. Overall survival time was defined as the months elapsed between surgical resection and death (or the last follow‐up date). Progression analyses were performed using patients with available follow‐up (either “progressing into new metastatic disease” or “alive with no evidence of disease (NED)”). Patients alive at the last follow‐up or lost were censored. The PASW Statistics package (SPSS), version 17.0, was used for statistical analyses. Survival curves were plotted using the standard Kaplan–Meier methodology. Survival curves were tested by log‐rank test. Statistical analyses were performed using the SPSS statistical package (version 18.0, 2010).
qRT–PCR
Total RNA was extracted using Tri Reagent (Molecular Research Center). Samples were reverse‐transcribed using random priming and High‐Capacity cDNA Reverse Transcription kit (ABI Applied Biosystems), according to the manufacturer's instructions. Quantitative real‐time PCR was performed using GoTaq qPCR Master Mix (Promega) in an ABI PRISM 7900 thermocycler. Quantifications were made applying the ΔCt method (ΔCt = [Ct of gene of interest – Ct of housekeeping]). The housekeeping genes used for input normalization were β‐actin and 36b4. Primer sequences are the following:
β‐actin Fwd: GGACCACACCTTCTACAATG
Rvs: GTGGTGGTGAAGCTGTGACC
36b4 Fwd: AGATTCGGGATATGCTGTTGG
Rvs: AAAGCCTGGAAGAAGGAGGTC
Sirt1 Fwd: TGTGAAGTTACTGCAGGAGTGTAAA
Rvs: GCATAGATACCGTCTCTTGATCTGAA
Pneumocyte isolation
Mouse lungs were intracardially perfused with 20 ml ice‐cold PBS, then lungs were removed, and 2 ml of 5 U/ml dispase (Corning) was injected intratracheally. Lungs were placed in a tube containing HBSS + 1% FBS. After 15 min of incubation with dispase at room temperature, digested lungs were cut into small pieces and transferred to a GentleMacs tube containing 7 ml HBSS, 1% FBS, 20 U/ml DNase I (Promega), and 70 U/ml collagenase I (Gibco). Then, samples were homogenized using the “mouse lung 1” GentleMacs program (Miltenyi), incubated for 30 min at 37°C under shaking, and homogenized again with the “mouse lung 2” GentleMacs program. The homogenized mixture was then filtered through a 70‐μm cell strainer (BD) and centrifuged at 300× g for 5 min. Supernatant was discarded, and cell pellet was resuspended in 5 ml Quiagen lysis buffer for 10 min at 37°C for red blood cell lysis. Cells were then resuspended in RPMI + 10% FBS. Cell counting and viability were evaluated using trypan blue (Sigma) in an automated cell counter Countess (Molecular Probes) and resuspended at 107 cells/ml in HBSS + 2% FBS containing 10 mM HEPES buffer (Gibco). For the detection of the β‐galactosidase reporter, β‐galactosidase activity was assessed using the fluorescein di‐β‐D‐galactopyranoside (FDG, Thermo Fisher Scientific) vital substrate, as described elsewhere 48. Briefly, 100 μl of cell suspension was aliquoted into pre‐warmed FACS tubes containing 100 μl of 2 mM FDG solution in distilled water. Cell suspension was mixed and incubated at 37°C in a water bath for the indicated times. FDG uptake was stopped with 2 ml ice‐cold HBSS + 2% FBS + 10 mM HEPES buffer. Cells were then centrifuged at 300× g for 5 min, supernatant was discarded, and cell pellet was resuspended in 300 μl HBSS buffer. For negative controls, the competitive inhibitor of β‐galactosidase activity, phenylethyl β‐D‐thiogalactopyranoside (PETG, Thermo Fisher Scientific), was added prior to the FDG loading to a final concentration of 1 mM. For detection of Katushka, cells were directly treated for flow cytometry as described below.
Flow cytometry
Pneumocytes were blocked for 30 min in HBSS + 3% BSA at 4°C and then stained with anti‐CD45 APC (dilution 1:200, BD) anti‐CD31 PE (dilution 1:400, BD) monoclonal conjugated antibodies. DAPI (Sigma) was added for live/dead discrimination to a final concentration of 20 ng/ml, and samples were immediately acquired in an InFlux (BD) and sorted directly into a tube filled with TriReagent. Fluorochrome spectral overlapping was corrected with the use of single compensation controls (OneComp Beads, eBioscience), and population gating was performed using fluorescence minus one controls (FMOs). All data were analyzed using FlowJo v9.9.3 (Treestar, OR).
RNAseq
Library construction protocol
Pulse experiment: RNA sequencing libraries were prepared following the SMARTseq2 protocol 81 with some modifications. Briefly, RNA quality (RIN value) and quantity was estimated from the Agilent RNA 6000 Nano assay and 1.8 μl of RNA was used for cDNA synthesis. Reverse transcription was performed using SuperScript II (Invitrogen) in the presence of oligo‐dT30VN (1 μM; 5′‐AAGCAGTGGTATCAACGCAGAGTACT30VN‐3′), template‐switching oligonucleotides (1 μM), and betaine (1 M). The cDNA was amplified using the KAPA Hifi Hotstart ReadyMix (Kappa Biosystems), 100 nM ISPCR primer (5′‐AAGCAGTGGTATCAACGCAGAGT‐3′), and eight or 20 cycles of amplification, in function of the starting material quantities. Following purification with Agencourt Ampure XP beads (1:1 ratio; Beckmann Coulter), product size distribution and quantity were assessed on a Bioanalyzer using a High Sensitivity DNA Kit (Agilent). 200 ng of the amplified cDNA was fragmented for 10 min at 55°C using Nextera® XT (Illumina) and amplified for 12 cycles with indexed Nextera® PCR primers. Products were purified twice with Agencourt Ampure XP beads (0.8:1 ratio) and quantified again on a Bioanalyzer using a High Sensitivity DNA Kit.
The Nextera® libraries were sequenced on HiSeq2000 (Illumina, Inc) in paired‐end mode with a read length of 2 × 76 bp using TruSeq SBS Kit v4 and TruSeq Dual Index of 8 + 8 bp. We generated in a mean 20 million paired‐end reads for each sample in a fraction of a sequencing v4 flow cell lane, following the manufacturer's protocol. Image analysis, base calling and quality scoring of the run were processed using the manufacturer's software Real Time Analysis (RTA 1.18.66.3) and followed by generation of FASTQ sequence files by CASAVA.
Pulse+chase experiment: An average of 4.5 ng (range: 2.2–5 ng) of total RNA per sample was used. Sample RNA Integrity Numbers (Agilent 2100 Bioanalyzer) were in the range of 7.4–9.2 (average of 8.2). Total RNA samples were processed with the SMART‐Seq v4 Ultra Low Input RNA Kit (Clontech) following manufacturer instructions. Resulting cDNA was sheared on a S220 Focused ultrasonicator (Covaris) and subsequently processed with the KAPA Hyper Prep Kit v4.15 (KAPA Biosystems). Briefly, oligo(dT)‐primed reverse transcription was performed in the presence of a template‐switching oligonucleotide, and double stranded cDNA was produced by nine cycles of PCR and submitted to acoustic shearing. Fragments were processed through subsequent enzymatic treatments of end‐repair, dA‐tailing, and ligation to Illumina adapters. Adapter‐ligated libraries were completed by limited‐cycle PCR (nine cycles). Libraries were applied to an Illumina flow cell for cluster generation and sequenced with an Illumina HiSeq2000 following manufacturer's protocols. Briefly, image analysis, per‐cycle basecalling, and quality score assignment was performed with Illumina Real Time Analysis software. Conversion of Illumina BCL files to bam format was performed with the Illumina2bam tool (Wellcome Trust Sanger Institute—NPG).
RNAseq data processing and differential expression
All sequenced libraries were filtered in order to keep reads with a Q33 quality score or higher. Quality filtered reads were first mapped to the mouse transcriptome using TopHat2 read mapper 82, and the remaining unmapped reads were mapped to the mouse genome. Ensembl build GRCm38 was used as reference. Alignment sensitivity parameter was set to sensitive and library type as fr‐unstranded (pulse) or fr‐firstrand (pulse + chase), and r parameter was set to the value of the average insert size for each library, along with TopHat2 default parameters. HTSeq (v.0.6.1) 83 was used to generate the count matrix. EdgeR Bioconductor software package was used for differential gene expression data analysis.
Differential expression gene matching between the RNAseq from pneumocytes was formed using R scripts for ID matching.
Functional analysis of the differentially expressed genes was performed using the open GeneCodis tool and KEGG pathways annotations.
Statistical methods
Statistical tests and significances are specified at every figure legend. Sample collection was always performed using biological replicates (individual clones in in vitro experiments, different mouse individuals in in vivo experiments). Where possible, normal distribution of data was checked by the Shapiro–Wilk test, and equal variances were checked by the F‐test. For animal experiments, sample size was chosen by considering statistical parameters from previous, similar experiments 44, estimating a hazard ratio of 2.5 and the power of the statistical test set at 0.8. The subsequent analysis using R software resulted in an estimation of sample size of 15–20 animals per group. For in vitro experiments, we used a minimum of three independent biological replicates, estimating that this sample size is adequate to detect robust changes. In the case of the human lung TMA, three to four different cores from each tumor were included in the TMA. Cells or mice samples were allocated to their experimental groups according to their pre‐determined type (cell type or mouse genotype), and therefore, there was no randomization. Except for the pathological analyses, investigators were not blinded to the experimental groups (cell types or mouse genotypes).
Data availability
The RNAseq data from this publication have been deposited to the GEO database (https://www.ncbi.nlm.nih.gov/geo/) and assigned the identifiers GSE115179 (pulse experiment) and GSE115186 (pulse and chase experiment).
Author contributions
LFC‐M performed most in vitro experiments. RM‐H performed the biostatistics and bioinformatics analysis. MAS and LM performed the FACS‐sorting experiments. KH, CV‐V, MB, CL, and DdlN helped in some of the experiments in vitro. AD‐R and RdC helped in the characterization of the human lung cancer cell lines. MC performed the mouse immunohistopathological analysis. MS‐C performed and analyzed the human NSCLC experiments. DH performed animal experiments and helped in the edition of the work. PJF‐M performed most of the in vivo and in vitro experiments and analyzed all of them. DH, MS, and PJFM designed the experiments and edited the work.
Conflict of interest
The authors declare that they have no conflict of interest.
Supporting information
Expanded View Figures PDF
Table EV1
Source Data for Expanded View
Review Process File
Source Data for Figure 1
Source Data for Figure 2
Acknowledgements
We thank Jesus Herranz for his biostatistical advice; and Alba de Martino, Patricia Gonzalez, María Gomez, and Zaira Vega, from the Histopathology Unit at the CNIO, for their work in mouse histopathology. Work in the laboratory of P.J.F.‐M. was funded by the IMDEA Food, the Spanish Association against Cancer (aecc) and the Ramon Areces (CIVP18A3891) Foundation. Work in the laboratory of M.S. was funded by the CNIO and by grants from the Spanish Ministry of Economy co‐funded by the European Regional Development Fund (SAF project), the European Research Council (ERC Advanced Grant), the European Union (RISK‐IR project), and the Botin Foundation and Banco Santander (Santander Universities Global Division). Work in the laboratory of DH was funded by Rutgers Cancer Institute of New Jersey, the Alex's Lemonade Stand Foundation Shark Tank Award and by the National Institutes of Health Grant K99/R00 CA197869. Work in the laboratory of M.S.C. was supported by a grant (SAF2012‐40026) from the Spanish Ministry of Science and Innovation. L.F.C‐M. was supported by a PhD Fellowship from the Portuguese Foundation for Science and Technology (FCT‐MCTES, SFRH/BD/124022/2016).
EMBO Reports (2018) 19: e43879
Contributor Information
Daniel Herranz, Email: dh710@cinj.rutgers.edu.
Manuel Serrano, Email: manuel.serrano@irbbarcelona.org.
Pablo J Fernandez‐Marcos, Email: pablojose.fernandez@imdea.org.
References
- 1. Ferlay J, Soerjomataram I, Dikshit R, Eser S, Mathers C, Rebelo M, Parkin DM, Forman D, Bray F (2015) Cancer incidence and mortality worldwide: sources, methods and major patterns in GLOBOCAN 2012. Int J Cancer 136: E359–E386 [DOI] [PubMed] [Google Scholar]
- 2. Luo SY, Lam DC, Bronte G, Rizzo S, La Paglia L, Adamo V, Siragusa S, Ficorella C, Santini D, Bazan V et al (2013) Oncogenic driver mutations in lung cancer. Transl Respir Med 1: 6 [DOI] [PMC free article] [PubMed] [Google Scholar]
- 3. Sun J‐M, Hwang DW, Ahn JS, Ahn M‐J, Park K (2013) Prognostic and predictive value of KRAS mutations in advanced non‐small cell lung cancer. PLoS ONE 8: e64816 [DOI] [PMC free article] [PubMed] [Google Scholar]
- 4. Linardou H, Dahabreh IJ, Kanaloupiti D, Siannis F, Bafaloukos D, Kosmidis P, Papadimitriou CA, Murray S (2008) Assessment of somatic k‐RAS mutations as a mechanism associated with resistance to EGFR‐targeted agents: a systematic review and meta‐analysis of studies in advanced non‐small‐cell lung cancer and metastatic colorectal cancer. Lancet Oncol 9: 962–972 [DOI] [PubMed] [Google Scholar]
- 5. McCormick F (2015) KRAS as a therapeutic target. Clin Cancer Res 21: 1797–1801 [DOI] [PMC free article] [PubMed] [Google Scholar]
- 6. Park S‐H, Zhu Y, Ozden O, Kim H‐S, Jiang H, Deng C‐X, Gius D, Vassilopoulos A (2012) SIRT2 is a tumor suppressor that connects aging, acetylome, cell cycle signaling, and carcinogenesis. Transl Cancer Res 1: 15–21 [PMC free article] [PubMed] [Google Scholar]
- 7. Finley LWS, Carracedo A, Lee J, Souza A, Egia A, Zhang J, Teruya‐Feldstein J, Moreira PI, Cardoso SM, Clish CB et al (2011) SIRT3 opposes reprogramming of cancer cell metabolism through HIF1α destabilization. Cancer Cell 19: 416–428 [DOI] [PMC free article] [PubMed] [Google Scholar]
- 8. Jeong SM, Xiao C, Finley LWS, Lahusen T, Souza AL, Pierce K, Li Y‐H, Wang X, Laurent G, German NJ et al (2013) SIRT4 has tumor‐suppressive activity and regulates the cellular metabolic response to DNA damage by inhibiting mitochondrial glutamine metabolism. Cancer Cell 23: 450–463 [DOI] [PMC free article] [PubMed] [Google Scholar]
- 9. Sebastián C, Zwaans BMM, Silberman DM, Gymrek M, Goren A, Zhong L, Ram O, Truelove J, Guimaraes AR, Toiber D et al (2012) The histone deacetylase SIRT6 is a tumor suppressor that controls cancer metabolism. Cell 151: 1185–1199 [DOI] [PMC free article] [PubMed] [Google Scholar]
- 10. Lu W, Zuo Y, Feng Y, Zhang M (2014) SIRT5 facilitates cancer cell growth and drug resistance in non‐small cell lung cancer. Tumor Biol 35: 10699–10705 [DOI] [PubMed] [Google Scholar]
- 11. Barber MF, Michishita‐Kioi E, Xi Y, Tasselli L, Kioi M, Moqtaderi Z, Tennen RI, Paredes S, Young NL, Chen K et al (2012) SIRT7 links H3K18 deacetylation to maintenance of oncogenic transformation. Nature 487: 114–118 [DOI] [PMC free article] [PubMed] [Google Scholar]
- 12. Zhang S, Chen P, Huang Z, Hu X, Chen M, Hu S, Hu Y, Cai T, Toyota M, Satoh A et al (2015) Sirt7 promotes gastric cancer growth and inhibits apoptosis by epigenetically inhibiting miR‐34a. Sci Rep 5: 9787 [DOI] [PMC free article] [PubMed] [Google Scholar] [Retracted]
- 13. Wang R‐H, Sengupta K, Li C, Kim H‐S, Cao L, Xiao C, Kim S, Xu X, Zheng Y, Chilton B et al (2008) Impaired DNA damage response, genome instability, and tumorigenesis in SIRT1 mutant mice. Cancer Cell 14: 312–323 [DOI] [PMC free article] [PubMed] [Google Scholar]
- 14. Jang S‐H, Min K‐W, Paik SS, Jang K‐S (2012) Loss of SIRT1 histone deacetylase expression associates with tumour progression in colorectal adenocarcinoma. J Clin Pathol 65: 735–739 [DOI] [PubMed] [Google Scholar]
- 15. Jang KY, Kim KS, Hwang SH, Kwon KS, Kim KR, Park HS, Park B‐H, Chung MJ, Kang MJ, Lee DG et al (2009) Expression and prognostic significance of SIRT1 in ovarian epithelial tumours. Pathology 41: 366–371 [DOI] [PubMed] [Google Scholar]
- 16. Noguchi A, Li X, Kubota A, Kikuchi K, Kameda Y, Zheng H, Miyagi Y, Aoki I, Takano Y (2013) SIRT1 expression is associated with good prognosis for head and neck squamous cell carcinoma patients. Oral Surg Oral Med Oral Pathol Oral Radiol 115: 385–392 [DOI] [PubMed] [Google Scholar]
- 17. Zhang Y, Cai X, Chai N, Gu Y, Zhang S, Ding M, Cao H, Sha S, Yin J, Li M et al (2015) SIRT1 is reduced in gastric adenocarcinoma and acts as a potential tumor suppressor in gastric cancer. Gastrointest Tumors 2: 109–123 [Google Scholar]
- 18. Kikuchi K, Noguchi A, Kasajima R, Miyagi Y, Hoshino D, Koshikawa N, Kubota A, Yokose T, Takano Y (2015) Association of SIRT1 and tumor suppressor gene TAp63 expression in head and neck squamous cell carcinoma. Tumor Biol 36: 7865–7872 [DOI] [PubMed] [Google Scholar]
- 19. Firestein R, Blander G, Michan S, Oberdoerffer P, Ogino S, Campbell J, Bhimavarapu A, Luikenhuis S, de Cabo R, Fuchs C et al (2008) The SIRT1 deacetylase suppresses intestinal tumorigenesis and colon cancer growth. PLoS ONE 3: e2020 [DOI] [PMC free article] [PubMed] [Google Scholar]
- 20. Oberdoerffer P, Michan S, McVay M, Mostoslavsky R, Vann J, Park S‐K, Hartlerode A, Stegmuller J, Hafner A, Loerch P et al (2008) SIRT1 redistribution on chromatin promotes genomic stability but alters gene expression during aging. Cell 135: 907–918 [DOI] [PMC free article] [PubMed] [Google Scholar]
- 21. Herranz D, Muñoz‐Martin M, Cañamero M, Mulero F, Martinez‐Pastor B, Fernandez‐Capetillo O, Serrano M (2010) Sirt1 improves healthy ageing and protects from metabolic syndrome‐associated cancer. Nat Commun 1: 3 [DOI] [PMC free article] [PubMed] [Google Scholar]
- 22. Wu M, Wei W, Xiao X, Guo J, Xie X, Li L, Kong Y, Lv N, Jia W, Zhang Y et al (2012) Expression of SIRT1 is associated with lymph node metastasis and poor prognosis in both operable triple‐negative and non‐triple‐negative breast cancer. Med Oncol 29: 3240–3249 [DOI] [PubMed] [Google Scholar]
- 23. Huffman DM, Grizzle WE, Bamman MM, Kim J, Eltoum IA, Elgavish A, Nagy TR (2007) SIRT1 is significantly elevated in mouse and human prostate cancer. Cancer Res 67: 6612–6618 [DOI] [PubMed] [Google Scholar]
- 24. Chen H‐C, Jeng Y‐M, Yuan R‐H, Hsu H‐C, Chen Y‐L (2012) SIRT1 promotes tumorigenesis and resistance to chemotherapy in hepatocellular carcinoma and its expression predicts poor prognosis. Ann Surg Oncol 19: 2011–2019 [DOI] [PubMed] [Google Scholar]
- 25. Li L, Osdal T, Ho Y, Chun S, McDonald T, Agarwal P, Lin A, Chu S, Qi J, Li L et al (2014) SIRT1 activation by a c‐MYC oncogenic network promotes the maintenance and drug resistance of human FLT3‐ITD acute myeloid leukemia stem cells. Cell Stem Cell 15: 431–446 [DOI] [PMC free article] [PubMed] [Google Scholar]
- 26. Li L, Wang L, Li L, Wang Z, Ho Y, McDonald T, Holyoake TL, Chen W, Bhatia R (2012) Activation of p53 by SIRT1 inhibition enhances elimination of CML leukemia stem cells in combination with imatinib. Cancer Cell 21: 266–281 [DOI] [PMC free article] [PubMed] [Google Scholar]
- 27. Zhang T, Rong N, Chen J, Zou C, Jing H, Zhu X, Zhang W (2013) SIRT1 expression is associated with the chemotherapy response and prognosis of patients with advanced NSCLC. PLoS ONE 8: e79162 [DOI] [PMC free article] [PubMed] [Google Scholar]
- 28. Chen X, Hokka D, Maniwa Y, Ohbayashi C, Itoh T, Hayashi Y (2014) Sirt1 is a tumor promoter in lung adenocarcinoma. Oncol Lett 8: 387–393 [DOI] [PMC free article] [PubMed] [Google Scholar]
- 29. Grbesa I, Pajares MJ, Martínez‐Terroba E, Agorreta J, Mikecin A‐M, Larráyoz M, Idoate MA, Gall‐Troselj K, Pio R, Montuenga LM (2015) Expression of sirtuin 1 and 2 is associated with poor prognosis in non‐small cell lung cancer patients. PLoS ONE 10: e0124670 [DOI] [PMC free article] [PubMed] [Google Scholar]
- 30. Li C, Wang L, Zheng L, Zhan X, Xu B, Jiang J, Wu C (2015) SIRT1 expression is associated with poor prognosis of lung adenocarcinoma. Onco Targets Ther 8: 977 [DOI] [PMC free article] [PubMed] [Google Scholar]
- 31. Lin S‐Y, Peng F (2016) Association of SIRT1 and HMGA1 expression in non‐small cell lung cancer. Oncol Lett 11: 782–788 [DOI] [PMC free article] [PubMed] [Google Scholar]
- 32. Noh SJ, Baek HA, Park HS, Jang KY, Moon WS, Kang MJ, Lee DG, Kim MH, Lee JH, Chung MJ (2013) Expression of SIRT1 and cortactin is associated with progression of non‐small cell lung cancer. Pathol Res Pract 209: 365–370 [DOI] [PubMed] [Google Scholar]
- 33. Herranz D, Maraver A, Cañamero M, Gómez‐López G, Inglada‐Pérez L, Robledo M, Castelblanco E, Matias‐Guiu X, Serrano M (2013) SIRT1 promotes thyroid carcinogenesis driven by PTEN deficiency. Oncogene 32: 4052–4056 [DOI] [PubMed] [Google Scholar]
- 34. Leko V, Park GJ, Lao U, Simon JA, Bedalov A (2013) Enterocyte‐specific inactivation of SIRT1 reduces tumor load in the APC(+/min) mouse model. PLoS ONE 8: e66283 [DOI] [PMC free article] [PubMed] [Google Scholar]
- 35. O'Hagan HM, Wang W, Sen S, DeStefano Shields C, Lee SS, Zhang YW, Clements EG, Cai Y, Van Neste L, Easwaran H et al (2011) Oxidative damage targets complexes containing DNA methyltransferases, SIRT1, and polycomb members to promoter CpG islands. Cancer Cell 20: 606–619 [DOI] [PMC free article] [PubMed] [Google Scholar]
- 36. Cheng D, Zhao L, Xu Y, Ou R, Li G, Yang H, Li W (2015) K‐Ras promotes the non‐small lung cancer cells survival by cooperating with sirtuin 1 and p27 under ROS stimulation. Tumor Biol 36: 7221–7232 [DOI] [PubMed] [Google Scholar]
- 37. Pfluger PT, Herranz D, Velasco‐Miguel S, Serrano M, Tschöp MH (2008) Sirt1 protects against high‐fat diet‐induced metabolic damage. Proc Natl Acad Sci USA 105: 9793–9798 [DOI] [PMC free article] [PubMed] [Google Scholar]
- 38. Pylayeva‐Gupta Y, Grabocka E, Bar‐Sagi D (2011) RAS oncogenes: weaving a tumorigenic web. Nat Rev Cancer 11: 761–774 [DOI] [PMC free article] [PubMed] [Google Scholar]
- 39. Forbes SA, Bindal N, Bamford S, Cole C, Kok CY, Beare D, Jia M, Shepherd R, Leung K, Menzies A et al (2011) COSMIC: mining complete cancer genomes in the catalogue of somatic mutations in cancer. Nucleic Acids Res 39: D945–D950 [DOI] [PMC free article] [PubMed] [Google Scholar]
- 40. Prior IA, Lewis PD, Mattos C (2012) A comprehensive survey of Ras mutations in cancer. Cancer Res 72: 2457–2467 [DOI] [PMC free article] [PubMed] [Google Scholar]
- 41. Guerra C, Mijimolle N, Dhawahir A, Dubus P, Barradas M, Serrano M, Campuzano V, Barbacid M (2003) Tumor induction by an endogenous K‐ras oncogene is highly dependent on cellular context. Cancer Cell 4: 111–120 [DOI] [PubMed] [Google Scholar]
- 42. Ortega‐Molina A, Lopez‐Guadamillas E, Mattison JA, Mitchell SJ, Muñoz‐Martin M, Iglesias G, Gutierrez VM, Vaughan KL, Szarowicz MD, González‐García I et al (2015) Pharmacological inhibition of PI3K reduces adiposity and metabolic syndrome in obese mice and rhesus monkeys. Cell Metab 21: 558–570 [DOI] [PMC free article] [PubMed] [Google Scholar]
- 43. Maraver A, Fernandez‐Marcos PJ, Herranz D, Cañamero M, Muñoz‐Martin M, Gómez‐López G, Mulero F, Megías D, Sanchez‐Carbayo M, Shen J et al (2012) Therapeutic effect of γ‐secretase inhibition in KrasG12V‐driven non‐small cell lung carcinoma by derepression of DUSP1 and inhibition of ERK. Cancer Cell 22: 222–234 [DOI] [PMC free article] [PubMed] [Google Scholar]
- 44. Joshi J, Fernandez‐Marcos PJ, Galvez A, Amanchy R, Linares JF, Duran A, Pathrose P, Leitges M, Cañamero M, Collado M et al (2008) Par‐4 inhibits Akt and suppresses Ras‐induced lung tumorigenesis. EMBO J 27: 2181–2193 [DOI] [PMC free article] [PubMed] [Google Scholar]
- 45. Wang J, Wang C (2016) Prognostic and predictive role of sirtuin1 expression in lung adenocarcinoma. Clin Lab 62: 1989–1994 [DOI] [PubMed] [Google Scholar]
- 46. Chen C‐W, Koche RP, Sinha AU, Deshpande AJ, Zhu N, Eng R, Doench JG, Xu H, Chu SH, Qi J et al (2015) DOT1L inhibits SIRT1‐mediated epigenetic silencing to maintain leukemic gene expression in MLL‐rearranged leukemia. Nat Med 21: 335–343 [DOI] [PMC free article] [PubMed] [Google Scholar]
- 47. Diéguez‐Hurtado R, Martín J, Martínez‐Corral I, Martínez MD, Megías D, Olmeda D, Ortega S (2011) A Cre‐reporter transgenic mouse expressing the far‐red fluorescent protein Katushka. Genesis 49: 36–45 [DOI] [PubMed] [Google Scholar]
- 48. Sánchez‐Luengo MÁ, Rovira M, Serrano M, Fernandez‐Marcos PJ, Martinez L (2017) Analysis of the advantages of cis reporters in optimized FACS‐Gal. Cytom Part A 91: 721–729 [DOI] [PubMed] [Google Scholar]
- 49. Mainardi S, Mijimolle N, Francoz S, Vicente‐Dueñas C, Sánchez‐García I, Barbacid M (2014) Identification of cancer initiating cells in K‐Ras driven lung adenocarcinoma. Proc Natl Acad Sci USA 111: 255–260 [DOI] [PMC free article] [PubMed] [Google Scholar]
- 50. Yang H, Yang S, Liu J, Shao F, Wang H, Wang Y (2015) The association of GSTM1 deletion polymorphism with lung cancer risk in Chinese population: evidence from an updated meta‐analysis. Sci Rep 5: 9392 [DOI] [PMC free article] [PubMed] [Google Scholar]
- 51. Svensk A‐M, Soini Y, Pääkkö P, Hirvikoski P, Kinnula VL (2004) Differential expression of superoxide dismutases in lung cancer. Am J Clin Pathol 122: 395–404 [DOI] [PubMed] [Google Scholar]
- 52. Vageli D, Daniil Z, Dahabreh J, Karagianni E, Liloglou T, Koukoulis G, Gourgoulianis K (2006) Microsatellite instability and loss of heterozygosity at the MEN1 locus in lung carcinoid tumors: a novel approach using real‐time PCR with melting curve analysis in histopathologic material. Oncol Rep 15: 557–564 [PubMed] [Google Scholar]
- 53. Yang C, Peng P, Li L, Shao M, Zhao J, Wang L, Duan F, Song S, Wu H, Zhang J et al (2016) High expression of GFAT1 predicts poor prognosis in patients with pancreatic cancer. Sci Rep 6: 39044 [DOI] [PMC free article] [PubMed] [Google Scholar]
- 54. Patra KC, Wang Q, Bhaskar PT, Miller L, Wang Z, Wheaton W, Chandel N, Laakso M, Muller WJ, Allen EL et al (2013) Hexokinase 2 is required for tumor initiation and maintenance and its systemic deletion is therapeutic in mouse models of cancer. Cancer Cell 24: 213–228 [DOI] [PMC free article] [PubMed] [Google Scholar]
- 55. Bi W, Wei Y, Wu J, Sun G, Guo Y, Zhang Q, Dong L (2013) MADD promotes the survival of human lung adenocarcinoma cells by inhibiting apoptosis. Oncol Rep 29: 1533–1539 [DOI] [PubMed] [Google Scholar]
- 56. Regala RP, Weems C, Jamieson L, Khoor A, Edell ES, Lohse CM, Fields AP (2005) Atypical protein kinase Cι is an oncogene in human non‐small cell lung cancer. Cancer Res 65: 8905–8911 [DOI] [PubMed] [Google Scholar]
- 57. Dos Santos EO, Carneiro‐Lobo TC, Aoki MN, Levantini E, Bassères DS (2016) Aurora kinase targeting in lung cancer reduces KRAS‐induced transformation. Mol Cancer 15: 12 [DOI] [PMC free article] [PubMed] [Google Scholar]
- 58. Solomon DA, Kim J‐S, Jenkins S, Ressom H, Huang M, Coppa N, Mabanta L, Bigner D, Yan H, Jean W et al (2008) Identification of p18INK4c as a tumor suppressor gene in glioblastoma multiforme. Cancer Res 57: 4187–4190 [DOI] [PMC free article] [PubMed] [Google Scholar]
- 59. Volonte D, Vyas AR, Chen C, Dacic S, Stabile LP, Kurland BF, Abberbock SR, Burns TF, Herman JG, Di YP et al (2018) Caveolin‐1 promotes the tumor suppressor properties of oncogene‐induced cellular senescence. J Biol Chem 293: 1794–1809 [DOI] [PMC free article] [PubMed] [Google Scholar]
- 60. Li Y, Chen Y, Ma Y, Nenkov M, Haase D, Petersen I (2018) Collagen prolyl hydroxylase 3 has a tumor suppressive activity in human lung cancer. Exp Cell Res 363: 121–128 [DOI] [PubMed] [Google Scholar]
- 61. Uramoto H, Osaki T, Inoue M, Taga S, Takenoyama M, Hanagiri T, Yoshino I, Nakanishi R, Ichiyoshi Y, Yasumoto K (1999) Fas expression in non‐small cell lung cancer: its prognostic effect in completely resected stage III patients. Eur J Cancer 35: 1462–1465 [DOI] [PubMed] [Google Scholar]
- 62. Remillard TC, Bratslavsky G, Jensen‐Taubman S, Stetler‐Stevenson WG, Bourboulia D (2014) Molecular mechanisms of tissue inhibitor of metalloproteinase 2 in the tumor microenvironment. Mol Cell Ther 2: 17 [DOI] [PMC free article] [PubMed] [Google Scholar]
- 63. Chang C‐J, Chen Y‐L, Hsieh C‐H, Liu Y‐J, Yu S‐L, Chen JJW, Wang C‐C (2017) HOXA5 and p53 cooperate to suppress lung cancer cell invasion and serve as good prognostic factors in non‐small cell lung cancer. J Cancer 8: 1071–1081 [DOI] [PMC free article] [PubMed] [Google Scholar]
- 64. Leinonen T, Pirinen R, Böhm J, Johansson R, Kosma V‐M (2008) Increased expression of matrix metalloproteinase‐2 (MMP‐2) predicts tumour recurrence and unfavourable outcome in non‐small cell lung cancer. Histol Histopathol 23: 693–700 [DOI] [PubMed] [Google Scholar]
- 65. Lin Q, Lim HSR, Lin HL, Tan HT, Lim TK, Cheong WK, Cheah PY, Tang CL, Chow PKH, Chung MCM (2015) Analysis of colorectal cancer glyco‐secretome identifies laminin β‐1 (LAMB1) as a potential serological biomarker for colorectal cancer. Proteomics 15: 3905–3920 [DOI] [PubMed] [Google Scholar]
- 66. Yasuhara T, Okamoto A, Kitagawa T, Nikaido T, Yoshimura T, Yanaihara N, Takakura S, Tanaka T, Ochiai K, Ohtake Y (2005) FGF7‐like gene is associated with pericentric inversion of chromosome 9, and FGF7 is involved in the development of ovarian cancer. Int J Oncol 26: 1209–1216 [PubMed] [Google Scholar]
- 67. Weeden C, Solomon B, Asselin‐Labat M‐L, Peifer M, Fernandez‐Cuesta L, Sos M, George J, Seidel D, Kasper L, Hammerman P et al (2015) FGFR1 inhibition in lung squamous cell carcinoma: questions and controversies. Cell Death Discov 1: 15049 [DOI] [PMC free article] [PubMed] [Google Scholar]
- 68. Velghe AI, Van Cauwenberghe S, Polyansky AA, Chand D, Montano‐Almendras CP, Charni S, Hallberg B, Essaghir A, Demoulin J‐B (2014) PDGFRA alterations in cancer: characterization of a gain‐of‐function V536E transmembrane mutant as well as loss‐of‐function and passenger mutations. Oncogene 33: 2568–2576 [DOI] [PubMed] [Google Scholar]
- 69. Gimeno RE, Ortegon AM, Patel S, Punreddy S, Ge P, Sun Y, Lodish HF, Stahl A (2003) Characterization of a heart‐specific fatty acid transport protein. J Biol Chem 278: 16039–16044 [DOI] [PubMed] [Google Scholar]
- 70. Yao SY, Ng AM, Muzyka WR, Griffiths M, Cass CE, Baldwin SA, Young JD (1997) Molecular cloning and functional characterization of nitrobenzylthioinosine (NBMPR)‐sensitive (es) and NBMPR‐insensitive (ei) equilibrative nucleoside transporter proteins (rENT1 and rENT2) from rat tissues. J Biol Chem 272: 28423–28430 [DOI] [PubMed] [Google Scholar]
- 71. Foltz M, Oechsler C, Boll M, Kottra G, Daniel H (2004) Substrate specificity and transport mode of the proton‐dependent amino acid transporter mPAT2. Eur J Biochem 271: 3340–3347 [DOI] [PubMed] [Google Scholar]
- 72. Nakauchi J, Matsuo H, Kim DK, Goto A, Chairoungdua A, Cha SH, Inatomi J, Shiokawa Y, Yamaguchi K, Saito I et al (2000) Cloning and characterization of a human brain Na(+)‐independent transporter for small neutral amino acids that transports D‐serine with high affinity. Neurosci Lett 287: 231–235 [DOI] [PubMed] [Google Scholar]
- 73. Mayers JR, Torrence ME, Danai L V, Papagiannakopoulos T, Davidson SM, Bauer MR, Lau AN, Ji BW, Dixit PD, Hosios AM et al (2016) Tissue of origin dictates branched‐chain amino acid metabolism in mutant Kras‐driven cancers. Science 353: 1161–1165 [DOI] [PMC free article] [PubMed] [Google Scholar]
- 74. Cantó C, Jiang LQ, Deshmukh AS, Mataki C, Coste A, Lagouge M, Zierath JR, Auwerx J (2010) Interdependence of AMPK and SIRT1 for metabolic adaptation to fasting and exercise in skeletal muscle. Cell Metab 11: 213–219 [DOI] [PMC free article] [PubMed] [Google Scholar]
- 75. Gonçalves AK, Dantas Florencio GL, Maisonnette de Atayde Silva MJ, Cobucci RN, Giraldo PC, Cote NM (2014) Effects of physical activity on breast cancer prevention: a systematic review. J Phys Act Health 11: 445–454 [DOI] [PubMed] [Google Scholar]
- 76. Emaus A, Thune I (2011) Physical activity and lung cancer prevention. Recent Results Cancer Res 186: 101–133 [DOI] [PubMed] [Google Scholar]
- 77. Longo VD, Fontana L (2010) Calorie restriction and cancer prevention: metabolic and molecular mechanisms. Trends Pharmacol Sci 31: 89–98 [DOI] [PMC free article] [PubMed] [Google Scholar]
- 78. Villalba JM, Alcaín FJ (2012) Sirtuin activators and inhibitors. BioFactors 38: 349–359 [DOI] [PMC free article] [PubMed] [Google Scholar]
- 79. Mulero F, Donate LE, Serrano M (2011) Imaging cancer in mice by PET, CT, and combined PET‐CT. Curr Protoc Mouse Biol 1: 85–103 [DOI] [PubMed] [Google Scholar]
- 80. Brambilla E, Travis WD, Colby TV, Corrin B, Shimosato Y (2001) The new World Health Organization classification of lung tumours. Eur Respir J 18: 1059–1068 [DOI] [PubMed] [Google Scholar]
- 81. Picelli S, Björklund ÅK, Faridani OR, Sagasser S, Winberg G, Sandberg R (2013) Smart‐seq2 for sensitive full‐length transcriptome profiling in single cells. Nat Methods 10: 1096–1098 [DOI] [PubMed] [Google Scholar]
- 82. Kim D, Pertea G, Trapnell C, Pimentel H, Kelley R, Salzberg SL, Mortazavi A, Williams B, McCue K, Schaeffer L et al (2013) TopHat2: accurate alignment of transcriptomes in the presence of insertions, deletions and gene fusions. Genome Biol 14: R36 [DOI] [PMC free article] [PubMed] [Google Scholar]
- 83. Anders S, Pyl PT, Huber W (2015) HTSeq–a Python framework to work with high‐throughput sequencing data. Bioinformatics 31: 166–169 [DOI] [PMC free article] [PubMed] [Google Scholar]
Associated Data
This section collects any data citations, data availability statements, or supplementary materials included in this article.
Supplementary Materials
Expanded View Figures PDF
Table EV1
Source Data for Expanded View
Review Process File
Source Data for Figure 1
Source Data for Figure 2
Data Availability Statement
The RNAseq data from this publication have been deposited to the GEO database (https://www.ncbi.nlm.nih.gov/geo/) and assigned the identifiers GSE115179 (pulse experiment) and GSE115186 (pulse and chase experiment).