Abstract
Autophagy maintains cellular homeostasis by targeting damaged organelles, pathogens, or misfolded protein aggregates for lysosomal degradation. The autophagic process is initiated by the formation of autophagosomes, which can selectively enclose cargo via autophagy cargo receptors. A machinery of well‐characterized autophagy‐related proteins orchestrates the biogenesis of autophagosomes; however, the origin of the required membranes is incompletely understood. Here, we have applied sensitized pooled CRISPR screens and identify the uncharacterized transmembrane protein TMEM41B as a novel regulator of autophagy. In the absence of TMEM41B, autophagosome biogenesis is stalled, LC3 accumulates at WIPI2‐ and DFCP1‐positive isolation membranes, and lysosomal flux of autophagy cargo receptors and intracellular bacteria is impaired. In addition to defective autophagy, TMEM41B knockout cells display significantly enlarged lipid droplets and reduced mobilization and β‐oxidation of fatty acids. Immunostaining and interaction proteomics data suggest that TMEM41B localizes to the endoplasmic reticulum (ER). Taken together, we propose that TMEM41B is a novel ER‐localized regulator of autophagosome biogenesis and lipid mobilization.
Keywords: autophagy, CRISPR, endoplasmic reticulum, lipid droplets, TMEM41B
Subject Categories: Autophagy & Cell Death, Membrane & Intracellular Transport, Metabolism
Introduction
Lysosomal clearance of autophagic cargo is an essential catabolic cellular process that is compromised in several disease states 1. Autophagy is basally active in most cell types and can be strongly induced under stress such as nutrient starvation 2. mTOR complex 1 orchestrates cell growth response to nutrient availability and has been established as a key negative regulator of autophagy 3. Different sets of autophagy‐related proteins control the stepwise progression of autophagy with initiation occurring at subdomains of the ER, termed omegasomes 4. As an early event, phosphorylation of phosphatidylinositol by VPS34 (PIK3C3) recruits PI(3)P effectors such as WIPI proteins to phagophores, also known as isolation membranes 5, 6. WIPI proteins in turn recruit LC3 and its conjugation machinery to growing isolation membranes, which can selectively encapsulate cargo via autophagy cargo receptors such as p62 (SQSTM1), TAX1BP1, or NDP52 (CALCOCO2) 2, 7, 8. The membrane elongation step to form a sealed autophagosome is incompletely understood and has been shown to require various cellular organelles and compartments including the ER, ER‐Golgi intermediate compartment, plasma membrane, mitochondria, lipid droplets (LDs), and their corresponding contact sites 9, 10, 11, 12, 13, 14.
To identify novel regulators of mammalian autophagy, we have developed and validated FACS‐based pooled CRISPR screening approaches to study the turnover of autophagy cargo receptors such as p62 15 or TAX1BP1 16. In this study, we dissected the regulation of the autophagy cargo receptors p62 and NDP52 by comparing basal and activated autophagy. This screening paradigm uncovered TMEM41B, which we characterized as a novel ER transmembrane protein required for autophagosome biogenesis and lipid mobilization.
Results and Discussion
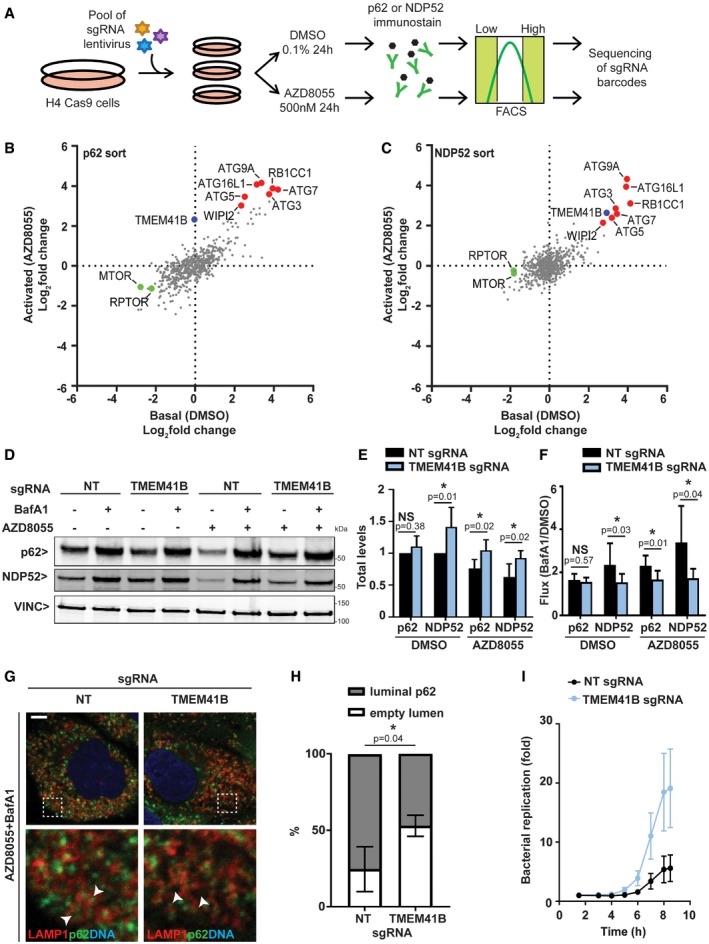
We set out to uncover novel regulators of autophagy using the FACS‐based pooled CRISPR screening paradigm outlined in Fig 1A. Neuroglioma H4 cells were chosen for their amenability to pooled CRISPR screening and well‐profiled autophagy pathway at genomewide scale 15, 16, 17. We monitored two endogenous autophagy cargo receptors, namely p62 and NDP52, by immunofluorescence‐based staining in Cas9‐expressing H4 cells. A mini‐pool library of the single most potent sgRNAs from our previous GFP‐p62 genomewide screen 15 was screened basally or when autophagy was activated with the mTOR inhibitor AZD8055 18 (Dataset EV1). Core components of mammalian autophagy such as ATG3, ATG5, ATG7, ATG9A, ATG16L1, RB1CC1, or WIPI2 scored as robust regulators of both p62 and NDP52 (Fig 1B and C). Depletion of mTOR and Raptor (RPTOR) activated autophagy and reduced levels of p62 and NDP52 as expected, with fold changes being more pronounced under basal conditions. We identified the uncharacterized transmembrane protein TMEM41B as a strong hit for p62 turnover when autophagy was activated with AZD8055 (Fig 1B). TMEM41B was also among the top‐scoring regulators of NDP52 (Fig 1C) and TAX1BP1 16. We validated this screening result in H4 Cas9 cells upon CRISPR‐mediated depletion of TMEM41B. Since we were unable to identify an antibody to monitor endogenous levels of TMEM41B, we sequenced the TMEM41B genomic locus of the knockout (KO) cell population and confirmed editing in 63% of all sequences using the TIDE method 19. TMEM41B depletion did not alter basal levels of p62, but stalled its clearance upon autophagy induction with AZD8055, while NDP52 levels were significantly increased under basal as well as activated autophagy (Figs 1D and E, and EV1A). By quantifying the increase in protein levels upon lysosomal inhibition with the V‐ATPase inhibitor Bafilomycin A1, we found that lysosomal flux of both p62 and NDP52 was significantly impaired when autophagy was activated with AZD8055 in TMEM41B‐depleted cells (Fig 1D and F). Furthermore, we confirmed that the majority of LAMP1‐positive organelles were filled with p62 upon treatment of control cells with a combination of AZD8055 and Bafilomycin A1, whereas a significant increase in empty luminal structures was detected in TMEM41B KO cells with p62 accumulating in close proximity (Fig 1G and H). The defect in autophagy cargo receptor turnover was also observed in HeLa cells and appears to be on‐target as expression of untagged or Myc‐tagged TMEM41B rescued changes in p62 and NDP52 in the TMEM41B KO cell populations (Fig EV1B and C). As a physiological autophagy cargo, we examined the fate of cytosolic Salmonella 20 and found that deletion of TMEM41B caused a robust replication advantage to Salmonella (Fig 1I), in line with their impaired lysosomal targeting and degradation.
Figure 1. Sensitized CRISPR screens identify TMEM41B as a novel regulator of autophagy.
-
ASchematic representation of pooled CRISPR screening workflow. H4 cells stably expressing Cas9 were transduced with a lentiviral sgRNA mini‐pool library, selected for stable integration, expanded, and treated for 24 h with the mTOR inhibitor AZD8055 (activated autophagy) or DMSO as vehicle control (basal autophagy). Endogenous p62 or NDP52 was visualized by immunostaining and cells separated by FACS into populations with high or low signal. Abundance of sgRNAs was quantified in cell populations by next‐generation sequencing.
-
B, CRelative abundance of sgRNAs in cell populations with high versus low signal was visualized as log2 fold chances for basal as well as activated autophagy conditions for (B) p62 or (C) NDP52. Entire data are reported in Dataset EV1.
-
D–FValidation of TMEM41B. H4 Cas9 cells were infected with sgRNAs targeting TMEM41B or a non‐targeting (NT) control, treated with 500 nM AZD8055, 50 nM Bafilomycin A1 (BafA1) or DMSO vehicle control for 24 h, and analyzed by immunoblotting. (E, F) p62 and NDP52 band intensities are depicted as total levels relative to vehicle control in H4 Cas9 NT cells (E), or as flux by calculating the ratio in BafA1‐treated cells versus vehicle control (F). Data are presented as mean ± SD (n = 6 independent experiments) with paired t‐test values.
-
GLAMP1 and p62 were co‐stained and imaged using an LSM700 confocal microscope. Arrowheads point at p62‐filled and empty LAMP1‐positive organelles. Scale bar: 5 μm.
-
HLAMP1‐positive organelles were manually quantified for containing a p62‐filled or empty lumen. A total of 50–60 LAMP1‐positive organelles were analyzed in each experiment. Data are presented as mean ± SD (n = 3 independent experiments) with paired t‐test values.
-
IHeLa cells were transduced with Cas9 and TMEM41B or NT sgRNAs followed by infection with luciferase‐expressing Salmonella typhimurium. Luciferase readings were taken up to 8.5 h post‐infection. Results from one representative experiment are presented as mean ± SD (n = 8 technical replicates).
Source data are available online for this figure.
Figure EV1. Rescue of TMEM41B KO with sgRNA‐resistant TMEM41B.
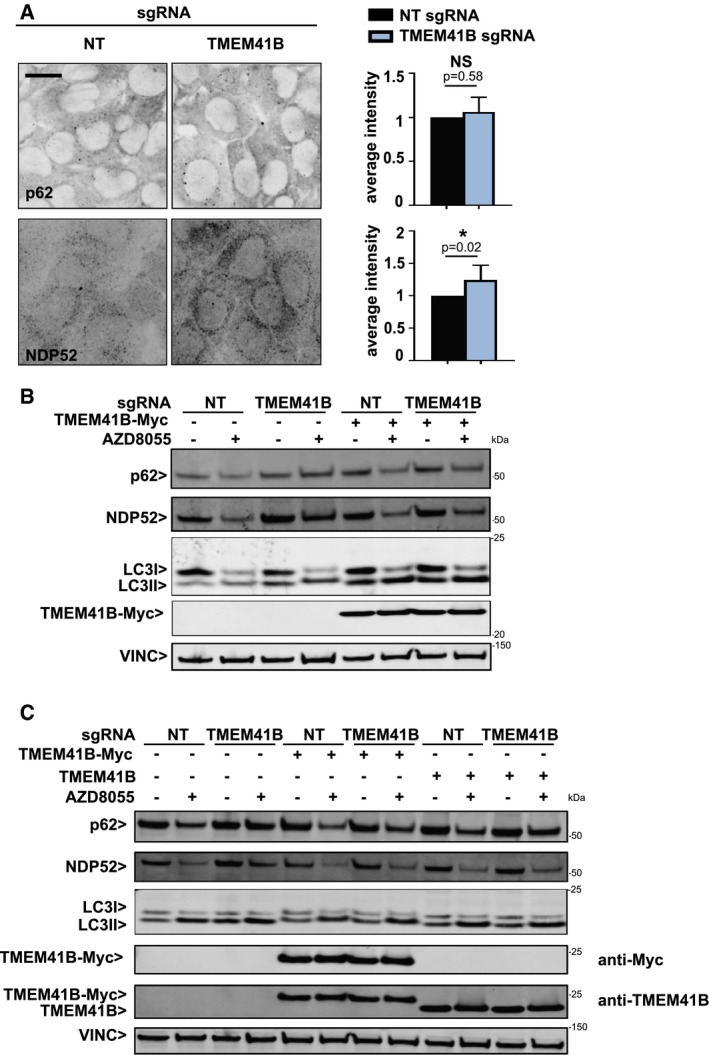
- H4 Cas9 TMEM41B KO and NT control cells were probed for p62 and NDP52 by immunostaining and imaged with an automated CV7000 confocal microscope. Scale bar: 20 μm. Staining intensity was quantified with ImageJ and depicted as mean ± SD (n = 4 independent experiments) with paired t‐test values.
- HeLa Cas9 cells were infected with sgRNAs targeting TMEM41B or NT control alongside lentiviruses expressing sgRNA‐resistant Myc‐tagged TMEM41B, treated with 500 nM AZD8055 or vehicle control for 24 h, and analyzed by immunoblotting 7 days post‐infection.
- H4 Cas9 cells were infected with sgRNAs targeting TMEM41B or NT control alongside lentiviruses expressing sgRNA‐resistant untagged or Myc‐tagged TMEM41B, treated with 500 nM AZD8055 or vehicle control for 24 h, and analyzed by immunoblotting 7 days post‐infection.
Source data are available online for this figure.
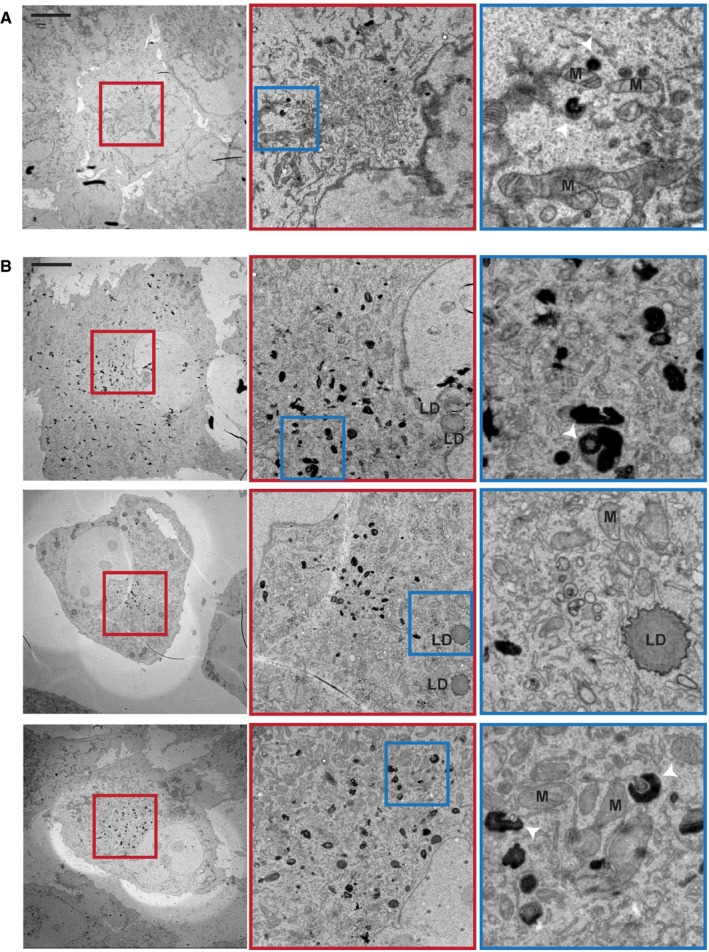
To investigate which step in the autophagic pathway is defective in TMEM41B KO cells, we analyzed LC3 as a marker for autophagosomal vesicles. TMEM41B‐deficient cells displayed a significant build‐up of lipidated LC3‐II by immunoblot (Fig 2A and B) and increased LC3 puncta by immunostaining (Fig 2C and D). The LC3 puncta robustly co‐localized with the PI(3)P effector protein WIPI2 (Fig 2E and F), which also accumulated as puncta in the absence of TMEM41B (Fig 2G). Furthermore, LC3 puncta co‐localized with RFP‐tagged DFCP1 (ZFYVE1; Fig 2H and I), another PI(3)P effector, which dynamically associates with forming autophagosomes 4. These data suggest that autophagy can be initiated in the absence of TMEM41B as evident by WIPI2 and DFCP1 being recruited and LC3 conjugated to isolation membranes, but that the process may stall and fail to efficiently form mature WIPI2‐ and DFCP1‐negative autophagosomes. In support of this notion, we saw a significant reduction in the number of autophagosomes accumulating in TMEM41B‐depleted cells when mCherry‐GFP‐tagged LC3 was monitored upon late‐stage autophagy inhibition with Bafilomycin A1 (Fig 2J). Furthermore, ultrastructural analysis of TMEM41B KO cells by transmission electron microscopy revealed the presence of electron‐dense structures, which had various shapes and were often found in close proximity to ER tubules (Fig EV2). These structures were virtually absent in H4 Cas9 cells and we hypothesize that they may represent accumulating isolation membranes. Noteworthy, Shoemaker et al independently identified TMEM41B as a novel autophagy regulator by CRISPR‐based screening of tandem fluorescent autophagy reporters and showed that accumulated LC3‐II remained largely trypsin‐sensitive in a protease protection assay of TMEM41B KO cell extracts [preprint: 21]. This is consistent with our data and suggests that TMEM41B is required to form mature and sealed autophagosomes.
Figure 2. Knockout of TMEM41B impairs autophagosome biogenesis.
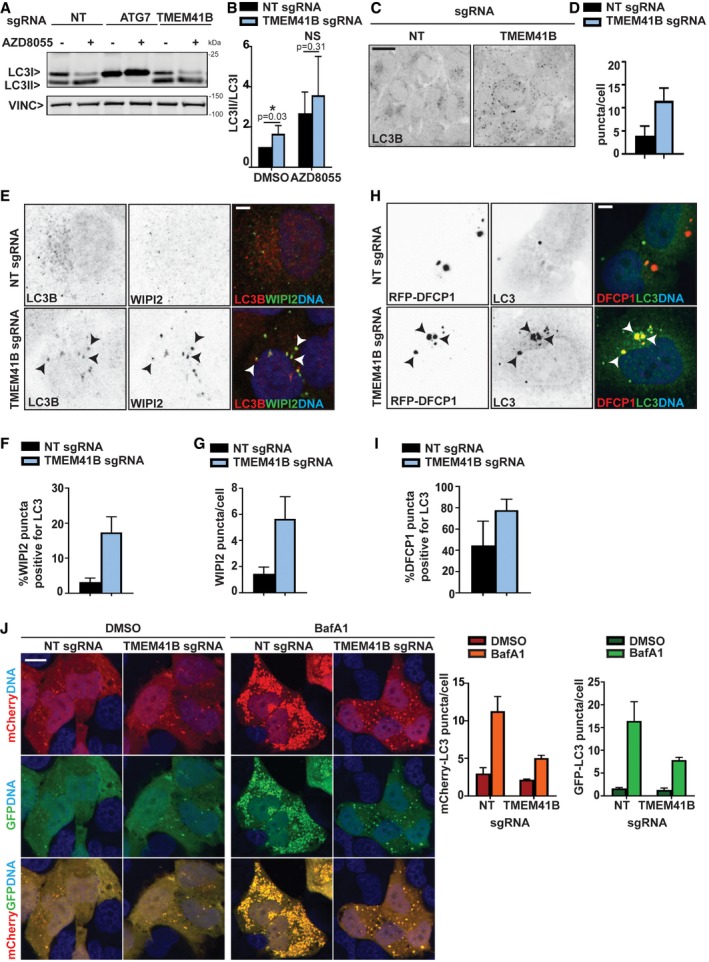
- H4 Cas9 cells were infected with sgRNAs targeting ATG7, TMEM41B or NT control, treated with 500 nM AZD8055 or vehicle control for 24 h, and analyzed by immunoblotting.
- Ratio of LC3‐II to LC3‐I band intensities is depicted as mean ± SD (n = 6 independent experiments) with Wilcoxon test values.
- H4 Cas9 TMEM41B and NT control cells were probed by LC3B immunostaining and imaged with an automated CV7000 confocal microscope. Scale bar: 20 μm.
- The number of LC3 puncta per cell was quantified using Yokogawa Analysis Software (YAS) and depicted as mean ± SD (n = 3 technical replicates).
- LC3 and WIPI2 were co‐stained and imaged using an LSM700 confocal microscope. Arrowheads point at co‐localized LC3 and WIPI2 puncta. Scale bar: 5 μm.
- The number of WIPI2 puncta positive for LC3 was quantified using ImageJ and depicted as mean ± SD (n = 5 technical replicates).
- The total number of WIPI2 puncta per cell was quantified using the Harmony software on images acquired with an automated Operetta microscope. Data are depicted as mean ± SD (n = 3 technical replicates).
- H4 Cas9 TMEM41B and NT control cells were infected with a RFP‐DFCP1 expression construct for 72 h, fixed, stained with LC3 antibodies, and imaged with an automated CV7000 confocal microscope. Arrowheads point at co‐localized LC3 and RFP‐DFCP1 puncta. Scale bar: 5 μm.
- The number of RFP‐DFCP1 puncta positive for LC3 was quantified using ImageJ and depicted as mean ± SD (n = 10 technical replicates).
- mCherry‐GFP‐LC3 was expressed in H4 Cas9 TMEM41B KO and NT control cells which were treated with 50 nM BafA1 or vehicle control for 24 h, fixed and imaged. Scale bar: 20 μm. The number of mCherry‐ and GFP‐positive puncta per cell was quantified using YAS and is depicted as mean ± SD (n = 3 technical replicates).
Source data are available online for this figure.
Figure EV2. Ultrastructural analysis of TMEM41B KO cells.
-
A, BH4 Cas9 (A) and H4 Cas9 TMEM41B KO clone 6 (B) cells were analyzed by transmission electron microscopy. Representative images are shown at the level of the entire cell, the juxtanuclear space as well as an inlet thereof. Mitochondria (M), lipid droplets (LD), and electron‐dense structures (white arrowheads) are indicated. Scale bar: 10 μm.
What is the underlying cause of the autophagy defect in TMEM41B KO cells? To tackle this question, we screened a panel of fluorescent probes and observed a striking accumulation of BODIPY 493, BODIPY FL C12, and NBD cholesterol probes in large puncta in TMEM41B‐depleted cells (Fig 3A). These probes visualize neutral lipids and cholesterol, key components of cellular lipid droplets (LDs) 22. The accumulation of neutral lipids and cholesterol appeared specific as fluorescent probes for other lipids such as sphingomyelin and ceramide were unchanged upon TMEM41B depletion, and organelle markers such as ER‐Tracker or LysoTracker looked intact (Fig EV3A). To better characterize a potential role of TMEM41B in regulating LDs, we analyzed H4 cells basally or upon treatment with BSA‐conjugated oleic acid by probing with HCS LipidTox Green Neutral Lipid Stain, a probe with high affinity for neutral LDs. TMEM41B‐depleted cells showed a significant increase in LDs both basally and upon oleic acid treatment (Fig 3B). LDs mainly increased in size and intensity, while the overall number was not significantly increased under basal conditions and rather decreased upon oleic acid treatment in TMEM41B KO cells (Fig 3C). LDs strongly co‐localized with ADRP (Perilipin‐2; Fig EV3B), a protein which coats the surface of LDs 23. Analysis of ADRP in TMEM41B‐depleted cells confirmed the increase in lipid droplets both by immunostaining (Fig 3D and E) and by Western blot (Fig 3F and G). Also our electron microscopy analysis showed enlarged LDs upon TMEM41B KO (Fig EV2B, LD). We conclude that TMEM41B‐deficient cells display enlarged LDs pointing to a potential role of TMEM41B in lipid mobilization, trafficking, and/or metabolism.
Figure 3. TMEM41B‐deficient cells display enlarged lipid droplets.
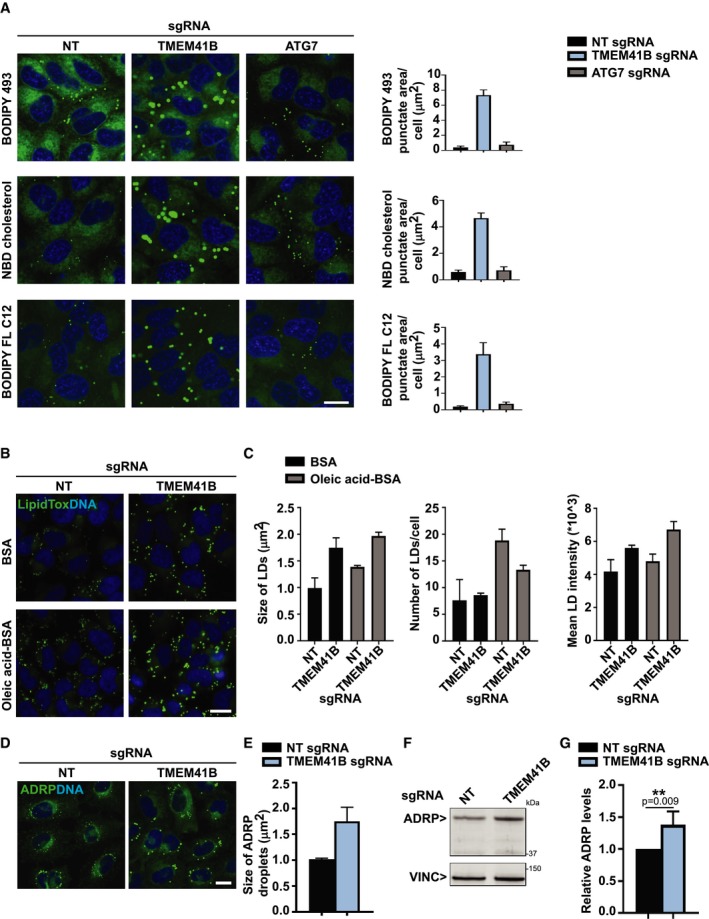
- H4 Cas9 cells stably expressing NT, TMEM41B, or ATG7 sgRNAs were stained with BODIPY 493, NBD cholesterol, or BODIPY FL C12 probes for 2 h at 37°C and imaged live with an automated CV7000 confocal microscope. Puncta area per cell was quantified using YAS and depicted as mean ± SD (n = 4 technical replicates). Scale bar: 20 μm.
- H4 Cas9 TMEM41B KO and NT control cells were treated overnight with 400 μM BSA‐conjugated oleic acid or 0.1% BSA as vehicle control, stained for 2 h with HCS LipidTox Green Neutral Lipid Stain, and imaged with an automated Operetta microscope. Scale bar: 20 μm.
- Lipid droplet size, number, and mean fluorescence intensity were quantified using Harmony software. Data are presented as mean ± SD (n = 3 technical replicates). An average of 1,500 cells was analyzed per replicate.
- H4 Cas9 TMEM41B KO and NT control cells were probed by ADRP immunostaining and imaged with an automated CV7000 confocal microscope. Scale bar: 20 μm.
- Size of ADRP droplets was quantified with YAS and depicted as mean ± SD (n = 3 technical replicates).
- Protein level of ADRP was probed by immunoblotting in H4 Cas9 TMEM41B KO and NT control cells.
- ADRP band intensities were quantified and depicted as mean ± SD (n = 4 independent experiments) with paired t‐test values.
Source data are available online for this figure.
Figure EV3. Analysis of additional lipid and organelle markers.
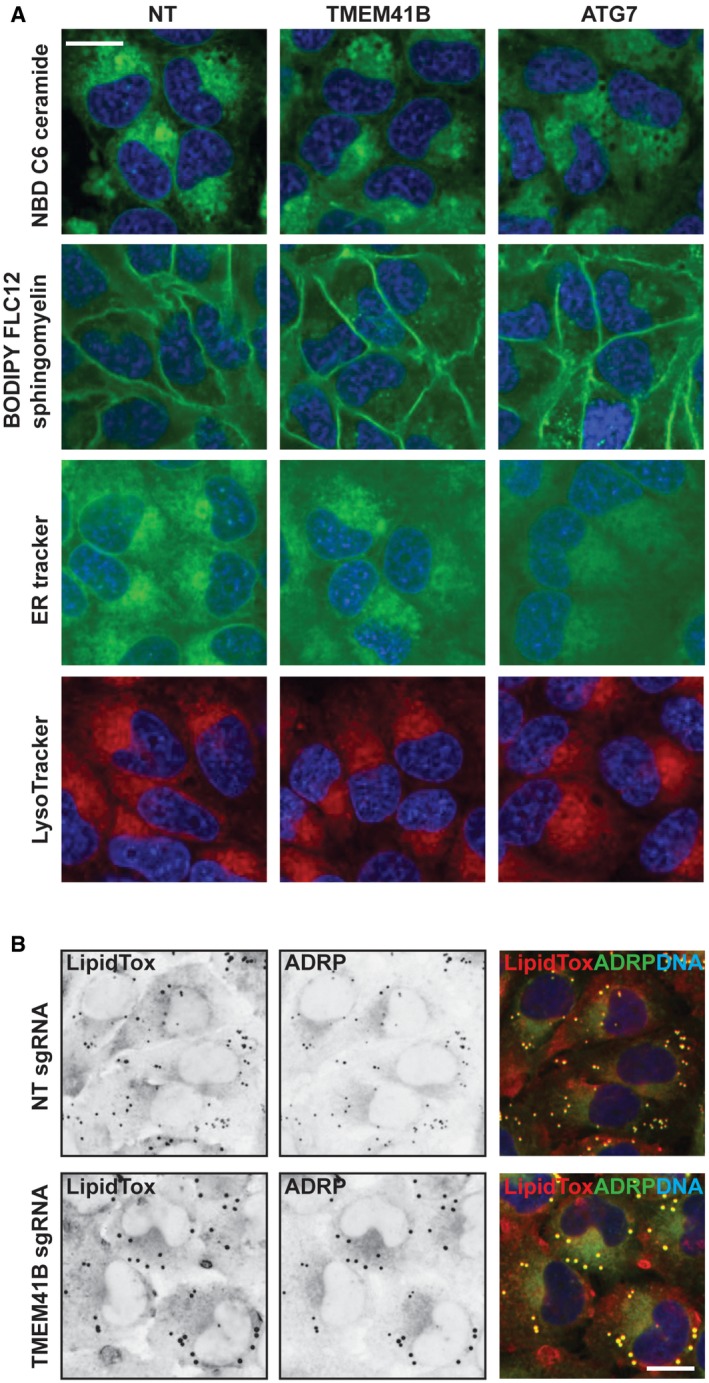
- H4 Cas9 TMEM41B KO, ATG7 KO, and NT control cells were stained with NBD C6 ceramide, BODIPY FL C12 sphingomyelin, ER‐Tracker, or LysoTracker probes. After 2 h incubation at 37°C, cells were imaged live with an automated CV7000 confocal microscope using a 60× objective. Representative images are shown, and scale bar represents 20 μm.
- H4 Cas9 TMEM41B KO and NT control cells were stained with ADRP antibodies and HCS LipidTox Deep Red Neutral Lipid Stain and imaged with an automated CV7000 confocal microscope. Representative images are shown, and scale bar represents 20 μm.
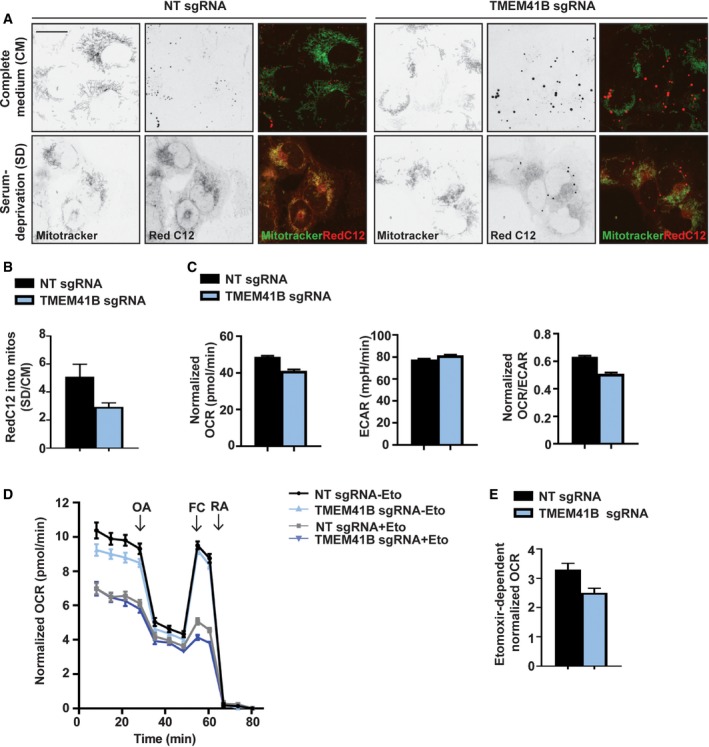
Lipid droplets constitute the primary storage site for fatty acids (FAs) and can be targeted for lysosomal breakdown via lipophagy, a process that has been shown to depend on autophagy core components such as ATG7 24. Since deletion of ATG7 did not result in a significant accumulation of BODIPY 493, BODIPY FL C12, and NBD cholesterol probes in H4 cells (Fig 3A), we looked into lipophagy‐independent processes. More recently, LDs have been shown to be mobilized and consumed for autophagy initiation in both yeast 13 and mammalian cells 25. Furthermore, cells mobilize FAs in LDs to produce ATP via mitochondrial β‐oxidation 26, 27, and enlarged lipid droplets have been linked to defective β‐oxidation in worms 28. To evaluate a role of TMEM41B in lipid mobilization, we assessed the flux of FAs from LDs to mitochondria by pulsing cells with a red fluorescent FA analog (Red C12) 27 and chased it in complete medium (CM) or upon serum deprivation (SD). In control cells, serum deprivation re‐localized the red fluorescent FA probe from LDs to mitochondria, while most of the Red C12 signal remained in LDs in TMEM41B KO cells and showed little overlap with mitochondria (Fig 4A). Quantification of Red C12 fluorescence intensity within the MitoTracker staining revealed a significant reduction in TMEM41B KO cells (Fig 4B), consistent with a role of TMEM41B in mobilizing lipids from LDs. We next assessed the metabolic capacity of TMEM41B‐depleted cells by Seahorse analysis. TMEM41B KO cells displayed a small but significant decrease in basal mitochondrial oxygen consumption, whereas extracellular acidification rates were increased (Fig 4C). These data suggest that TMEM41B‐depleted cells may have increased glycolysis to compensate for a defect in mitochondrial respiration. To more specifically evaluate the β‐oxidation of endogenous FAs, we used substrate‐limited medium and measured oxygen consumption in the presence or absence of etomoxir, which is an inhibitor of mitochondrial FA import by blocking carnitine palmitoyl transferase‐1 (CPT‐1) 29. This experimental setup confirmed the basal decrease in mitochondrial oxygen consumption in TMEM41B‐deficient cells and demonstrated that etomoxir abolishes the difference in oxygen consumption between TMEM41B KO and control cells (Fig 4D). By calculating etomoxir‐dependent oxygen consumption, we found that TMEM41B‐depleted cells display significantly lower endogenous FA utilization rates (Fig 4E). We propose that TMEM41B supports mobilization and mitochondrial β‐oxidation of fatty acids.
Figure 4. TMEM41B is required for mobilization and utilization of endogenous fatty acids.
-
AH4 Cas9 TMEM41B KO and NT control cells were pulsed with the fatty acid analog Red C12, chased in complete medium or upon serum deprivation, and stained with MitoTracker. Cells were imaged live with an automated CV7000 confocal microscope. Scale bar: 20 μm.
-
BFatty acid Red C12 intensity was measured within MitoTracker signal, and ratio between SD and CM conditions was calculated. Data are presented as mean ± SD (n = 3 technical replicates).
-
C–EH4 Cas9 TMEM41B KO and NT control cells were plated in XF96 plates and analyzed using a Seahorse Bioscience XF96. (C) Basal oxygen consumption rates (OCR) and extracellular acidification rates (ECAR) were measured in cells grown in complete medium. OCR/ECAR ratio is also reported. Data are presented as mean ± SEM (n = 30–32 technical replicates) from one representative experiment. (D) OCR was measured in cells grown in substrate‐limited medium and treated in the absence or presence of Etomoxir (Eto). Oligomycin (OA), FCCP (FC), and a mixture of rotenone and antimycin A (RA) were added as indicated. Data are shown as mean ± SEM (n = 69 technical replicates). (E) Endogenous FA utilization was calculated by subtracting basal normalized OCR values of Eto‐treated cells from untreated cells. Data are shown as mean ± SEM (n = 69 technical replicates).
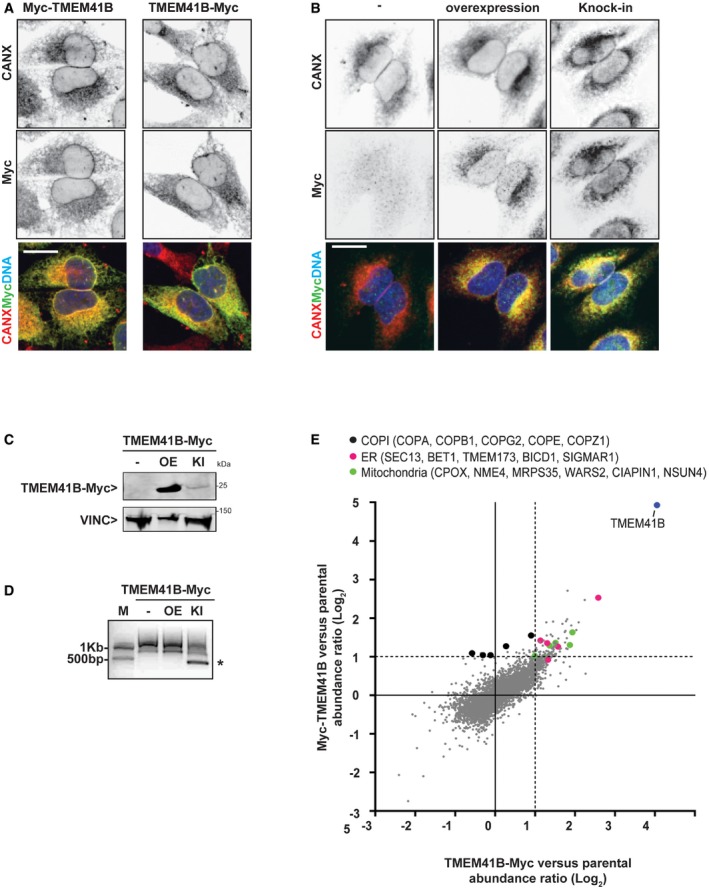
TMEM41B has six predicted transmembrane domains, but its intracellular localization has not been univocally determined. Expression and immunostaining of N‐ or C‐terminally Myc‐tagged TMEM41B showed a tubular pattern, which co‐localized with the ER marker calnexin (Fig 5A) and KDEL (Fig EV4B). An antibody directed against TMEM41B was unable to recognize the endogenous protein but confirmed a tubular ER pattern upon expression of untagged TMEM41B (Fig EV4A). To confirm that overexpression of TMEM41B does not perturb its intracellular localization, we tagged the endogenous TMEM41B locus with a C‐terminal Myc epitope by CRISPR and validated the knock‐in (KI) by immunoblot and genomic PCR (Fig 5B–D). This KI approach in HeLa cells confirmed that TMEM41B robustly co‐localizes with the ER marker calnexin (Fig 5B). TMEM41B has a predicted “SNARE‐associated Golgi protein” domain, which shares homology to bacterial DedA proteins 30, yeast TVP38, and mammalian TMEM41A, TMEM64, and VMP1 (IPR032816, 31). The homology to VMP1 is interesting as this ER‐localized transmembrane protein has been linked to the regulation of autophagy, LDs, and mitochondrial morphology 32, 33. Furthermore, VMP1 KO cells have also been shown to accumulate electron‐dense structures, believed to be immature autophagosomes 34, 35. We confirmed impaired autophagy and enlarged LDs in VMP1‐depleted H4 cells (Fig EV5A–C). While expression of TMEM41B‐Myc significantly reduced LD size in TMEM41B KO cells, we were unable to see rescue in VMP1‐deficient cells (Fig EV5B and C). These data suggest that TMEM41B may be functionally redundant to VMP1 in regulating LDs but cannot compensate for a loss in VMP1.
Figure 5. TMEM41B localizes to the ER .
-
AH4 Cas9 cells stably expressing N‐terminally (Myc‐TMEM41B) or C‐terminally Myc‐tagged TMEM41B (TMEM41B‐Myc) were probed by calnexin (CANX) and Myc tag immunostaining and imaged with an automated CV7000 confocal microscope. Scale bar: 20 μm.
-
B–DEndogenous TMEM41B locus was tagged with C‐terminal Myc using CRISPR‐directed homologous recombination in HeLa cells. HeLa knock‐in (KI) cells were compared to parental HeLa (−) and HeLa cells stably transduced with a TMEM41B‐Myc overexpression (OE) construct. (B) Confocal micrographs of cells stained with antibodies against CANX and Myc confirming ER localization of both KI and OE TMEM41B‐Myc. Scale bar represents 20 μm. (C) Immunoblot analysis confirming expression of both KI and OE TMEM41B‐Myc. (D) PCR analysis with primers binding to TMEM41B last intron and to Myc tag confirming successful targeting of the endogenous TMEM41B locus with Myc (band labeled with asterisk). M = size marker.
-
EH4 Cas9 cells and H4 Cas9 cells stably expressing Myc‐TMEM41B or TMEM41B‐Myc were lysed and subjected to anti‐Myc IP. Eluates were analyzed by mass spectrometry. Enrichment of proteins in IPs from Myc‐TMEM41B or TMEM41B‐Myc cells versus H4 Cas9 cells is depicted as log2 fold changes. Entire data are reported in Dataset EV2.
Source data are available online for this figure.
Figure EV4. Localization of untagged and Myc‐tagged TMEM41B.
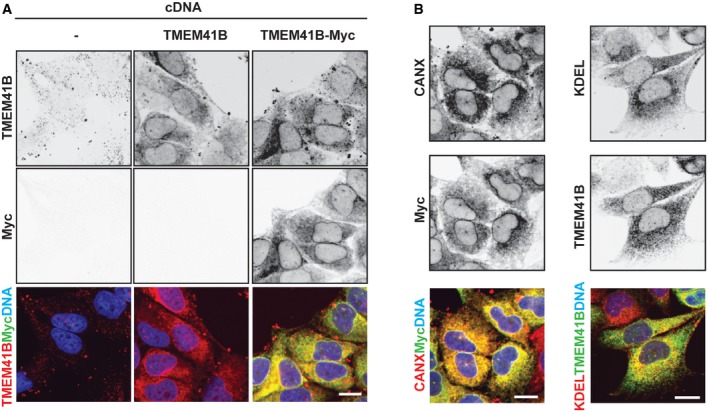
- H4 Cas9 cells were transduced with untagged or Myc‐tagged TMEM41B expression constructs, and stable cell populations were selected by antibiotics treatment. Cells were plated into a 96‐well plate, fixed, stained with antibodies directed against Myc epitope or TMEM41B, and imaged with an automated CV7000 confocal microscope. Note that the Myc signal appears virtually absent in untransduced cells (−) and for untagged TMEM41B as exposure settings were kept constant for all conditions. Scale bar: 20 μm.
- H4 Cas9 cells expressing C‐terminally Myc‐tagged TMEM41B were probed for Myc epitope, CANX, or KDEL and imaged with an automated CV7000 confocal microscope. Scale bar: 20 μm.
Figure EV5. Comparison of TMEM41B and VMP1 KO cells.
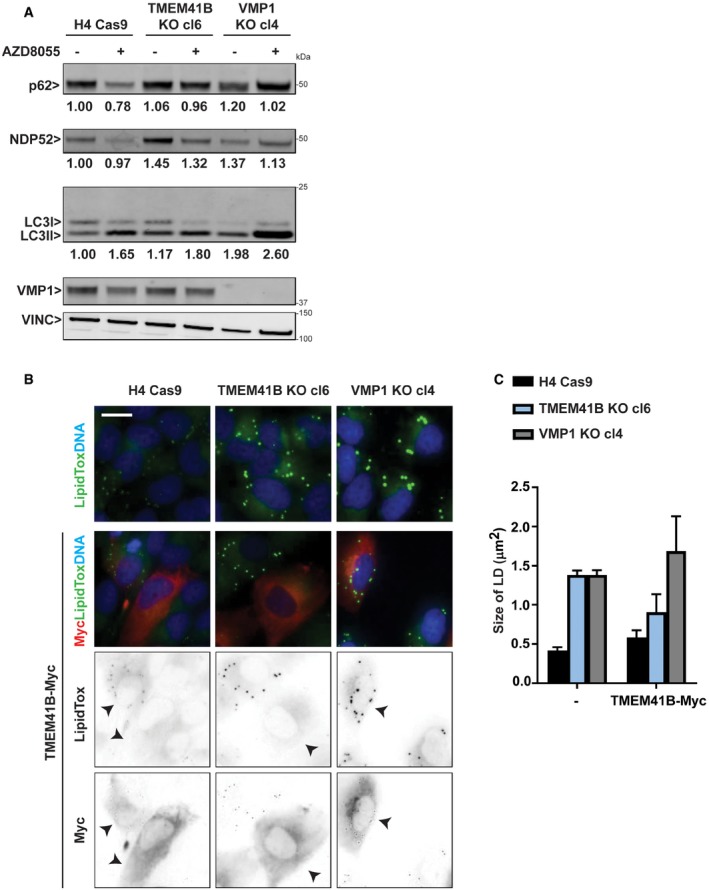
- H4 Cas9, H4 Cas9 TMEM41B KO clone 6, and H4 Cas9 VMP1 KO clone 4 cells were treated overnight with 500 nM AZD8055 or vehicle control and analyzed by immunoblot. Band intensities were quantified by ImageJ, and values from one experiment are depicted for p62, NDP52, and LC3‐II:I ratio.
- H4 Cas9, H4 Cas9 TMEM41B KO clone 6, and H4 Cas9 VMP1 KO clone 4 cells were infected with TMEM41B‐Myc lentivirus as indicated, fixed 72 h post‐infection, and stained with HCS LipidTox Green Neutral Lipid Stain and anti‐Myc antibodies. Cells were imaged on an automated Operetta microscope. Representative images are shown, and scale bar represents 20 μm. Arrowheads indicate Myc‐positive cells.
- Lipid droplet size was quantified using Harmony software. For infected condition, only Myc‐positive cells were included in the analysis. Data are depicted as mean ± SD (n = 3 technical replicates).
Source data are available online for this figure.
To further characterize TMEM41B, we performed interaction proteomics upon anti‐Myc immunoprecipitation in H4 Cas9 cells expressing N‐ or C‐terminally tagged TMEM41B (Dataset EV2). As expected, TMEM41B was identified as the most highly enriched protein in Myc‐TMEM41B or TMEM41B‐Myc expressing cells when compared to parental H4 Cas9 cells (Fig 5E). Consistent with the ER localization of TMEM41B, we identified several COPI components (COPA, COPB1, COPG2, COPE, COPZ1, Fig 5E, black dots) and the KQKFE C‐terminal amino acid sequence in TMEM41B matches the di‐lysin‐based ER retention motif K(X)KXX 36, 37. Since COPI components were particularly enriched in the N‐terminally tagged Myc‐TMEM41B samples, C‐terminal Myc may mask the di‐lysin‐based motif and interaction with COPI. Our proteomic study identified additional ER and Golgi proteins enriched more than twofold upon TMEM41B immunoprecipitation, including SEC13, BET1, TMEM173, BICD1, and SIGMAR1 (Fig 5E, pink dots). The ER transmembrane protein SIGMAR1 (Sigma Non‐Opioid Intracellular Receptor 1) is an interesting candidate as it is mutated in juvenile forms of amyotrophic lateral sclerosis (ALS) 38, 39 and has been shown to localize to ER‐LD and ER‐mitochondria contact sites where it regulates the transfer of lipids and calcium 40, 41. Furthermore, several mitochondrial proteins (CPOX, NME4, MRPS35, WARS2, CIAPIN1, NSUN4) were detected as TMEM41B interactors (Fig 5E, green dots). Taken together, these interaction proteomics data support an ER localization for TMEM41B, and future studies will be directed toward exploring a potential role at ER contact sites.
In summary, this study identifies TMEM41B as a novel ER transmembrane protein required for the regulation of autophagy initiation and lipid mobilization. In the absence of TMEM41B, biogenesis of autophagosomes is reduced, which consequently compromises the lysosomal delivery of autophagy cargo receptors and their cargo such as intracellular bacteria (Figs 1 and 2). The discovery of TMEM41B highlights how autophagy CRISPR screens can identify rate‐limiting nodes by sensitizing the pathway and monitoring different autophagy cargo receptors. In addition to defective autophagy, TMEM41B‐deficient cells display enlarged LDs and impaired mobilization and mitochondrial β‐oxidation of fatty acids (Figs 3 and 4). We suggest that enlarged LDs in TMEM41B‐deficient cells are not a simple consequence of impaired lipophagy or autophagosome biogenesis as it is not phenocopied by ATG7 KO. One possibility is that TMEM41B depletion causes a cellular defect, which independently impairs autophagy and lipid mobilization. Another possibility is that compromised lipid mobilization is the primary defect in TMEM41B‐depleted cells, which consequently reduces the capacity to form autophagosomes. Consistent with this model, lipid droplets have been shown to be consumed upon autophagy induction not only as substrates for lipophagy, but to provide lipid precursors for nascent autophagosomes 25, 42. Such a model may explain why LC3‐, WIPI2‐, and DFCP1‐positive isolation membranes form but fail to efficiently mature into autophagosomes. Depletion of TMEM41B does not completely block autophagic flux in H4 cells, and defective clearance of the autophagy cargo receptor p62 is only evident when autophagy is induced (Fig 1D). Interestingly, levels of the autophagy cargo receptors NDP52 and TAX1BP1 16 are already basally increased upon TMEM41B KO, whereas levels of GFP‐tagged p62 were reduced 15. We hypothesize that autophagy cargo receptors differ in their inherent ability to be recruited into autophagosomes, and their self‐oligomerization properties may be an important determinant 43.
With our initial characterization of TMEM41B, we identify a new candidate to better understand the link between autophagy and lipid droplets, including a potential role in spinal muscular atrophy where aberrantly spliced TMEM41B has been identified 44.
Materials and Methods
Reagents
The following chemical reagents were used: AZD8055 (ChemieTek), Bafilomycin A1 (Sigma), DMSO (Sigma), BSA‐conjugated oleic acid (Sigma), BSA (Sigma), oligomycin A (Sigma), FCCP (carbonylcyanide‐p‐(trifluoromethoxy)‐phenylhydrazone, Sigma), rotenone (Sigma), antimycin A (Sigma), and (+) – Etomoxir sodium salt hydrate (Sigma).
The following sgRNAs were used: non‐targeting (NT): GTAGCGAACGTGTCCGGCGT, TMEM41B: TATGAAGGTTCCCAGAGATA, ATG7: GCTGCCAGCTCGCTTAACAT, and VMP1: AAAGGCAGAATATTGTCCTG.
The following primary antibodies were used: rabbit anti‐ADRP (Proteintech, 15294‐1‐AP; 1:1,000 WB, 1:200 IF), mouse anti‐KDEL 10C3 (Enzo, ADI‐SPA‐827‐D; 1:700 IF), mouse anti‐SQSTM1 (BD Transduction Laboratories, 610833; 1:1,000 WB), rabbit anti‐SQSTM1 (Cell Signaling Technology, 7695; 1:400 IF), rabbit anti‐NDP52 (Abcam, ab68588; 1:1,000 WB, 1:100 IF), rabbit anti‐LC3B (Novus Biologicals, NB100‐2220; 1:1,000 WB), rabbit anti‐LC3B (MBL, PM036; 1:500 IF), mouse anti‐Vinculin (Sigma, V9131; 1:5,000 WB), rabbit anti‐Calnexin (Cell Signaling Technology, 2679; 1:1,000 WB, 1:100 IF), mouse anti‐WIPI2 (Abcam, ab105459; 1:250 IF), mouse anti‐LAMP1 (Cell Signaling Technology, 15665S; 1:100 IF), mouse anti‐Myc (Cell Signaling Technology, 2276; 1:1,000 WB, 1:4,000 IF), rabbit anti‐VMP1 (Merck Millipore, ABC66; 1:1,000 WB, 1:250 IF), and rabbit anti‐TMEM41B (Sigma, HPA014946; 1:250 WB, 1:100 IF). The following secondary antibodies were used in this study: goat anti‐rabbit Alexa 488 (Thermo Fisher Scientific, A1108; 1:1,000 FACS), goat anti‐mouse Alexa 488 (Thermo Fisher Scientific, A1101; 1:1,000 FACS), donkey anti‐rabbit IRDye 800‐CW (Odyssey, 926‐32213; 1:5,000 WB), donkey anti‐mouse Alexa Fluor 680 (Thermo Fisher Scientific, A10038; 1:10,000 WB), donkey anti‐rabbit Alexa Fluor 488 (Thermo Fisher Scientific, A21206; 1:1,000 IF), donkey anti‐mouse Alexa Fluor 488 (Thermo Fisher Scientific, A21202; 1:1,000 IF), donkey anti‐rabbit Alexa Fluor 546 (Thermo Fisher Scientific, A10040; 1:1,000 IF), and donkey anti‐rabbit Alexa Fluor 647 (Thermo Fisher Scientific, A31573; 1:1,000 IF). For DNA staining, Hoechst 33342 (Thermo Fisher Scientific, H3570) was used at dilution of 1:1,000.
The following plasmids were used: pLenti6.3‐mCherry‐GFP‐LC3B construct was previously described 15. TMEM41B cDNA (RefSeq 440026) with a C‐terminal Myc tag was custom synthesized at VectorBuilder in pLenti‐CAG. The cDNA was codon‐optimized in order to render it sgRNA‐resistant. N‐terminally Myc‐tagged and untagged TMEM41B were generated by PCR amplification and subcloning into BamHI/SalI restriction sites of pLenti‐CAG vector. DFCP1 cDNA (RefSeq 53349) with an N‐terminal RFP tag was custom synthesized at VectorBuilder in pLenti‐EF1A. Cas9 was expressed from pNGx‐LV‐c004 15, while sgRNAs were expressed from pNGx‐LV‐g003 15 or pNGx‐LV‐gc006 16.
Mammalian cell culture
H4 and HeLa cells (ATCC) were verified by SNP analysis and confirmed to be mycoplasma‐free. Cells were cultured in a humidified incubator at 37°C and 5% CO2. Cells were grown in Dulbecco's modified Eagle's medium (DMEM) supplemented with 10% fetal bovine serum, 1% l‐glutamine, and 1% penicillin/streptomycin. Cell culture reagents were obtained from Invitrogen.
For transfection experiments, Fugene HD Transfection Reagent (Promega) was used according to manufacturer's protocol.
For transduction studies, lentiviral particles were generated in HEK293T cells. 106 cells were plated in a 6‐well plate and transfected 24 h later with 700 ng lentiviral vector, 700 ng PLP1, 200 ng PLP2, 200 ng VSV‐G plasmids (Invitrogen), and 7 μl Lipofectamine (Invitrogen). Lentivirus‐containing supernatants were collected after 48 h and filtered using a 0.45 μm filter (Millipore). Target cells were seeded at 2.5 × 10⁵ cells/well in a 6‐well plate, infected with 100 μl of virus supernatant in medium containing 5 μg/ml polybrene, and selected after 24 h with the appropriate antibiotics.
H4 Cas9 and HeLa Cas9 cells were generated by lentiviral delivery of Cas9 in pNGx‐LV‐c004 15 followed by selection with 5 μg/ml blasticidin. Single clones were selected based on Cas9 expression levels. H4 Cas9 clone 4 15 was used for the mini‐pool CRISPR screen. H4 Cas9 clone 7 and HeLa Cas9 clone 4 were used for validation studies. TMEM41B‐overexpressing cells were generated by lentiviral delivery of pLenti‐CAG‐TMEM41B vectors followed by selection with 600 μg/ml neomycin. KO cell lines were generated by lentiviral delivery of sgRNAs in pNGx‐LV‐g003 followed by selection with 1 μg/ml puromycin. KO cell populations were analyzed 7 days post‐infection with sgRNAs unless otherwise indicated in the text. Clonal VMP1 KO or TMEM41B KO lines were isolated by serial dilution, validated by TIDE assay, and used for data in Figs EV2 and EV5. H4 Cas9 ATG7 clonal KO cells were previously described 16.
CRISPR screen
The mini‐pool sgRNA library has been described previously 15. Lentiviral infection, cell expansion, FACS‐based cell isolation, genomic DNA isolation, sequencing, and data analysis were done as described previously 15. In this study, the screen was sensitized by treating cells with either 500 nM AZD8055 or 0.1% DMSO as vehicle control for 24 h before FACS analysis. Endogenous p62 and NDP52 were detected using mouse anti‐SQSTM1 (BD Transduction Laboratories, 610833; 1:500 FACS) or rabbit anti‐NDP52 (Cell Signaling Technology, 9036; 1:250 FACS), respectively.
TIDE assay
TIDE assay 19 was used to assess editing efficiency. Genomic DNA was extracted with the DNeasy Blood & Tissue Kit (Qiagen) according to manufacturer's instruction. 100 ng of genomic DNA was used in a PCR reaction using GoTaq polymerase (Promega) and primers surrounding the sgRNA targeting region. Primers used for amplification of edited TMEM41B locus were FW: GGGCAACAGAGCAAGACTC (forward) and AAGCACCCACAGCTAAGCAG (reverse).
Immunoblotting
Cells were lysed in RIPA buffer (Thermo Fisher Scientific) supplemented with protease inhibitor cocktail (Sigma) followed by sonication. Protein concentration was determined with the Pierce BCA protein assay kit (Thermo Fisher Scientific). Samples were mixed with NuPAGE LDS sample buffer containing NuPAGE sample reducing agent, denatured for 10 min at 70°C, and loaded onto NuPAGE Novex 4–12% Bis‐Tris protein gels (Invitrogen). Proteins were transferred for 1 h to PVDF membranes using a wet‐blotting system. After blocking for 1 h in Odyssey blocking buffer (Odyssey), membranes were incubated overnight at 4°C with primary antibodies in Odyssey blocking buffer supplemented with 0.1% Tween‐20 (Bio‐Rad). Secondary antibodies were diluted in Odyssey blocking buffer supplemented with 0.1% Tween‐20 and incubated with membranes for 1 h at room temperature. Proteins were visualized using Odyssey infrared imaging system. Band intensities were quantified using ImageJ and normalized to vinculin as loading control.
Immunofluorescence
Cells were grown in 96‐well glass bottom, black wall plates (GreinerOne) for at least 24 h before fixation in either −20°C methanol or 4% paraformaldehyde. Cells were permeabilized and blocked for 1 h at room temperature in PBS containing 0.1% Triton X (Bio‐Rad) and 2% BSA (Sigma). Primary antibodies were added overnight at 4°C in blocking buffer. After washing plates with PBS, secondary Alexa‐conjugated antibodies and Hoechst dye were diluted in blocking buffer and applied for 1 h at room temperature. For lipid droplet stain, cells were fixed with 4% PFA in the presence of Hoechst dye, washed in PBS, and incubated with 1:250 HCS LipidTox Green Neutral Lipid Stain (Thermo Fisher Scientific, H34475) or HCS LipidTox Deep Red Neutral Lipid Stain (Thermo Fisher Scientific, H34477) for 2 h at room temperature and imaged without washing. Where LipidTox was combined with antibody staining, Triton X was omitted at all steps and cells were permeabilized in 10 μg/ml digitonin (Sigma) for 15 min at room temperature. Cells were imaged with the following microscopes as specified in the text: Cell Voyager 7000 (CV7000, Yokogawa Electric Corporation) with a 40× or 60× objective, Operetta microplate reader (Perkin Elmer) with a 40× objective, or laser scanning confocal microscope LSM700 (Zeiss) with a 63× objective. Images were processed and analyzed using ZEN 2011 (Zeiss) and Harmony (Perkin Elmer) software. Immunofluorescence quantitation was performed manually (Fig 1G and H) or using the Spot Analysis RMS of the Harmony software, Yokogawa Analysis Software (YAS), ImageJ or Cell Profiler 45 as specified in the text. Co‐localization was assessed using the ComDet v.0.3.3 plugin in ImageJ.
Salmonella typhimurium replication assay
HeLa cells were transduced with lentivirus expressing Cas9 and TMEM41B or NT sgRNAs. After puromycin selection, 104 cells were seeded per well in clear‐bottom 96‐well plates (Corning) for the Salmonella replication assay. Salmonella typhimurium enterica serovar Typhimurium SL 1344 expressing luciferase was grown overnight from a single colony in Luria broth at 37°C. Bacteria were sub‐cultured for 4 h until late log phase, when the culture was diluted 1:100 in complete IMDM containing 10% FBS. Cells were infected with bacteria for 30 min and then rinsed twice with complete IMDM containing 50 μg/ml gentamycin. After 1 h, media was replaced with complete IMDM containing 20 μg/ml gentamycin, and the first luciferase reading was taken. Luciferase readings were taken every hour from 1.5 to 8.5 h post‐infection.
mCherry‐GFP‐LC3 flux experiment
H4 Cas9 cells were infected with TMEM41B or NT sgRNAs. One week post‐infection, cells were re‐plated in 96‐well glass bottom, black wall plates and infected with mCherry‐GFP‐LC3 lentiviral particles. After 48 h, cells were treated with Bafilomycin A1 or vehicle control for 24 h, fixed in 4% paraformaldehyde in the presence of Hoechst dye, washed in PBS, and imaged with the 60× objective of a CV7000 automated confocal microscope. The number of mCherry‐LC3 and GFP‐LC3 puncta was assessed using Yokogawa Analysis Software.
Electron microscopy
H4 Cas9 and H4 Cas9 TMEM41B KO clone 6 cells were grown overnight on Thermanox coverslips (Nunc). Cells were fixed with 2.5% glutaraldehyde and 2% paraformaldehyde in 0.1 M cacodylate buffer (pH 7.4) incubated for 1 h at room temperature and then overnight at 4°C. After five washes in 0.1 M cacodylate buffer (pH 7.4), a post‐fixation in 1.5% potassium ferrocyanide and 1% osmium tetroxide in 0.1 M cacodylate buffer (pH7.4) was done. After 1 h, the solution was exchanged with 1% osmium in 0.1 M cacodylate buffer (pH 7.4) for 1 h. Cells were then washed in ddH2O and stained with 1% uranyl acetate (EMS) in ddH2O for 30 min. After dehydration steps in graded alcohol series, cells were flat‐embedded in Epon resin (Serva) for 12 h. Coverslips were detached from resin after curing using repetitive throwing in liquid nitrogen. For transmission electron microscopy (TEM) analysis, a region of interest containing cells was selected under light. After trimming, silver/gray thin sections (60 nm thickness) were collected on formvar‐coated single‐slot copper grids (EMS). After post‐staining with 1% uranyl acetate and lead citrate (5 min each), images were recorded using a FEI Tecnai Spirit (FEI Company) operated at 80 kV using a side‐mounted 2K × 2K CCD camera (Veleta, Olympus).
Fluorescent probes screen
H4 Cas9 cells stably expressing NT, TMEM41B, or ATG7 sgRNAs, were seeded at 3.5 × 10³ cells per well onto assay plates (Perkin Elmer CellCarrier 384‐well microplates) in 40 μl growth media. A panel of fluorescent chemical probes was obtained from Thermo Fisher Scientific and plated into source plates (Greiner bio‐one 384‐well microplates) in DMSO. The panel of probes includes BODIPY 493/503 (D3922), NBD cholesterol (N1148), BODIPY FL C12 (D3822), NBD C6‐ceramide (N1154), BODIPY FL C12‐sphingomyelin (D7711), ER‐Tracker Green (E34251), and LysoTracker Deep Red (L12492). Probes were transferred from the source plates into the assay plates by acoustic transfer of 200 nl, and Hoechst nuclear stain was added to the assay plates in 2 μl DMEM using Multidrop Combi (Thermo Fisher Scientific, Model# 836). After 2 h incubation at 37°C, cells were imaged live at 60× objective magnification on a CV7000 automated confocal microscope. Images were quantified using Yokogawa Analysis Software.
Fluorescent fatty acid pulse and chase
H4 Cas9 NT or TMEM41B KO cells were seeded in 96‐well glass bottom, black wall plates in complete medium (CM, DMEM with 10% fetal bovine serum and 1% l‐glutamine). Twenty‐four hours after seeding, cells were pulsed in CM containing 1 μM BODIPY 558/568 C12 (Red C12, Thermo Fisher Scientific, D3835) for 16 h 27. Cells were then washed three times with CM, incubated for 1 h, and then chased for 24 h in CM or serum‐deprived medium. Mitochondria were labeled with 100 nM MitoTracker Green FM (Thermo Fisher Scientific, M7514) for 30 min prior to imaging. Image analysis was performed using Cell Profiler. A mask was generated using the green mitochondrial signal, and average red fluorescence intensity was measured within the mitochondrial mask.
Seahorse measurement
Oxygen consumption and glycolytic rates were measured on a Seahorse Bioscience XF96 analyzer (Agilent) as recommended by the manufacturer's instructions. Briefly, 2 × 10⁴ cells were seeded per well in a XF96 plate the day prior measurement. For the measurement, cells were washed and incubated in non‐buffered DMEM containing 1 mM pyruvate, 25 mM glucose, 1× Glutamax with pH adjusted to 7.4. Oxygen consumption rates (OCR) and extracellular acidification rates (ECAR) were first measured five times before sequential injection of oligomycin A (final concentration of 1 μg/ml), FCCP (final concentration of 2 μM), and a mixture of rotenone (final concentration of 1 μM) and antimycin A (final concentration of 1 μg/ml) to measure uncoupled respiration, spare respiratory capacity, and non‐mitochondrial respiration, respectively. All OCR values were normalized by subtracting the average of the non‐mitochondrial respiration values. The metabolic phenotype was then expressed as basal OCR, basal ECAR, or the ratio thereof.
For endogenous fatty acid oxidation (FAO) analysis, conditions were adjusted as follows: 104 cells were seeded per well in a XF96 plate 2 days prior measurement. Cells were starved in substrate‐limited medium (DMEM containing 0.5 mM glucose, 1 mM GlutaMax, 0.5 mM carnitine, and 1% FBS) the day before measurement. 1 h before measurement, cells were incubated with FAO assay medium (111 mM NaCl, 4.7 mM KCl, 1.25 mM NaH2PO4, 2.5 mM glucose, 0.5 mM carnitine, 5 mM HEPES, pH 7.4 at 37°C). Where indicated, Etomoxir was added at 40 μM final concentration 15 min before measurement.
CRISPR knock‐in of C‐terminal Myc tag
Homologous recombination (HR) template including a neomycin resistance cassette was custom synthesized at Genewiz and linearized by PCR amplification and purification. sgRNA duplex was prepared by mixing 30 pmol of tracRNA (Alt‐R CRISPR‐Cas9 tracrRNA from IDT) and 30 pmol crRNA (ATCACCATCTCAGGATTAAC) in IDT duplex buffer, heating at 95°C followed by slow cool‐down. 30 pmol of sgRNA duplex was mixed with 30 pmol Cas9 protein (PNA Bio) and 3 pmol of linearized HR template, followed by incubation on ice for 20 min. This mix was added to 105 cells resuspended in 5 μl of Neon Buffer R (Invitrogen). Electroporation was performed with the Neon transfection system (Invitrogen) using 10 μl tips and the following parameters: pulse voltage 1,005 v, pulse width 35 ms, pulse number 2. Cells were then transferred to a 12‐well plate in antibiotic‐free medium and let recover for 72 h. Cells were then selected with 600 μg/ml neomycin for 2 weeks before analysis. Knock‐in of Myc tag into TMEM41B locus was confirmed by immunoblot using anti‐Myc antibodies as well as by genomic PCR using primers binding to TMEM41B last intron and to the Myc tag (FW: CAACAAGAGCGAAACTCCGTCTC, RV: CAGATCCTCTTCTGAGATGAG).
Immunoprecipitation and mass spectrometry
107 H4 Cas9 cells or H4 Cas9 cells stably expressing TMEM41B‐Myc or Myc‐TMEM41B were seeded in 3 × 15 cm dishes. Cells were harvested 48 h after seeding in lysis buffer (50 mM Tris–HCl pH 8, 150 mM NaCl, 1 mM EDTA, 1% Triton X) using protease inhibitor cocktail (Sigma). Lysates were kept on ice for 30 min and then centrifuged at 15,682 g for 10 min at 4°C. 2 mg of supernatant was used for immunoprecipitation (IP) using Myc‐Trap_MA (Chromotek) magnetic beads following manufacturer's protocol. Beads were boiled in 2× Laemmli buffer (Sigma), and eluates were used for mass spectrometry. For identification of TMEM41B‐interacting proteins by mass spectrometry, IP eluates were separated by SDS gel. Each gel lane was excised in 16 bands and digested overnight with trypsin (Promega) as described 46. Dried peptides were then labeled with TMT reagent (Thermo Fisher Scientific). Reagents 129, 130, and 131 were used for the corresponding H4 Cas9, H4 Cas9 Myc‐TMEM41B, and H4 Cas9 TMEM41B‐Myc conditions. Afterward, peptides from corresponding gel bands were pooled into 16 TMT peptide mixtures and analyzed by LC‐MS. Labeled peptides were loaded onto a 25 cm × 75 μm (ID) Acclaim PepMap EASY‐Spray LC column (Thermo Fisher Scientific) by an EASY‐nLC 1200 system. The peptides were separated using a 100 min gradient from 3 to 35% buffer B (80% acetonitrile + 0.1% formic acid) equilibrated with buffer A (0.1% formic acid) at a flow rate of 300 nl/min. Eluted TMT peptides were analyzed on an Orbitrap Fusion Lumos mass spectrometer. MS1 scans were acquired at resolution 120,000 with 350–1,500 m/z scan range, AGC target 2 × 10⁵, maximum injection time 50 ms. Then, MS2 precursors were isolated using the quadrupole (0.7 m/z window) with AGC 1 × 10⁴ and maximum injection time 50 ms. Precursors were fragmented by CID at a normalized collision energy (NCE) of 35% and analyzed in the ion trap. Following MS2, synchronous precursor selection (SPS) MS3 scans were collected and fragmented by high‐energy collision‐induced dissociation (HCD) and analyzed using Orbitrap (NCE65, max AGC 1 × 10⁵, maximum injection time 120 ms, resolution 60,000). Protein identification and quantification were performed using Proteome Discoverer 2.1.0.81 with the SEQUEST algorithm and Uniprot human database. Precursor mass tolerance was set at 10 ppm and at 0.6 Da for fragment mass tolerance. Maximum of three missed cleavages were allowed. Methionine oxidation was set as dynamic modification, while TMT tags on peptide N termini/lysine residues and cysteine alkylation (+57.02146) were set as static modifications. The list of protein identified and quantified by proteome discoverer is included as Dataset EV2. Proteins were adjusted to a 1% false discovery rate with a minimum of two peptide‐spectrum matches (PSMs).
Statistical analysis
Statistical significance was assessed using GraphPad Prism 6. Where required, normality of distributions was assessed with a Shapiro–Wilk test. All t‐tests performed were two‐sided. For immunoblots shown in Figs 1E and 3G and immunofluorescence shown in Fig EV1A, t‐test was performed on raw intensity values.
Data availability
The mass spectrometry proteomics data from this publication have been deposited to the ProteomeXchange Consortium via the PRIDE 47 partner repository with the dataset identifier PXD010207.
Author contributions
FM, PB, and JMG conception and design, acquisition of data, analysis and interpretation of data, and drafting or revising the article; SD, DM, RD, ZK, DBe, and AG acquisition, analysis, and interpretation of data; IC acquisition and analysis of data; JSR‐H, CR, ZY, GRH, CA, DBo, and CG analysis and interpretation of data; MM interpretation of data; LOM, RJX, and BN conception and design, analysis and interpretation of data, drafting or revising the article.
Conflict of interest
F.M., P.B., D.M., R.D, I.C., Z.K., C.A., D.Be., D. Bo., J.S.R.‐H., C.R, Z.Y. G.R.H., M.M., and B.N. are employees of Novartis. The authors declare that they have no conflict of interest.
Supporting information
Expanded View Figures PDF
Dataset EV1
Dataset EV2
Source Data for Expanded View
Review Process File
Source Data for Figure 1
Source Data for Figure 2
Source Data for Figure 3
Source Data for Figure 5
Acknowledgements
We thank Mitchel Germain, Alicia Lindeman, John Alford, ShaoJian An, and Dominic Trojer for technical support. We also thank Marek Kobylarz for critically reading the manuscript and providing feedback. Research in R.J.X.'s laboratory was funded by NIH grants U19AI109725, DK117263, DK043351, and Helmsley Charitable Trust.
EMBO Reports (2018) 19: e45889
See also: https://doi.org/10.15252/embr.201846858 (September 2018)
References
- 1. Jiang P, Mizushima N (2014) Autophagy and human diseases. Cell Res 24: 69–79 [DOI] [PMC free article] [PubMed] [Google Scholar]
- 2. He C, Klionsky DJ (2009) Regulation mechanisms and signaling pathways of autophagy. Annu Rev Genet 43: 67–93 [DOI] [PMC free article] [PubMed] [Google Scholar]
- 3. Jung CH, Ro SH, Cao J, Otto NM, Kim DH (2010) mTOR regulation of autophagy. FEBS Lett 584: 1287–1295 [DOI] [PMC free article] [PubMed] [Google Scholar]
- 4. Axe EL, Walker SA, Manifava M, Chandra P, Roderick HL, Habermann A, Griffiths G, Ktistakis NT (2008) Autophagosome formation from membrane compartments enriched in phosphatidylinositol 3‐phosphate and dynamically connected to the endoplasmic reticulum. J Cell Biol 182: 685–701 [DOI] [PMC free article] [PubMed] [Google Scholar]
- 5. Polson HE, de Lartigue J, Rigden DJ, Reedijk M, Urbe S, Clague MJ, Tooze SA (2010) Mammalian Atg18 (WIPI2) localizes to omegasome‐anchored phagophores and positively regulates LC3 lipidation. Autophagy 6: 506–522 [DOI] [PubMed] [Google Scholar]
- 6. Carlsson SR, Simonsen A (2015) Membrane dynamics in autophagosome biogenesis. J Cell Sci 128: 193–205 [DOI] [PubMed] [Google Scholar]
- 7. Mizushima N, Noda T, Yoshimori T, Tanaka Y, Ishii T, George MD, Klionsky DJ, Ohsumi M, Ohsumi Y (1998) A protein conjugation system essential for autophagy. Nature 395: 395–398 [DOI] [PubMed] [Google Scholar]
- 8. Stolz A, Ernst A, Dikic I (2014) Cargo recognition and trafficking in selective autophagy. Nat Cell Biol 16: 495–501 [DOI] [PubMed] [Google Scholar]
- 9. Ravikumar B, Moreau K, Jahreiss L, Puri C, Rubinsztein DC (2010) Plasma membrane contributes to the formation of pre‐autophagosomal structures. Nat Cell Biol 12: 747–757 [DOI] [PMC free article] [PubMed] [Google Scholar]
- 10. Nascimbeni AC, Giordano F, Dupont N, Grasso D, Vaccaro MI, Codogno P, Morel E (2017) ER‐plasma membrane contact sites contribute to autophagosome biogenesis by regulation of local PI3P synthesis. EMBO J 36: 2018–2033 [DOI] [PMC free article] [PubMed] [Google Scholar]
- 11. Hailey DW, Rambold AS, Satpute‐Krishnan P, Mitra K, Sougrat R, Kim PK, Lippincott‐Schwartz J (2010) Mitochondria supply membranes for autophagosome biogenesis during starvation. Cell 141: 656–667 [DOI] [PMC free article] [PubMed] [Google Scholar]
- 12. Hamasaki M, Furuta N, Matsuda A, Nezu A, Yamamoto A, Fujita N, Oomori H, Noda T, Haraguchi T, Hiraoka Y et al (2013) Autophagosomes form at ER‐mitochondria contact sites. Nature 495: 389–393 [DOI] [PubMed] [Google Scholar]
- 13. Shpilka T, Elazar Z (2015) Lipid droplets regulate autophagosome biogenesis. Autophagy 11: 2130–2131 [DOI] [PMC free article] [PubMed] [Google Scholar]
- 14. Ge L, Melville D, Zhang M, Schekman R (2013) The ER‐Golgi intermediate compartment is a key membrane source for the LC3 lipidation step of autophagosome biogenesis. Elife 2: e00947 [DOI] [PMC free article] [PubMed] [Google Scholar]
- 15. DeJesus R, Moretti F, McAllister G, Wang Z, Bergman P, Liu S, Frias E, Alford J, Reece‐Hoyes JS, Lindeman A et al (2016) Functional CRISPR screening identifies the ufmylation pathway as a regulator of SQSTM1/p62. Elife 5: e17290 [DOI] [PMC free article] [PubMed] [Google Scholar]
- 16. Goodwin JM, Dowdle WE, DeJesus R, Wang Z, Bergman P, Kobylarz M, Lindeman A, Xavier RJ, McAllister G, Nyfeler B et al (2017) Autophagy‐independent lysosomal targeting regulated by ULK1/2‐FIP200 and ATG9. Cell Rep 20: 2341–2356 [DOI] [PMC free article] [PubMed] [Google Scholar]
- 17. Lipinski MM, Hoffman G, Ng A, Zhou W, Py BF, Hsu E, Liu X, Eisenberg J, Liu J, Blenis J et al (2010) A genome‐wide siRNA screen reveals multiple mTORC1 independent signaling pathways regulating autophagy under normal nutritional conditions. Dev Cell 18: 1041–1052 [DOI] [PMC free article] [PubMed] [Google Scholar]
- 18. Chresta CM, Davies BR, Hickson I, Harding T, Cosulich S, Critchlow SE, Vincent JP, Ellston R, Jones D, Sini P et al (2010) AZD8055 is a potent, selective, and orally bioavailable ATP‐competitive mammalian target of rapamycin kinase inhibitor with in vitro and in vivo antitumor activity. Cancer Res 70: 288–298 [DOI] [PubMed] [Google Scholar]
- 19. Brinkman EK, Chen T, Amendola M, van Steensel B (2014) Easy quantitative assessment of genome editing by sequence trace decomposition. Nucleic Acids Res 42: e168 [DOI] [PMC free article] [PubMed] [Google Scholar]
- 20. Birmingham CL, Smith AC, Bakowski MA, Yoshimori T, Brumell JH (2006) Autophagy controls Salmonella infection in response to damage to the Salmonella‐containing vacuole. J Biol Chem 281: 11374–11383 [DOI] [PubMed] [Google Scholar]
- 21. Shoemaker CJ, Huang TQ, Weir NR, Polyakov N, Denic V (2017) A CRISPR screening approach for identifying novel autophagy‐related factors and cytoplasm‐to‐lysosome trafficking routes. BioRxiv [PREPRINT]. 10.1101/229732 [DOI] [Google Scholar]
- 22. Thiam AR, Beller M (2017) The why, when and how of lipid droplet diversity. J Cell Sci 130: 315–324 [DOI] [PubMed] [Google Scholar]
- 23. Bickel PE, Tansey JT, Welte MA (2009) PAT proteins, an ancient family of lipid droplet proteins that regulate cellular lipid stores. Biochim Biophys Acta 1791: 419–440 [DOI] [PMC free article] [PubMed] [Google Scholar]
- 24. Singh R, Kaushik S, Wang Y, Xiang Y, Novak I, Komatsu M, Tanaka K, Cuervo AM, Czaja MJ (2009) Autophagy regulates lipid metabolism. Nature 458: 1131–1135 [DOI] [PMC free article] [PubMed] [Google Scholar]
- 25. Dupont N, Chauhan S, Arko‐Mensah J, Castillo EF, Masedunskas A, Weigert R, Robenek H, Proikas‐Cezanne T, Deretic V (2014) Neutral lipid stores and lipase PNPLA5 contribute to autophagosome biogenesis. Curr Biol 24: 609–620 [DOI] [PMC free article] [PubMed] [Google Scholar]
- 26. Kerner J, Hoppel C (2000) Fatty acid import into mitochondria. Biochim Biophys Acta 1486: 1–17 [DOI] [PubMed] [Google Scholar]
- 27. Rambold AS, Cohen S, Lippincott‐Schwartz J (2015) Fatty acid trafficking in starved cells: regulation by lipid droplet lipolysis, autophagy, and mitochondrial fusion dynamics. Dev Cell 32: 678–692 [DOI] [PMC free article] [PubMed] [Google Scholar]
- 28. Zhang SO, Box AC, Xu N, Le Men J, Yu J, Guo F, Trimble R, Mak HY (2010) Genetic and dietary regulation of lipid droplet expansion in Caenorhabditis elegans . Proc Natl Acad Sci USA 107: 4640–4645 [DOI] [PMC free article] [PubMed] [Google Scholar]
- 29. Weis BC, Cowan AT, Brown N, Foster DW, McGarry JD (1994) Use of a selective inhibitor of liver carnitine palmitoyltransferase I (CPT I) allows quantification of its contribution to total CPT I activity in rat heart. Evidence that the dominant cardiac CPT I isoform is identical to the skeletal muscle enzyme. J Biol Chem 269: 26443–26448 [PubMed] [Google Scholar]
- 30. Doerrler WT, Sikdar R, Kumar S, Boughner LA (2013) New functions for the ancient DedA membrane protein family. J Bacteriol 195: 3–11 [DOI] [PMC free article] [PubMed] [Google Scholar]
- 31. Finn RD, Attwood TK, Babbitt PC, Bateman A, Bork P, Bridge AJ, Chang HY, Dosztanyi Z, El‐Gebali S, Fraser M et al (2017) InterPro in 2017‐beyond protein family and domain annotations. Nucleic Acids Res 45: D190–D199 [DOI] [PMC free article] [PubMed] [Google Scholar]
- 32. Ropolo A, Grasso D, Pardo R, Sacchetti ML, Archange C, Lo Re A, Seux M, Nowak J, Gonzalez CD, Iovanna JL et al (2007) The pancreatitis‐induced vacuole membrane protein 1 triggers autophagy in mammalian cells. J Biol Chem 282: 37124–37133 [DOI] [PubMed] [Google Scholar]
- 33. Zhao YG, Chen Y, Miao G, Zhao H, Qu W, Li D, Wang Z, Liu N, Li L, Chen S et al (2017) The ER‐localized transmembrane protein EPG‐3/VMP1 regulates SERCA activity to control ER‐isolation membrane contacts for autophagosome formation. Mol Cell 67: 974–989 e6 [DOI] [PubMed] [Google Scholar]
- 34. Tabara LC, Escalante R (2016) VMP1 establishes ER‐microdomains that regulate membrane contact sites and autophagy. PLoS One 11: e0166499 [DOI] [PMC free article] [PubMed] [Google Scholar]
- 35. Calvo‐Garrido J, Carilla‐Latorre S, Lazaro‐Dieguez F, Egea G, Escalante R (2008) Vacuole membrane protein 1 is an endoplasmic reticulum protein required for organelle biogenesis, protein secretion, and development. Mol Biol Cell 19: 3442–3453 [DOI] [PMC free article] [PubMed] [Google Scholar]
- 36. Jackson MR, Nilsson T, Peterson PA (1990) Identification of a consensus motif for retention of transmembrane proteins in the endoplasmic reticulum. EMBO J 9: 3153–3162 [DOI] [PMC free article] [PubMed] [Google Scholar]
- 37. Schroder‐Kohne S, Letourneur F, Riezman H (1998) Alpha‐COP can discriminate between distinct, functional di‐lysine signals in vitro and regulates access into retrograde transport. J Cell Sci 111(Pt 23): 3459–3470 [DOI] [PubMed] [Google Scholar]
- 38. Al‐Saif A, Al‐Mohanna F, Bohlega S (2011) A mutation in sigma‐1 receptor causes juvenile amyotrophic lateral sclerosis. Ann Neurol 70: 913–919 [DOI] [PubMed] [Google Scholar]
- 39. Prause J, Goswami A, Katona I, Roos A, Schnizler M, Bushuven E, Dreier A, Buchkremer S, Johann S, Beyer C et al (2013) Altered localization, abnormal modification and loss of function of Sigma receptor‐1 in amyotrophic lateral sclerosis. Hum Mol Genet 22: 1581–1600 [DOI] [PubMed] [Google Scholar]
- 40. Hayashi T, Su TP (2007) Sigma‐1 receptor chaperones at the ER‐mitochondrion interface regulate Ca(2 + ) signaling and cell survival. Cell 131: 596–610 [DOI] [PubMed] [Google Scholar]
- 41. Hayashi T, Su TP (2003) Sigma‐1 receptors (sigma(1) binding sites) form raft‐like microdomains and target lipid droplets on the endoplasmic reticulum: roles in endoplasmic reticulum lipid compartmentalization and export. J Pharmacol Exp Ther 306: 718–725 [DOI] [PubMed] [Google Scholar]
- 42. Shpilka T, Welter E, Borovsky N, Amar N, Mari M, Reggiori F, Elazar Z (2015) Lipid droplets and their component triglycerides and steryl esters regulate autophagosome biogenesis. EMBO J 34: 2117–2131 [DOI] [PMC free article] [PubMed] [Google Scholar]
- 43. Itakura E, Mizushima N (2011) p62 Targeting to the autophagosome formation site requires self‐oligomerization but not LC3 binding. J Cell Biol 192: 17–27 [DOI] [PMC free article] [PubMed] [Google Scholar]
- 44. Lotti F, Imlach WL, Saieva L, Beck ES, le Hao T, Li DK, Jiao W, Mentis GZ, Beattie CE, McCabe BD et al (2012) An SMN‐dependent U12 splicing event essential for motor circuit function. Cell 151: 440–454 [DOI] [PMC free article] [PubMed] [Google Scholar]
- 45. Carpenter AE, Jones TR, Lamprecht MR, Clarke C, Kang IH, Friman O, Guertin DA, Chang JH, Lindquist RA, Moffat J et al (2006) Cell Profiler: image analysis software for identifying and quantifying cell phenotypes. Genome Biol 7: R100 [DOI] [PMC free article] [PubMed] [Google Scholar]
- 46. Bill A, Gutierrez A, Kulkarni S, Kemp C, Bonenfant D, Voshol H, Duvvuri U, Gaither LA (2015) ANO1/TMEM16A interacts with EGFR and correlates with sensitivity to EGFR‐targeting therapy in head and neck cancer. Oncotarget 6: 9173–9188 [DOI] [PMC free article] [PubMed] [Google Scholar]
- 47. Vizcaino JA, Csordas A, del‐Toro N, Dianes JA, Griss J, Lavidas I, Mayer G, Perez‐Riverol Y, Reisinger F, Ternent T et al (2016) 2016 update of the PRIDE database and its related tools. Nucleic Acids Res 44: D447–D456 [DOI] [PMC free article] [PubMed] [Google Scholar]
Associated Data
This section collects any data citations, data availability statements, or supplementary materials included in this article.
Supplementary Materials
Expanded View Figures PDF
Dataset EV1
Dataset EV2
Source Data for Expanded View
Review Process File
Source Data for Figure 1
Source Data for Figure 2
Source Data for Figure 3
Source Data for Figure 5
Data Availability Statement
The mass spectrometry proteomics data from this publication have been deposited to the ProteomeXchange Consortium via the PRIDE 47 partner repository with the dataset identifier PXD010207.


