Abstract
Significance.
Digital reading displays provide opportunities for enhancing accessibility of text for low vision. How are these displays used by people in their daily lives?
Purpose.
Subjects responded to an online survey concerning their vision history, reading technology, display preferences and reading habits. Here, we report on findings concerning acuity and magnification.
Methods.
The survey asked subjects to arrange a text passage for typical reading, and to report viewing distance, screen dimensions and the number of characters per line. 75 adult subjects (most with early-onset low vision, few with central field loss) completed all survey questions relevant to the analysis of acuity and magnification. Mean acuity was .92 logMAR (range 0.1 to 1.6) and mean age 44.8 years (range 18 to 71). Twelve normally sighted controls reported the same information while viewing the passage on cellphones, tablets and computers.
Results.
The controls had a mean viewing distance of 38.7 cm and a mean x-height of 1.38 mm. For all three types of devices, angular x-height was 0.21° (close to laboratory estimates of the critical print size for reading). Low-vision subjects showed decreasing viewing distance and increasing print size with larger values of logMAR acuity. Most of the low-vision subjects achieved their desirable magnification by a combination of reduced viewing distance and increased physical letter size. A majority (54 out of 75) relied more on letter-size magnification. Relative to the controls, regression analysis revealed that a typical low-vision subject with logMAR acuity of 1.0 reduced viewing distance by a factor of 2.8 and enlarged physical print size by a factor of 6.
Conclusions.
Our survey shows that people with a wide range of acuities are engaged in digital reading. Our subjects achieved desirable magnification primarily by enlarging physical character size and to a lesser extent by reducing viewing distance.
Keywords: low vision, reading, acuity, magnification
There are between 3.5 and 5 million Americans with low vision,1 and the number is rising as our population ages. Difficulty with reading is a primary challenge for most people with low vision.2 Despite difficulty, many people with low vision read visually, at least for some purposes.
Modern electronic technology has enhanced accessibility of text for people with low vision, first by moving text from hard copy onto video screens where it can be manipulated visually, and more recently into digital representations which can be customized. Digital documents on computers and mobile devices permit easy manipulation of print size, contrast polarity, font, color, and layout. Smartphones, tablets and computers have gained wide acceptance among people with impaired vision for reading and other tasks.3 Built-in features for magnification and speech access in mainstream devices, and inexpensive apps, broaden utilization and provide appealing alternatives to expensive special-purpose assistive technology.4 It has been shown that, in some cases, mainstream devices, such as iPads, are as effective for magnified reading as dedicated closed-circuit television (CCTV) magnifiers.5
Low-vision reading in natural contexts involves complex interactions between the reader’s vision status, viewing distance, text properties such as font, contrast and print size, and the reading task. Many relevant variables have been isolated for study in the lab, but rarely examined in the field. For this reason, we have conducted an online survey of the ecology of low-vision reading. Our goals are two-fold: to obtain a snapshot of the visual-reading behavior of people with low vision who have adopted digital technology, and to determine how properties of their reading behavior compare with laboratory findings on low-vision reading.
In the present paper, we focus on one part of our survey. Respondents were asked to view a sample of text and report several viewing properties. Our goals were to estimate the magnification used in relation to acuity, and how viewing distance and physical print size were manipulated to achieve the chosen magnification level. We made similar estimates for a control group of normally sighted young adults. We interpret our findings with reference to research on critical print size and acuity reserve. Critical print size refers to the angular size of print required for maximum reading speed,6 and acuity reserve is the ratio of the subject’s goal or preferred print size to the size of acuity letters.7
METHODS
Participants
Participants were recruited through relevant vision loss organizations such as the American Council of the Blind and Foundation Fighting Blindness, as well as through word of mouth. Screening questions were used to determine eligibility. Only adults, aged 18 and older, were eligible to participate. We used the following definition of low vision in our survey: Low vision is defined as an acuity of less than 20/60 with best prescribed glasses or contacts or a visual field less than 20 degrees in extent. One of our screening questions asked subjects to confirm that they read visually at least for some purposes.
125 people with low vision participated in our online survey between October 2015 and July 2017. Of these, 75 completed all questions relevant to the analysis reported here. These questions pertained to a sample text passage from Alice in Wonderland. The subjects who were excluded from this analysis did not respond to a question about their acuity or did not respond to one of the requested questions concerning the Alice passage. All but one of the 75 subjects resided in the United States.
The characteristics of this subset of 75 subjects were very similar to those of the full set of 125 participants, e.g., mean ages of 44.8 (SD 16.6, range 18 to 71) and 46 years, and mean acuities of 0.92 (SD 0.36, range 0.1 to 1.6) and 0.93 logMAR respectively. The acuities were self-reported, usually provided as Snellen fractions. 48% of the sample reported no field loss, 40% peripheral field loss, 9.3% central-field loss, with 2.7% not reporting.
76% of participants were female and 24% were male. 77.4% had a college/University degree or higher, 42.6% were currently employed and 17.3% were students. 18.7% of subjects developed low vision in adulthood, 12% as juveniles and 69.3% had low vision from birth.
Participants stated various and sometimes multiple causes of their low vision. The most commonly cited diagnoses were albinism (21), retinitis pigmentosa (15), retinopathy of prematurity (6) and glaucoma (5). 10 listed other forms of retinal degeneration. 42 indicated that they experienced nystagmus. This group had significantly different acuity (mean 1.02 logMAR) than the 33 subjects who did not report nystagmus (mean 0.79 logMAR). But once acuity was taken into account, these two groups did not differ in any of the other reading measures reported in the Results section.
Twelve normally sighted young adults provided baseline data (mean age 26.5 years, range 20 to 31). They were all staff or students in our laboratory with self-reported best-corrected visual acuities of 20/20 or better. They were asked to view the Alice passage on their personal devices, classified as smartphones (Android and Apple), tablets (primarily iPads), laptops and desktops (assorted brands). Not all of these subjects made measurements on all the types of devices, and a few made measurements on more than one device in a given category.
The subjects provided consent electronically prior to taking the survey. Our research protocol and consent process were approved by the University of Minnesota Institutional Review Board and follow the tenets of the Declaration of Helsinki.
Materials
Our online survey was designed to be accessible by people using multiple forms of magnification and also by screen-reading software.
In addition to the details reported here, the survey included sections on demographics and the causes of visual impairment, reading modalities used (vision, auditory, tactile), reading aids (various optical and electronic devices), typical reading conditions (lighting, contrast polarity, fonts), and reading habits associated with several activities (vocational, recreational, spot reading tasks, social media). We will report in a separate manuscript on other findings from our survey.
In the portion of the survey discussed in this paper, participants were presented with a passage of text from Alice in Wonderland, as seen in the upper panel of Figure 1. The passage consisted of 16 single-space lines containing 256 words, with a maximum of 96 characters per line, in 12-point Times New Roman.
Figure 1.
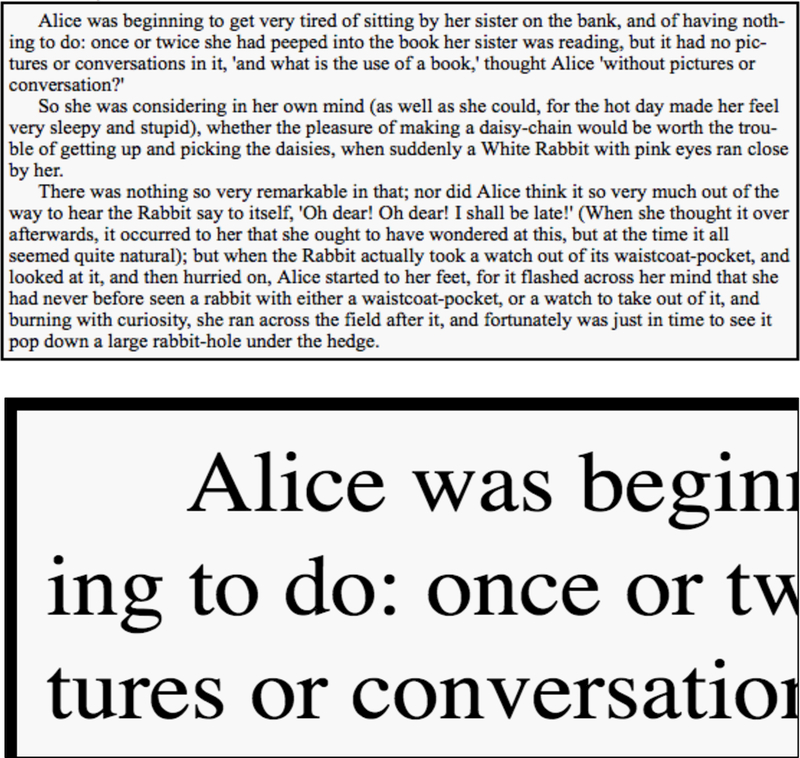
Sample Text from Alice in Wonderland. Upper Panel: Full Alice passage. Lower Panel: Magnified view of a portion of the Alice passage. Based on the display presented in this image, a subject should report that they see 21 characters in a line of text.
Procedures
Participants were instructed to adjust their display as they normally would if they planned to read the passage visually. We anticipated that some subjects would use some form of screen magnification, requiring horizontal scrolling of text to read full lines. For example, the lower panel of Figure 1 shows how a zoomed in portion of text might appear to a low vision subject using magnification.
The participants were then asked to respond to a series of questions concerning 1) the device used for reading; 2) approximate viewing distance (specifying whether inches or centimeters); 3) width and height of the screen; and 4) the number of characters visible on a line of text without scrolling. For instance, in the lower panel of Figure 1, the number of visible characters on a line is about 21.
Our instructions requested approximate measures of viewing distance and screen size and did not require formal measurements. Specifically, “Please estimate (or measure) the size of the screen by including its width and height dimensions. (You can skip this step if you have listed a device and model number above because we can look up the screen dimensions.” 22 of the subjects listed the model number, enabling us to look up a manufacturer’s specification of screen dimensions. To guard against potential confusion with diagonal screen size, data were analyzed only for subjects who provided values for both screen width and height (or a device model number from which these dimensions could be assessed.) Because we were interested in viewing conditions and not in reading performance per se, subjects were not required to read the passage in detail and were not tested for comprehension of the passage.
We computed the physical character size (x-height) used by the participant from their estimate of screen width and the number of characters visible per line, and from knowledge of the relationship between x-height and frequency-weighted average character width in the Times New Roman font. Using this estimate of physical character size and the participant’s viewing distance, we computed the angular size of characters (angular x-height) used by the participant. The acuity reserve was then computed as the ratio of angular character size to the size of the participant’s acuity letters.
We asked our normally sighted subjects to view the Alice passage on three devices of their choosing--a smart phone, tablet and laptop/desktop computer--and to provide us with measurements of their viewing distances, and the line widths on the screen. Using these data we computed the angular print sizes they chose for reading on the three types of devices. We used these data as baselines for comparison with our low-vision participants. We did not measure the acuities of the normally sighted participants, but for purposes of computation, we assumed a nominal value of logMAR = 0 (Snellen 20/20).
RESULTS
We begin by reporting results for the normally sighted controls. They responded with measures of reading distance and line lengths for three categories of devices, varying in screen size (Table 1).
Table 1.
Device Measures for Normally Sighted Participants (Means and Standard Deviations).
| Device Type | # of Devices Tested | Viewing Distance (cm) |
Physical Print Size (x-height in mm) |
Angular Print Size (°) |
|---|---|---|---|---|
| Smartphone | 11 | 26.2 (6.2) | 1.02 (0.25) | 0.21 (0.05) |
| Tablet | 13 | 39.5 (7.9) | 1.27 (0.25) | 0.21 (0.04) |
| Laptop/Desktop | 10 | 51.6 (9.9) | 1.78 (0.76) | 0.21 (0.07) |
| Overall | 34 | 38.7 (12.5) | 1.38 (0.53) | 0.21 (0.05) |
Mean viewing distance and physical print size both increased systematically with increasing display size from smartphones to tablets to computers. However, the mean angular print size remained remarkably constant across the three device categories at 0.21°. Averaged across all 34 cases, the mean viewing distance was 38.7 cm, close to the often-cited “standard” reading distance of 40 cm.
The low-vision subjects favored larger displays for reading the Alice passage (Table 2). 60 used a computer (desktop or laptop), 10 a tablet, and three a smartphone. Two others printed the Alice sample with one of them reading with a CCTV and the other with a handheld digital magnifier. Due to the similarity of the screen size of a CCTV to that of a computer, the CCTV user was grouped with the computer users (n=61), and because of the similarity of the screen size of a handheld digital magnifier to that of a smartphone that individual was grouped with the smartphone users (n=4). Mean acuities were slightly better for the smartphone and tablet users (Table 2). Viewing distance increased with screen size from about 17 cm for smartphones to 29 cm for computers. As expected, these viewing distances are shorter than those used by normally sighted subjects for the same devices.
Table 2.
Device Measures for Low-Vision Participants (Means and Standard Deviations).
| # of participants | Acuity | Viewing Distance (cm) | Physical Print Size (mm) | Angular Print Size (degree) | |
|---|---|---|---|---|---|
| Smart phone | 4 | 0.83 (0.52) | 17.15 (12.68) | 5.91 (7.41) | 1.68 (0.96) |
| Tablet | 10 | 0.86 (0.39) | 19.56 (13.01) | 7.57 (4.87) | 3.83 (4.27) |
| Computer | 61 | 0.93 (0.36) | 29.31 (18.85) | 10.10 (8.58) | 3.04 (4.19) |
| Overall | 75 | 0.92 (0.36) | 27.36 (18.22) | 9.54 (8.14) | 3.07 (4.09) |
Figure 2 is a scatterplot of viewing distance as a function of acuity for the 75 low-vision subjects; the open triangles, squares and circles show data for computer, tablet and smartphone displays respectively. The large solid triangle shows the average viewing distance (51.6 cm) used by the normally sighted subjects viewing a computer display. The regression line, fitted to the low-vision data, indicates that viewing distance decreased for poorer acuity (larger logMAR values). The regression line indicates that someone with acuity of logMAR 1.0 (Snellen 20/200) would be expected to have a viewing distance of about 26 cm. The corresponding correlation between viewing distance and logMAR acuity was statistically significant (R = −.32, P < .01). Multiple regression analysis indicated that once acuity was taken into account, the age of our low-vision subjects did not significantly affect viewing distance.
Figure 2.
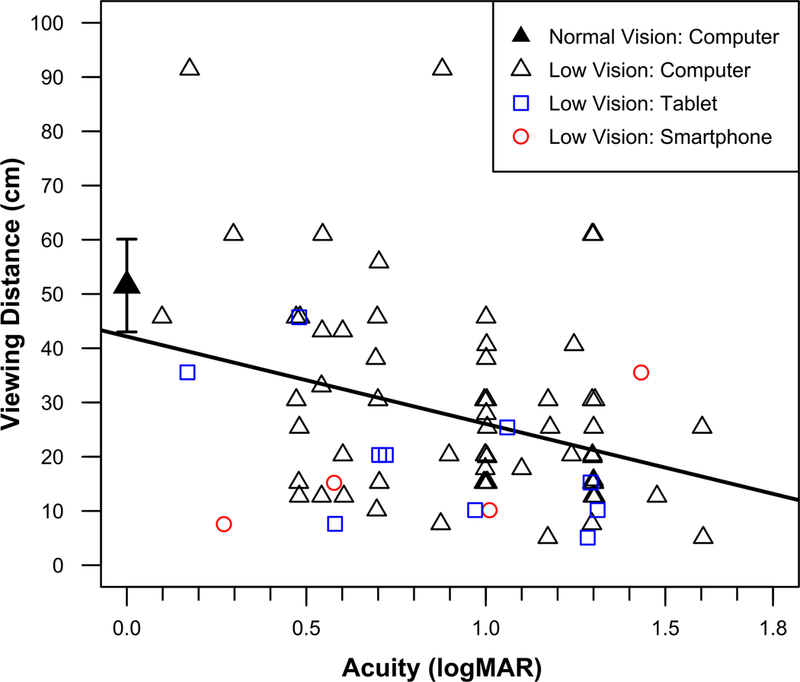
Scatterplot of viewing distance and logMAR acuity for 75 low-vision subjects. Open symbols show results for computers (triangles), tablets (squares) and smartphones (circles). The equation for the fitted regression line is y = 42.2 – 16.1x. The large, solid triangle and error bars show average viewing distance and ±1 SD for the normally sighted controls viewing computer displays. 61 of the 75 low-vision subjects used a computer for reading the Alice passage.
We note that a few of our low-vision subjects had viewing distances larger than the mean value of 51.6 cm used by normally sighted subjects for computer displays. Two of these subjects had near-normal acuity (0.18 and 0.30) and were classified as low vision because of their narrow visual fields. As discussed below in connection with Figures 5 and 6, these are subjects who relied on enlarging physical letter size on the display to achieve adequate magnification rather than reducing viewing distance. We can’t be sure whether the two outlier points (near 90 cm) represent reporting error or actual use of very long viewing distances.
Figure 3 is a similar scatterplot of physical print size (x-height in mm) as a function of acuity. The solid triangle shows the mean print size (1.78 mm) used by the normally sighted controls for computer viewing. In this case, the regression line shows that physical print size increased with poorer acuity. The regression line indicates that someone with acuity of logMAR 1.0 (Snellen 20/200) would be expected to read text with x-height of about 10 mm. The corresponding correlation between print size (x-height) and logMAR acuity was statistically significant (R = −.3, p < .01). Although the sample of smartphone and tablet users is small, it appears that they tended to use smaller physical print sizes than the computer users.
Figure 3.
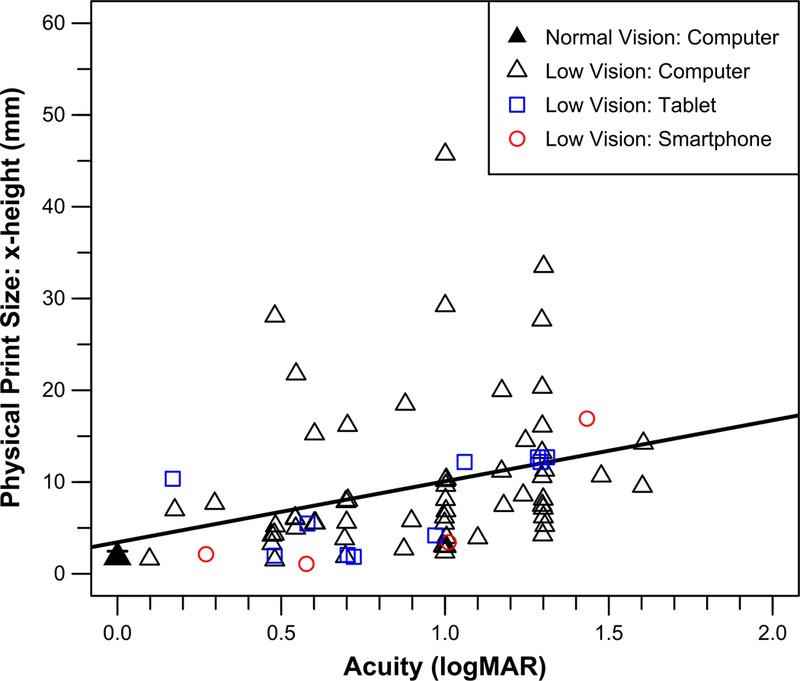
Scatterplot of physical print size (x-height in mm) and logMAR acuity for 75 low-vision subjects. The open triangles, squares and circles show data for computer, tablet and smartphone displays respectively. The equation for the fitted regression line is y = 3.43 + 6.65x. The solid triangle and error bars show average physical print size and ±1 SD, for the normally sighted controls viewing computer displays. 61 of the 75 low-vision subjects used a computer for reading the Alice passage.
Figure 4A replots the data from Figures 2 and 3 as a scatterplot of angular print size of text in logMAR units vs. acuity. The angular print size for a given low-vision subject was computed from the subjects viewing distance (Figure 2) and physical print size (Figure 3.) The filled triangle, representing the average value for the normally sighted subjects, is plotted at an acuity of logMAR 0 (Snellen 20/20). The diagonal dashed line represents equality of angular print size and acuity size. Subjects’ whose points lie on or near this line were reading at or near their acuity limits. Points above the dashed line indicate that subjects were reading print larger in angular size than their acuity letters.
Figure 4.
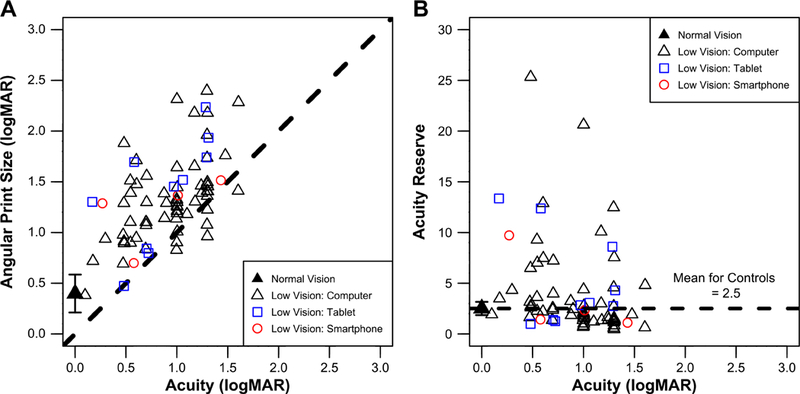
Angular Print Size and Acuity Reserve. (A) Scatterplot of angular print size and visual acuity. The dashed diagonal line is an equality line representing text with print at the acuity limit. (B) The data of panel A are replotted as acuity reserve vs. visual acuity. Acuity reserve is the ratio of angular print size divided by the size of acuity letters. A value greater than 1.0 means that print letters are larger than acuity letters. The filled triangle and horizontal dashed line show the average acuity reserve of our normally sighted subjects, based on data from all three display categories. In both panels, the open symbols show values for the 75 low-vision subjects: triangles, squares and circles for computer, tablet and smartphone displays, respectively.
The separation between a reader’s chosen angular print size for text and reading acuity can be expressed as a ratio called the acuity reserve.7 For example, if acuity letters subtend 20 min-arc (logMAR 0.6) and the reader’s angular print size for text is 50 min-arc (logMAR 1.0), the acuity reserve is the ratio 50 min-arc divided by 20 min-arc equals 2.5. Figure 4B replots the data of Figure 4A as acuity reserve vs. acuity. The horizontal line through the solid triangle represents the average acuity reserve of the normally sighted subjects and has a value of 2.5. This means that, on average, the normally sighted subjects arranged their viewing distance and physical print size on the screen so that text letters were about 2.5 times larger than 20/20 acuity letters. The open symbols show the acuity reserves of the 75 low-vision subjects. The low-vision values are widely distributed above and below the value for the normally sighted subjects.
A low-vision subject with an acuity reserve less than the average value for controls of 2.51 means that the person was reading with a print size closer to their acuity limit than a typical control subject. We compared the 40 low-vision subjects in this category with the 35 subjects with acuity reserves greater than 2.51. The group with the lower acuity reserves had significantly poorer acuity (mean 1.01 logMAR) than those with higher acuity reserves (mean 0.82 logMAR) (t(66.88) = 2.33, p = .02). The group with lower acuity reserves also had a longer viewing distance (mean 30.2 cm) than the group with larger acuity reserves (mean 24.1 cm), although this difference was not statistically significant (p = .15). Whereas Figure 2 showed that people with poorer acuity tend to use shorter viewing distances, this analysis indicates that some people with lower acuities appear to prefer a longer viewing distance at the cost of a reduced acuity reserve.
Next, we examined how our low-vision subjects adjusted their reading configuration to achieve their desired magnification. When reading text on a display, angular print size can be increased in two ways--by enlarging the physical print size on the screen and/or by reducing viewing distance. We asked which of these strategies our low-vision readers relied on most. To address this question, we used average values from our normally sighted subjects as baselines for the three categories of devices (Table 1), and compared the viewing distances and letter sizes chosen by low-vision readers using the corresponding category. For example, most of our low-vision subjects used a computer for reading the Alice passage. Our normally sighted subjects had an average viewing distance of 51.6 cm and average physical print size of 1.78 mm for this category of devices. A low-vision subject who used a viewing distance of 26 cm (about half the normal value), was defined to have a Viewing-Distance Magnification of 2. If the subject used a physical print size of 5.4 mm (about 3 times larger than the normal value), the Letter-Size Magnification was defined to be 3. Since the overall magnification is the product of these two magnification factors, this subject’s overall angular print size would be 6 times larger than the normal baseline. Since the normally sighted subjects adjusted their digital displays to have an average angular print size of 0.21°, six-fold magnification means that the low-vision subject would be reading text with angular print size of 1.26°.
For the purpose of this analysis, we compared the 75 low-vision subjects to the baseline values for one of the three device categories used by the normally sighted subjects. The 61 computer users were compared with the baseline data from the computer category. The 10 low-vision tablet users were compared with the baseline data from the tablet category. The four smartphone users were referred to the baseline data for smartphones.
Figures 5A and 5B provide scatterplots of Viewing Distance Magnification vs. Acuity and Letter Size Magnification vs. Acuity. The rising regression lines show that both factors increase with logMAR acuity. The regression line for Letter-Size Magnification is steeper, implying a stronger dependence on acuity. To illustrate this difference, at an acuity of 1.0 (Snellen 20/200), the regression lines pass through a Viewing Distance Magnification of 2.8 and a Letter-Size Magnification of 6.01.
Figure 5.
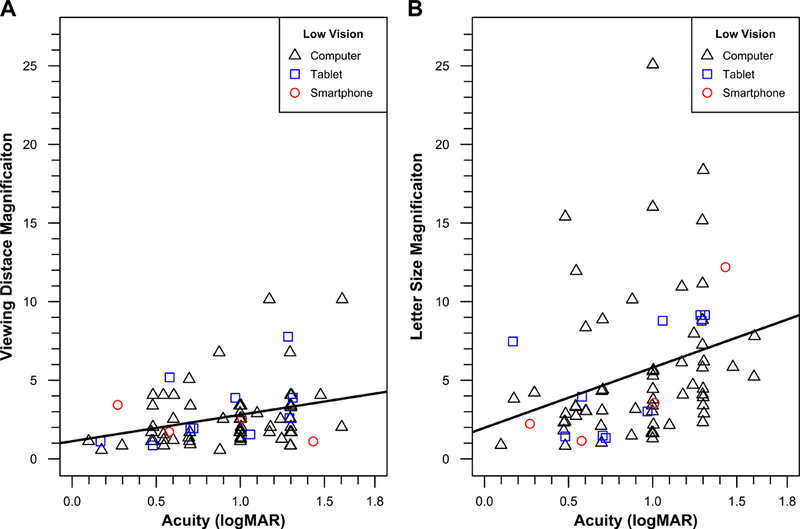
Magnification factors for 75 low-vision subjects. (A) Scatterplot of Viewing-Distance Magnification vs. Acuity. The equation for the regression line is y = 1.12 + 1.68x. (B) Scatterplot of Letter-Size Magnification vs. Acuity. The equation for the regression line is y = 2.00 + 4.01x. The open triangles, squares and circles show data for computer, tablet and smartphone displays respectively.
Figure 6 replots the data from Figure 5 as a scatterplot of Letter-Size Magnification vs. Viewing-Distance Magnification for our 75 low-vision subjects. The dashed diagonal line corresponds to equal magnification factors due to reduced viewing distance and increased physical print size. More of the points lie above the diagonal line (54 out of 75) than below the diagonal line. This means that the majority of subjects have larger values of Letter-Size Magnification than Viewing-Distance Magnification. In other words, the majority of this group of low-vision subjects relied more on enlarged print on the screen than on near viewing distance to achieve adequate magnification.
Figure 6.
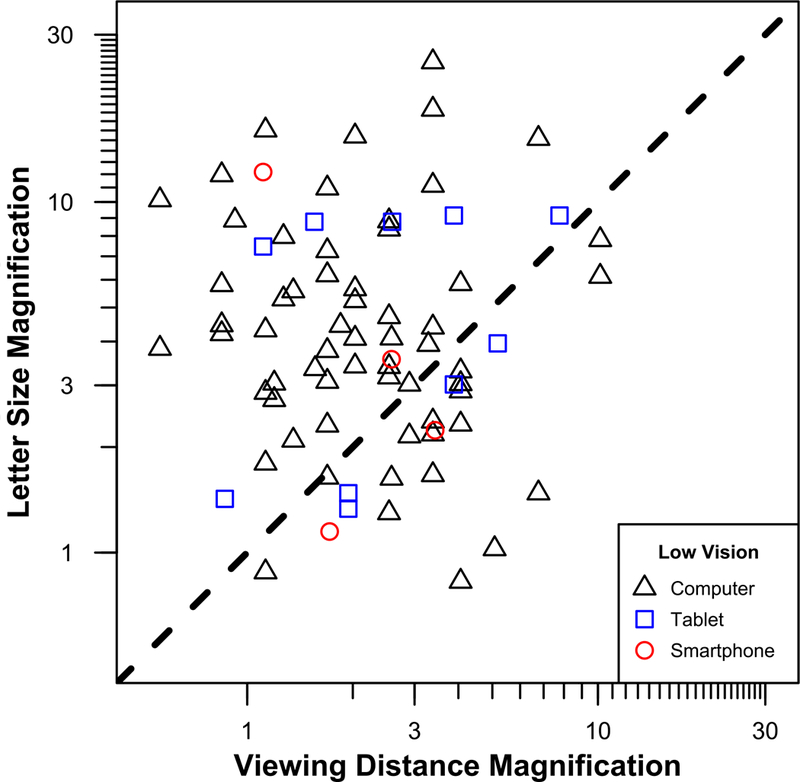
Scatterplot of Letter-Size Magnification vs. Viewing-Distance Magnification for 75 low-vision subjects. The diagonal dashed line represents equal contributions of the two forms of magnification. A subject’s overall magnification is the product of Letter-Size Magnification and Viewing-Distance Magnification, and represents the ratio of angular print size to the angular print size used by normally sighted controls. The open triangles, squares and circles show data for computer, tablet and smartphone displays, respectively.
Many low-vision subjects may prefer to achieve magnification by increasing physical letter size on a display, but a constraint on letter size is screen width and the corresponding number of characters per line. For example, if the screen width is 25 cm (approximately 10 inches), and the average center-to-center spacing of characters is 1 cm, then the maximum number of characters per line (including spaces) would be 25. Our sample passage contained a maximum line length of 96 characters. Sixteen of our 75 subjects reported 90 or more characters per line, making it likely that the whole passage was visible on their displays. Of these 16, 12 were computer users and three were tablet users. One was a smartphone user with an acuity of 0.54 logMAR who viewed an iPhone 6 in landscape orientation from 6 inches with letters having an estimated x-height of 1.11 mm. For this person’s viewing arrangement, the angular x-height was 0.42° and the acuity reserve was 1.43. This is an instance of a person who chose to read very small print on a small display near the acuity limit, relying on a very short viewing distance for magnification. For the remaining 59 subjects, the mean number of characters per line was 46.9 (SD 23). Regression analysis showed that subjects with higher values of logMAR acuity had fewer characters per line with a minimum of six characters per line for one subject.
DISCUSSION
Normal Vision
Our normally sighted young adult subjects showed systematic viewing preferences related to display size (Table 1). They viewed smartphones from a nearer distance and smaller x-height than computers, with tablets in between. For all three categories of displays, the resulting angular print size (x-height) was constant at 0.21°. This value is almost identical to the typically cited critical print size for reading text of 0.2°, measured in several lab studies as summarized by Legge & Bigelow,8 and Legge.9 These results indicate that normally sighted subjects constrain the tradeoff between physical print size and viewing distance by placing text near the critical print size for reading.
The concept of a smallest print size for fluent reading has been long understood. Huey recommended an x-height no less than 1.5 mm for printed texts.10 This recommendation corresponds to an angular character size of 0.2° at a common reading distance of 40 cm.
Bababekova et al.11 surveyed the font sizes and reading distances of more than 100 young normally sighted cell phone users for text messaging and web browsing. On average, they held the phones at 36 and 32 cm respectively, with font sizes equivalent to 1.1 M and 0.8 M print. The corresponding angular x-heights of the cell phone print were 0.23° and 0.21°, almost identical to the angular sizes measured in our study. We note that the mean viewing distance of our normally sighted subjects was slightly smaller at 26.2 cm, with corresponding smaller physical print. It is possible that the smartphones used by our subjects could render smaller characters at satisfactory pixel resolution thereby accommodating more text on a small display.
Ko et al.12 tested 27 normally sighted subjects on visually demanding text-based interactive tasks on a computer work station. They varied the font size of the text over a 2:1 range—Arial 8 to 16 pt, corresponding to x-heights of 1.47 to 2.94 mm. Subjects performed the tasks while seated in a chair, but were allowed to change posture and chair position. Similar to our findings, they found that subjects increased their viewing distance as the font size increased. However, unlike our case, the range of viewing distances used was relatively small and not sufficient to maintain invariant angular print size. The subjects in the Ko et al.12 study were constrained to work with three specified print sizes, all viewed in a similar context, that is, a chair arranged in front of a work station. In comparison, our subjects were free to choose both print size and viewing distance, as well as seating arrangement.
Two major points emerged from the results with our normally sighted subjects—they adjusted viewing behavior in response to screen size while maintaining invariant angular print size; and they chose an angular print size at or close to the critical print size for reading as measured in lab studies.
Low Vision
Most of our low-vision subjects read the Alice passage on a computer rather than a tablet or smartphone. It is likely that the larger screens afforded a more comfortable reading distance and larger physical print size. Reading text on a small display, such as a smartphone, with low vision involves finding a compromise between sufficiently large print size (zoom), a corresponding reduction in the number of characters per line and lines per screen, and a viewing distance which affords both comfort and adequate acuity reserve. While small displays may be fine for spot reading, the increased demand for a short viewing distance may discourage reading of extended text.
Our normally sighted subjects read with an average acuity reserve of 2.5. Frequently, low-vision readers seek a larger acuity reserve.7,13 Our low-vision subjects had an average acuity reserve of 3.97, but the values were distributed almost evenly above and below the value of 2.5 for the normally sighted subjects. The data in Figure 4 indicate that some of the subjects were reading close to their acuity limits (acuity reserves near 1.0). While noise in reporting may account for this behavior, it is also possible that display size and viewing ergonomics required some subjects to read text close to their acuity limits. It is possible that reading with a low acuity reserve would lead to fatigue or eye strain. If so, these subjects would likely benefit from some combination of larger display, shorter viewing distance and larger font size.
Figures 5 and 6 show that low-vision subjects employed both Viewing-Distance Magnification (they shortened the viewing distance) and Letter-Size Magnification (they enlarged the physical print size) relative to normally sighted subjects reading with the same type of display. The data imply that Letter-Size Magnification contributes more than Viewing-Distance Magnification. Based on the regression lines in Figure 5, a subject with logMAR acuity 1.0 (Snellen 20/200) would enlarge angular print size 2.8 times by reducing viewing distance and another 6 times by enlarging physical print size. For reading text on a computer display, the average viewing distance for a normally sighted subject was 52 cm; the 2.8-fold Viewing-Distance Magnification implies that the low-vision subject adopted a viewing distance of 18.6 cm (that is, 52 divided by 2.8). The average x-height for the normally sighted subjects was 1.78 mm. The 6-fold increase in print size would yield letters with 10.7 mm x-height. The overall magnification in angular print size for this subject would be 16.8 times, that is, the product of Viewing-Distance Magnification and Letter-Size Magnification. Since the angular print size for the normally sighted subjects was 0.21°, magnification by 16.8 times would yield text letters with an x-height of 3.5°.
Why do low-vision readers rely more on Letter-Size Magnification than Viewing-Distance Magnification? Disadvantages in short viewing distances include ergonomic challenges in getting close to screens (especially laptops with hinged screens behind the keyboard) and demands on accommodation. An advantage of digital displays is the flexibility in adjusting physical print size, offset in part by the need for horizontal scrolling when print size is large.
Our survey relied on our subjects’ self-reported acuities and estimates of their reading distance and screen dimensions. How well do people know the numerical values of their own acuity? Most people can provide good estimates of their own height and weight. Many people with diabetes know their A1C blood glucose level because it is functionally salient. Most of the subjects in our survey, and all of those included in the sample of 75 discussed in this paper, were able to provide numerical estimates for their acuity. Our sample of low-vision subjects tended to be fairly young and well educated, factors which predispose them to know their visual acuity. Nevertheless, we acknowledge that the self-reported values are undoubtedly noisier than corresponding laboratory measures. Factors contributing to inaccuracy would include changes in acuity since the last measurement, errors in memory and possible refractive errors associated with near viewing.
Our control subjects were all pre-presbyopic, while the low vision participants were aged up to 71 years. We did not collect data on which type of spectacle correction people were wearing to view the screen. For some of our older participants it may be that screen viewing distance was constrained by the viewing distance required to ensure optimal focus with their multifocal or bifocal lens correction. However, our multiple regression analysis does not show age to be a significant predictor of viewing distance.
We acknowledge that our survey does not represent the low-vision population as a whole. In particular, we have very few respondents with macular degeneration, the leading cause of low vision in the United States. A future study could determine whether our findings generalize to the growing number of older people with central-vision loss who engage in digital reading. A majority of our subjects had early-onset low vision and most of them (77.4%) had a college degree or higher. Given that most of our recruiting used internet methods and the survey was conducted online, it is likely that our sample represents people with low vision who make use of digital reading.
Our field study provides a snapshot of the digital reading configurations used by a technologically savvy group of low-vision subjects, and a small sample of normally sighted subjects. Our results extend findings from laboratory studies on the psychophysics of reading in normal and low vision to reading in more natural contexts.
ACKNOWLEDGMENTS
We thank Andrew Sell and Thomas Lindsay of the Liberal Arts Technologies and Innovation Services (LATIS) at the University of Minnesota, Elaine Kitchel of the American Printing House for the Blind and our fellow lab members of the Minnesota Laboratory for Low-Vision Research. This research was supported by NIH grant EY002934.
REFERENCES
- 1.National Eye Institute (NEI). National Plan for Eye and Vision Research; 2014. Available at: https://nei.nih.gov/strategicplanning/np_low. Accessed March 6, 2014.
- 2.Owsley C, McGwin G Jr, Lee PP, Wasserman N, et al. Characteristics of Low-Vision Rehabilitation Services in the United States. Arch Ophthalmol 2009;127:681–9. [DOI] [PMC free article] [PubMed] [Google Scholar]
- 3.Crossland MD, Silva RS, Macedo AF. Smartphone, Tablet Computer and e-Reader Use by People with Vision Impairment. Ophthalmic Physiol Opt 2014;34:552–7. [DOI] [PubMed] [Google Scholar]
- 4.Griffin-Shirley N, Banda DR, Ajuwon PM, et al. A Survey on the Use of Mobile Applications for People Who Are Visually Impaired. J Vis Impair Blind 2017;111:307–23. [Google Scholar]
- 5.Morrice E, Johnson AP, Marinier JA, Wittich W. Assessment of the Apple iPad as a Low-Vision Reading Aid. Eye 2017;31:865–71. [DOI] [PMC free article] [PubMed] [Google Scholar]
- 6.Chung STL, Mansfield JS, Legge GE. Psychophysics of Reading. XVIII. The Effect of Print Size on Reading Speed in Normal Peripheral Vision. Vision Res 1998;38:2949–62. [DOI] [PubMed] [Google Scholar]
- 7.Whittaker SG, Lovie-Kitchin J. Visual Requirements for Reading. Optom Vis Sci 1993;70:54–65. [DOI] [PubMed] [Google Scholar]
- 8.Legge GE, Bigelow CA. Does Size Matter for Reading? A Review of Findings from Vision Science and Typography. J Vision 2011;11:8. [DOI] [PMC free article] [PubMed] [Google Scholar]
- 9.Legge GE. Psychophysics of Reading in Normal and Low Vision. Mahwah, NJ: Lawrence Erlbaum Associates; 2007. [Google Scholar]
- 10.Huey EB. The Psychology and Pedagogy of Reading. Cambridge, MA: MIT Press; 1968. [Google Scholar]
- 11.Bababekova Y, Rosenfield M, Hue JE, Huang RR. Font Size and Viewing Distance of Handheld Smart Phones. Optom Vis Sci 2011;88:795–7. [DOI] [PubMed] [Google Scholar]
- 12.Ko P, Mohapatra A, Bailey IL, Sheedy J, et al. Effect of Font Size and Glare on Computer Tasks in Young and Older Adults. Optom Vis Sci 2014;91:682–9. [DOI] [PubMed] [Google Scholar]
- 13.Leat SJ, Legge GE, Bullimore M. What is Low Vision? A Re-Evaluation of Definitions. Optom Vis Sci 1999;76:198–211. [DOI] [PubMed] [Google Scholar]


