

Summary
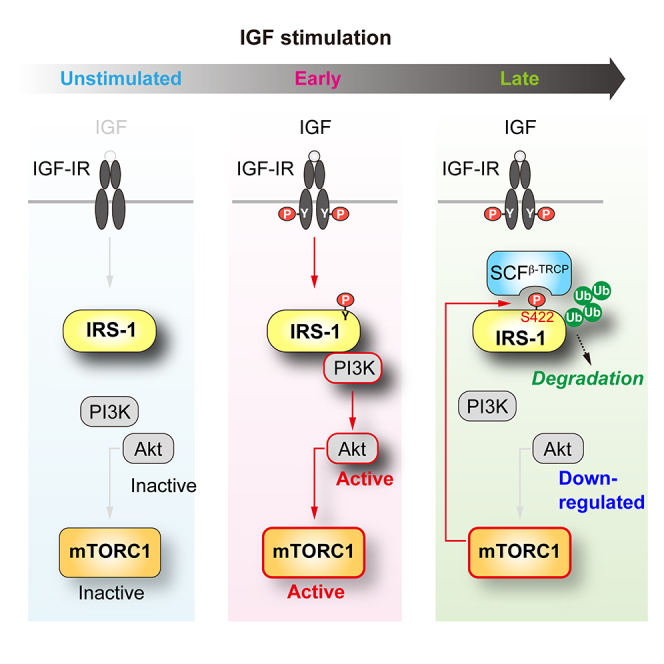
The insulin receptor substrate IRS-1 is a key substrate of insulin and insulin-like growth factor (IGF) receptor tyrosine kinases that mediates their metabolic and growth-promoting actions. Proteasomal degradation of IRS-1 is induced following activation of the downstream kinase mTOR complex 1 (mTORC1) to constitute a negative feedback loop. However, the underlying mechanism remains poorly understood. Here we report that Ser 422 of IRS-1 is phosphorylated by mTORC1 and required for IRS-1 degradation induced by prolonged IGF stimulation. Phosphorylation of Ser 422 then recruits the SCFβ-TRCP E3 ligase complex, which catalyzes IRS-1 ubiquitination. Phosphorylation-dependent IRS-1 degradation contributes to impaired growth and survival responses to IGF in cells lacking TSC2, a negative regulator of mTORC1. Inhibition of IRS-1 degradation promotes sustained Akt activation in IGF-stimulated cells. Our work clarifies the nature of the IRS-1-mTORC1 feedback loop and elucidates its role in temporal regulation of IGF signaling.
Subject Areas: Biochemistry, Biochemical Mechanism, Molecular Physiology, Molecular Interaction
Graphical Abstract
Highlights
-
•
Ser 422 of IRS-1 is identified as a phosphorylation site by mTORC1
-
•
Phosphorylation of Ser 422 induces the binding of SCF β-TRCP E3 ligase to IRS-1
-
•
Ser 422 phosphorylation triggers the SCF β-TRCP-mediated degradation of IRS-1
-
•
The IRS-1-mTORC1 negative feedback loop determines the duration of IGF signaling
Biochemistry; Biochemical Mechanism; Molecular Physiology; Molecular Interaction
Introduction
Insulin and insulin-like growth factors (IGFs), IGF-I and IGF-II, play pivotal roles in growth, differentiation, survival, and various aspects of metabolism in a wide range of mammalian tissues (Nakae et al., 2001). Upon ligand binding, activated insulin/IGF-I receptors phosphorylate a family of insulin receptor substrate (IRS) proteins (White, 2002). Tyr-phosphorylated IRS proteins provide docking sites for the class I phosphatidylinositol 3-kinase (PI3K) (Myers et al., 1996, Sun et al., 1993), which generates phosphatidylinositol-3,4,5-triphosphate leading to activation of the Ser/Thr kinase Akt (Manning and Cantley, 2007). Akt is primarily responsible for the ability of insulin and IGFs to stimulate cell growth, survival, differentiation, and metabolic responses.
Among downstream kinases in insulin/IGF signaling, the Ser/Thr kinase mechanistic target of rapamycin (mTOR) regulates many activities of insulin/IGF. mTOR functions as the core catalytic component of two structurally and functionally distinct complexes, mTORC1 and mTORC2 (Saxton and Sabatini, 2017). mTORC2 is primarily involved in the PI3K/Akt pathway where upon PI3K activation, PDK1 and mTORC2 phosphorylate Thr 308 and Ser 473 of Akt, respectively, and activate it. mTORC1 phosphorylates distinct substrates, including S6 kinase 1 (S6K1) and the eukaryotic translation initiation factor 4E binding protein 1/2 (4EBP1/2) (Ma and Blenis, 2009), to regulate protein translation, autophagy, and cell growth. In cells stimulated with growth factors, Akt activates mTORC1 by phosphorylation-mediated suppression of the tuberous sclerosis complex (TSC) protein complex, which inhibits the small GTPase Rheb, an essential activator of mTORC1 (Inoki et al., 2002, Manning et al., 2002, Menon et al., 2014).
Downstream kinases, including mTOR, phosphorylate multiple Ser/Thr residues of IRS proteins, which affects the signaling ability of IRS (Copps and White, 2012). Importantly, multiple Ser/Thr phosphorylations and subsequent proteasomal degradation of IRS-1, a major IRS family protein, are induced by prolonged exposure to insulin or IGF in various types of cells, where Akt activity, initially stimulated by the ligands, then later decreases (Haruta et al., 2000, Kim et al., 2012, Shi et al., 2011, Yoneyama et al., 2018), suggesting that IRS-1 degradation acts as an intrinsic feedback inhibition mechanism in the PI3K/Akt signaling. The IRS-1 degradation is sensitive to rapamycin (Berg et al., 2002, Hartley and Cooper, 2002, Haruta et al., 2000, Kim et al., 2012, Lee et al., 2000, Yoneyama et al., 2018). In addition, forced activation of mTORC1 results in IRS-1 degradation (Harrington et al., 2004, Shah et al., 2004), indicating that feedback phosphorylation of IRS-1 by the mTORC1/S6K cascade underlies IRS-1 degradation caused by persistent ligand stimulation.
Although several distinct E3 ubiquitin ligases have been reported to ubiquitinate IRS-1, including SOCS1/3, Cbl-b, Mdm2, MG53, Cullin7-Fbxw8 complex, and SCFFbxo40 complex (Nakao et al., 2009, Rui et al., 2002, Shi et al., 2011, Usui et al., 2004, Xu et al., 2008, Yi et al., 2013), the general mechanism underlying Ser/Thr phosphorylation-dependent degradation of IRS-1 remains elusive because of the complexity of IRS-1 Ser/Thr phosphorylation. In particular, the specific phosphorylated Ser/Thr residue(s) responsible for IRS-1 degradation stimulated by prolonged insulin/IGF exposure has not been identified.
Here we report that the SCFβ-TRCP complex mediates mTORC1-induced degradation of IRS-1 in cells stimulated by prolonged IGF. In addition, we demonstrate that Ser 422 is a bona fide target phosphorylation site of mTORC1 and required for IRS-1 degradation and feedback inhibition of the PI3K/Akt signaling. Our work clarifies the nature of the mTORC1-IRS-1 feedback axis playing important roles in balancing IGF signaling and its activities.
Results
Activation of mTORC1 Is Necessary and Sufficient to Induce IRS-1 Degradation
To elucidate the negative feedback mechanisms for degrading IRS-1, we used L6 myoblast cells in which IRS-1 critically contributes to IGF signaling and its bioactivities (Huang et al., 2005, Yoneyama et al., 2018, Yoneyama et al., 2013). In the L6 cells, the phosphorylation of IRS-1, which was reflected by a mobility shift on SDS-PAGE, was observed 1 hr after IGF-I stimulation followed by the marked decrease in IRS-1 protein levels in the later period (6 hr) (Figure 1A). In contrast, IRS-2 levels were not largely affected by IGF-I. We confirmed that the decrease in IRS-1 levels observed after prolonged IGF-I stimulation was blocked by proteasomal inhibitors (Figure S1A). To explore Ser/Thr kinase(s) controlling IRS-1 degradation, we examined the IRS-1 abundance in IGF-I-stimulated cells pretreated with a panel of inhibitors against the mTOR pathway. Consistent with previous studies (Berg et al., 2002, Hartley and Cooper, 2002, Haruta et al., 2000, Kim et al., 2012), inhibition of mTOR with Torin1 and rapamycin blocked the degradation of IRS-1 induced by prolonged IGF-I stimulation (Figure 1A). Treatment with Torin1 and rapamycin also inhibited IGF-I-induced polyubiquitination of IRS-1, which was assessed by immunoprecipitation of FLAG-tagged IRS-1 (FLAG-IRS-1) under denaturing conditions (Figure 1B). In contrast, treatment with the S6K1 inhibitor, PF-4708671 (Pearce et al., 2010), did not affect the IRS-1 levels (Figure 1A), indicating the negligible role of S6K1 activity in IRS-1 degradation. We next evaluated the effects of the mTOR pathway inhibitors on Ser/Thr phosphorylation of IRS-1 by using site-specific phospho-IRS-1 antibodies. In L6 cells, IGF-I-induced phosphorylation of Ser 302, Ser 307, and Ser 318 was sensitive to Torin1 and rapamycin, whereas PF-470861 partially inhibited phosphorylation of Ser 302, but not of other Ser sites (Figure S1B). We also used mouse primary embryonic fibroblasts (MEFs) as another cell model to assess if the mTOR pathway is required for IRS-1 degradation. In MEFs, Torin1 treatment blocked the degradation of IRS-1 induced by IGF-I stimulation, whereas rapamycin partially did and PF-470861 did not (Figure S1C). These data suggest that mTOR activity is required for both multiple Ser phosphorylations and degradation of IRS-1 induced by IGF-I stimulation.
Figure 1.

Activation of mTORC1 Is Necessary and Sufficient to Induce IRS-1 Degradation
(A) Immunoblot (IB) analysis of whole-cell lysates derived from L6 cells that were serum starved, treated with the indicated inhibitors, and then collected at the indicated time periods following IGF-I stimulation. Asterisk indicates a non-specific band.
(B) L6 cells stably expressing FLAG-IRS-1 (L6: FLAG-IRS-1) were serum starved and then collected at the indicated time periods following IGF-I stimulation. The cell lysates were subjected to immunoprecipitation (IP) with anti-FLAG antibody, and the bound proteins were eluted under denaturing conditions. The denatured fraction was then re-immunoprecipitated (ReIP) with the indicated antibody for ubiquitination assay as described in Transparent Methods. Samples were analyzed by immunoblotting with the indicated antibodies.
(C) L6 cells lacking TSC2 (TSC2 KO) and wild-type (WT) cells were serum starved and then collected at the indicated time periods following IGF-I stimulation. The cell lysates were subjected to immunoblotting with the indicated antibodies. See also Figure S1D.
(D) Immunoblot analysis of whole-cell lysates derived from L6 WT and TSC2 KO cells that were serum starved with the indicated inhibitors for 12 hr.
The data shown are representative of three independent experiments. See also Figure S1.
Previous studies have indicated that the IRS-1 level is markedly reduced in TSC1- and TSC2-deficient MEFs, which exhibit constitutively elevated mTORC1 signaling (Harrington et al., 2004, Shah et al., 2004). We generated TSC2 knockout L6 cells (L6 TSC2 KO cells) by using the CRISPR (clustered regularly interspaced short palindromic repeats)-Cas9 (CRISPR-associated protein 9) system (Figure S1D). Under both IGF-I-unstimulated and stimulated conditions, the IRS-1 levels were dramatically reduced in L6 TSC2 KO cells (Figure 1C). In addition, phosphorylation of Akt was insensitive to IGF-I in these cells, consistent with previous reports (Harrington et al., 2004, Shah et al., 2004). Under serum starvation conditions, treatment with Torin1 and rapamycin restored the IRS-1 levels comparable with those in wild-type cells, whereas treatment with PF-470861 had minor effects (Figure 1D). Thus, activation of mTORC1 is necessary and sufficient to induce IRS-1 degradation.
Cullin1 and β-TRCP1/2 Are Required for IRS-1 Degradation Induced by Prolonged IGF Stimulation
Several RING-type E3 ligases have been reported to ubiquitinate IRS-1 (Nakao et al., 2009, Rui et al., 2002, Shi et al., 2011, Usui et al., 2004, Xu et al., 2008, Yi et al., 2013). We co-expressed IRS-1 together with these E3 ligases or their subunits in 293T cells and analyzed the interaction by co-immunoprecipitation. Among them, Cullin1 strongly bound to IRS-1 (Figure 2A). In addition, small interfering RNA (siRNA)-mediated knockdown of Cullin1, but not of Cullin7 or Fbxw8, significantly inhibited the degradation of IRS-1 induced by prolonged IGF-I stimulation (Figures 2B and S2A), indicating that Cullin1 is required for IGF-I-induced degradation of IRS-1.
Figure 2.

Cullin1 and β-TRCP1/2 Are Required for IRS-1 Degradation Induced by Prolonged IGF Stimulation
(A) HEK293T cells were transfected with Myc-IRS-1 together with the indicated E3 ligase components, and lysates were subjected to anti-FLAG immunoprecipitation (IP) and immunoblotting (IB) with the indicated antibodies.
(B) L6 cells were transfected with siRNA targeting the indicated E3 ligase components, serum starved, and then collected at the indicated time periods following IGF-I stimulation. Asterisk indicates a non-specific band. The knockdown efficiency of Cullin7 and Fbxw8 was validated by quantitative RT-PCR shown in Figure S2A.
(C) FLAG-IRS-1 was transiently expressed in HEK293 cells, and the protein complex of FLAG-IRS-1 was isolated with anti-FLAG immunoprecipitation and subjected to liquid chromatography-tandem mass spectrometry (LC-MS/MS) analysis. The recovered IRS-1-associated proteins and their reproducibility from four independent experiments are shown.
(D) Schematic structure of human β-TRCP1 and β-TRCP2. The substrate recognition site R474 in β-TRCP1 and its homologous site R423 in β-TRCP2 are depicted in red.
(E) HEK293T cells were transfected with Myc-IRS-1 together with the indicated F box proteins, and lysates were subjected to anti-FLAG immunoprecipitation and immunoblotting with the indicated antibodies.
(F) HEK293T cells were transfected with Myc-IRS-1 together with FLAG-β-TRCP2 WT or R423A mutant, and lysates were subjected to anti-FLAG immunoprecipitation and immunoblotting with the indicated antibodies.
(G and H) L6 cells were transfected with two siRNAs targeting β-TRCP1 and β-TRCP2, serum starved, and then collected at the indicated time periods following IGF-I stimulation. The cell lysates were subjected to immunoblotting with the indicated antibodies. The knockdown efficiency of β-TRCP2 was validated by quantitative RT-PCR shown in Figure S2D. Immunoblots of IRS-1 for (G) were quantified, and the graph is shown as mean ± SEM of three independent experiments (*p < 0.05) (H).
(I) L6 cells stably expressing FLAG-IRS-1 (L6: FLAG-IRS-1) were transfected with two siRNAs targeting β-TRCP1 and β-TRCP2, serum starved, and then collected at the indicated time periods following IGF-I stimulation. The cell lysates were subjected to re-immunoprecipitation (ReIP) with anti-FLAG antibody under denatured conditions for ubiquitination assay as described in Transparent Methods. Samples were analyzed by immunoblotting with the indicated antibodies.
The data shown are representative of at least three independent experiments. See also Figures S2 and S3.
Cullin1 is a scaffold protein of the Skp1/Cullin1/F box protein (SCF) E3 ligase complex (Duda et al., 2011).The SCF complex contains, in addition to Cullin1, the RING-finger protein Rbx1, the adaptor protein Skp1, a specific E2 enzyme, and an F box protein that recognizes the specific substrates. Among numerous F box proteins, we identified β-TRCP2 (β-transducin repeat-containing protein 2) as an IRS-1-associated protein by mass spectrometry analysis of proteins co-purified with IRS-1 (Figure 2C). In mammals, a paralog designated as β-TRCP1 is also expressed, which has similar properties in the domain structure as β-TRCP2 (Figure 2D). Co-immunoprecipitation analysis revealed that both β-TRCP1 and β-TRCP2 bound to IRS-1, whereas the interaction of IRS-1 with Fbxo40, a skeletal muscle-specific F box protein of the SCF complex targeting IRS-1 for degradation (Shi et al., 2011), was hardly detected in 293T cells (Figure 2E). In addition, IRS-1 displayed a significantly reduced interaction with β-TRCP2 R423A harboring a point mutation within the substrate interaction site of β-TRCP2, which is homologous to R474A of β-TRCP1 (Wu et al., 2003) (Figures 2D and 2F). To determine whether IRS-1 is targeted by the SCFβ-TRCP1/2 complex for degradation, we assessed IRS-1 protein abundance in cells after depleting β-TRCP1/2. Although knockdown of β-TRCP1 or β-TRCP2 alone had minor effects on the IRS-1 abundance (Figures S2B–S2D), simultaneous knockdown of both β-TRCP1 and β-TRCP2 led to the inhibition of IRS-1 degradation induced by prolonged IGF-I stimulation (Figures 2G and 2H). Furthermore, IGF-I-induced polyubiquitination of IRS-1 was reduced in the β-TRCP (β-TRCP1 and β-TRCP2)-depleted cells (Figure 2I). Collectively, these data indicate that the SCFβ-TRCP E3 ligase complex is required for IGF-I-dependent degradation of IRS-1.
IGF Stimulation Triggers the Interaction of IRS-1 with β-TRCP in an mTORC1-Dependent Manner
We next asked whether IRS-1 degradation induced by mTORC1 activation depends on the SCFβ-TRCP complex. In L6 TSC2 KO cells in which the IRS-1 level is markedly suppressed, knockdown of β-TRCP or Cullin1 restored the IRS-1 levels under serum starvation conditions (Figure 3A), suggesting that constitutively elevated activation of mTORC1 leads to SCFβ-TRCP-mediated degradation of IRS-1. Accumulated evidence has demonstrated that phosphorylation of the degron motif (a specific sequence that directs the recognition of an E3 ligase) in substrates by specific kinase(s) is required for the substrate ubiquitination by the SCFβ-TRCP complex (Frescas and Pagano, 2008, Wang et al., 2014). In agreement with this, IGF-I stimulated the interaction of IRS-1 with β-TRCP1, and treatment with Torin1 completely abolished it (Figure 3B). To a lesser extent, treatment with rapamycin blocked the IGF-I-induced increase in the IRS-1-β-TRCP1 interaction, whereas treatment with PF-470861 had minor effects on it (Figure 3B).
Figure 3.

IGF Stimulation Triggers the Interaction of IRS-1 with β-TRCP in an mTORC1-Dependent Manner
(A) L6 TSC2 KO cells were transfected with siRNAs targeting β-TRCP1+2 or Cullin1 and serum starved with or without Torin1 for 12 hr. The collected cell lysates were subjected to immunoblotting (IB) with the indicated antibodies. Asterisk indicates a non-specific band.
(B) L6 cells stably expressing FLAG-IRS-1 (L6: FLAG-IRS-1) were serum starved, treated with the indicated inhibitors, and then collected at the indicated time periods following IGF-I stimulation. The cell lysates were subjected to immunoprecipitation (IP) and immunoblotting with the indicated antibodies.
The data shown are representative of three independent experiments. See also Figure S3.
We noticed that IGF-I stimulation (1–3 hr) increased the expression of β-TRCP1 in L6 cells (Figures 2G and 2I). Rapamycin and PF-470861 had modest effects, whereas Torin1 significantly inhibited IGF-I-induced upregulation of β-TRCP1 protein levels (Figure S3A). Torin1 also reduced the IGF-I-stimulated increase in β-TRCP1 and β-TRCP2 mRNA levels (Figure S3B), indicating the role of mTOR in positively regulating β-TRCP expression.
Mapping of the Degron-Containing Region in IRS-1
We reasoned that if mTORC1 activation leads to the recruitment of β-TRCP to IRS-1 and subsequent IRS-1 degradation, the mutation of rapamycin/Torin1-responsive Ser/Thr residues in IRS-1 could block its degradation. Ser 302, Ser 307, and Ser 318 in IRS-1 were phosphorylated in an mTOR-dependent manner (Figure S1B). In addition, Ser 522 has been reportedly required for IRS-1 degradation (Xu et al., 2008). However, single mutation of these Ser residues or mutation of all of them could not block IRS-1 degradation induced by prolonged IGF-I stimulation (Figures S4A and S4B), indicating that the known Ser residues of IRS-1 are not necessary for mTORC1-dependent degradation of IRS-1.
We then mapped the corresponding region of IRS-1 involved in its degradation. Using a series of IRS-1 deletion mutants, we examined the abundance of these IRS-1 mutants after prolonged IGF-I stimulation (Figure S4C). Since some IRS-1 mutants exhibited large mobility upshift in SDS-PAGE, we treated the cell lysates with alkaline phosphatase to place them in comparable electrophoretic mobility. The IRS-1 mutants encompassing amino acid residues 1–1,000, 1–600, and 301–1,235, and the full-length (1–1,235) exhibited the degradation 6 hr after IGF-I stimulation, whereas the mutants encompassing amino acid residues 1–500, 1–300, 501–1,235, and 601–1,235 were resistant to the IGF-I-induced degradation (Figure S4D). These data suggest that the region corresponding to amino acid residues 301–500 or 501–600 in IRS-1 is required for its degradation induced by prolonged IGF-I stimulation.
To examine whether Ser/Thr residues in the IRS-1 region corresponding to amino acid residues 301–600 are required for IRS-1 degradation, we first selected putative 48 Ser/Thr residues that are authenticated phosphosites largely based on reported mass spectrometry analyses according to the PhosphoSite program (Hornbeck et al., 2015) (Figure S4E). We then constructed the IRS-1 mutant in which all 48 Ser/Thr residues are substituted with Ala residues (IRS-1 STA 301–600) (Figure 4A). The IRS-1 STA 301–600 mutant was not degraded after prolonged IGF-I stimulation (Figure 4B). We further analyzed two IRS-1 mutants in which the mutation in IRS-1 STA 301–600 was introduced into the region corresponding to amino acid residues 301–500 and 501–600. Although the IRS-1 STA 501–600 level was significantly reduced after prolonged IGF-I stimulation, IRS-1 STA 301–500 failed to undergo IGF-I-stimulated degradation (Figure 4B), revealing the existence of responsible Ser/Thr residues in the IRS-1 301–500 region for the degradation induced by prolonged IGF-I stimulation.
Figure 4.

Ser 422 in IRS-1 Is Required for the Interaction with β-TRCP and IGF-I-Induced Degradation of IRS-1
(A) Schematic illustration of IRS-1 mutants used in (B). The regions colored in orange include the Ala substitution of possible phosphorylated Ser/Thr residues that are authenticated in PhosphoSitePlus. See also Figure S4E.
(B) Immunoblot (IB) analysis of whole-cell lysates derived from L6 cells stably expressing the indicated FLAG-IRS-1 mutants that were serum starved and then collected at the indicated time periods following IGF-I stimulation.
(C) Schematic representation of the candidate β-TRCP recognition sites that are included in the IRS-1 region corresponding to amino acid residues 301–501. The Ser residues colored in red indicate the authenticated phosphosites that are listed in PhosphoSitePlus.
(D) Immunoblot analysis of whole-cell lysates derived from L6 cells stably expressing the indicated FLAG-IRS-1 mutants that were serum starved and then collected at the indicated time periods following IGF-I stimulation.
(E) Amino acid sequence alignment of Ser 422 and its surrounding sequence among IRS-1 proteins of vertebrates. Identical residues are highlighted in gray, a critical Ser for IRS-1 degradation is in red, and Gly, a conserved residue only in IRS-1 but not in IRS-2, is in black.
(F) L6 cells stably expressing the indicated FLAG-IRS-1 mutants were serum starved and then collected at the indicated time periods following IGF-I stimulation. The cell lysates were subjected to immunoprecipitation (IP) and immunoblotting with the indicated antibodies.
(G) Immunoblot analysis of whole-cell lysates derived from L6 cells stably expressing the indicated FLAG-IRS-1 mutants that were serum starved and then collected at the indicated time periods following IGF-I stimulation.
(H) L6 cells stably expressing FLAG-IRS-1 WT, S422A, or empty vector were serum starved and then collected at the indicated time periods following IGF-I stimulation. The cell lysates were subjected to re-immunoprecipitation (ReIP) with anti-FLAG antibody under denatured conditions for ubiquitination assay as described in Transparent Methods. Samples were analyzed by immunoblotting with the indicated antibodies.
The data shown are representative of three independent experiments. See also Figure S4.
Ser 422 in IRS-1 Is Required for the Interaction with β-TRCP and IGF-I-Induced Degradation of IRS-1
The canonical degron recognized by β-TRCP contains the DpSGx(2-4)pS in which Ser residues are phosphorylated (Frescas and Pagano, 2008). In addition, the pSx(2-4)DpSG degron has been demonstrated to be recognized by β-TRCP. These phospho-degrons can diverge from the canonical motifs, with phospho-Ser replacing the acidic residues. The region of IRS-1 responsible for its degradation (amino acid residues 301–500) contains S325DGEGTMS332, S407SAVS412, S412GSPSDG418, and S416DGGFISS423 (Figure 4C). Among these sequences, we mutated the Ser residues, which are authenticated phosphorylation sites in the PhosphoSite program, into Ala (we mutated each Ser residue into Ala in S325A/S332A, S407A/S408A, S412A/S414A, and S422A/S423A, and all eight Ser residues were replaced with Ala in 8SA) and examined IRS-1 levels after IGF-I stimulation. The IRS-1 S422A/S423A mutant, as well as the 8SA mutant, failed to undergo the degradation induced by prolonged IGF-I stimulation (Figure 4D). The S416DGGFISS423 sequence in IRS-1 is highly conserved among vertebrates, whereas they differ from the identical site in IRS-2, including the third residue substitution from Gly to Pro (Figure 4E).
We next determined the critical Ser residue(s) of IRS-1 for β-TRCP recognition of IRS-1 among the S416DGGFISS423 sequence. The IRS-1 mutant S422A, but not S423A, failed to interact with β-TRCP1 in response to IGF-I stimulation (Figure 4F). The IRS-1 S416A mutant showed partial reduction in the interaction with β-TRCP1, although the phosphorylation of IRS-1 Ser 416 has not been reported (Figure 4F). In addition, the IRS-1 S416A, S422A, and S422A/S423A mutants failed to undergo IGF-I-stimulated degradation, whereas the IRS-1 S423A showed similar degradation as the wild-type IRS-1 (Figure 4G). Finally, the IRS-1 S422A mutant failed to undergo IGF-I-stimulated polyubiquitination as revealed by ubiquitination assay (Figure 4H). These results clearly demonstrate that the Ser 422 in IRS-1 is essential for the interaction with β-TRCP and IGF-I-induced degradation of IRS-1.
mTORC1 Phosphorylates Ser 422 of IRS-1 in IGF-Stimulated Cells
We set out to find out how Ser 422 phosphorylation of IRS-1 is regulated. To generate phospho-IRS-1-specific antibody, we chose the S416DGGFI(pS422)(pS423) phospho-peptide as an antigen since the dual phosphorylated, but neither individually phosphorylated, peptide has been identified by the previous phosphoproteomic study (Humphrey et al., 2013). We confirmed that this antibody selectively recognized phosphorylated IRS-1 but not the S422A/S423A mutant of IRS-1 nor dephosphorylated IRS-1 treated with alkaline phosphatase in vitro (Figure 5A). The phospho-IRS-1 (S422/S423) antibody detected significantly less of the S422A or S423 mutant of IRS-1 than wild-type IRS-1, suggesting that this antibody recognizes dual phosphorylation of Ser 422 and Ser 423 (Figure 5A). As expected, IGF-I stimulation increased IRS-1 Ser 422/Ser 423 phosphorylation in L6 cells (Figures 5A and 5B). Torin1 treatment completely abolished their phosphorylation of endogenous IRS-1, and rapamycin blocked their IGF-I-dependent increase, whereas PF-470861 did not significantly affect them (Figure 5B). The IGF-I-induced increase in Ser 422/Ser 423 phosphorylation of IRS-1 was also found to be sensitive to Torin1 and rapamycin in MEFs and primary mouse myoblasts (Figures S5A–S5C). Time course analyses revealed that IRS-1 Ser 422/Ser 423 phosphorylation was induced at a later period of IGF-I stimulation compared with Tyr and Ser 307 phosphorylation of IRS-1 and that the IRS-1 binding to β-TRCP1 followed the change in IRS-1 Ser 422/Ser 423 phosphorylation (Figures 5C and 5D).
Figure 5.

mTORC1 Phosphorylates Ser 422 of IRS-1 in IGF-Stimulated Cells
(A) p-IRS-1 (S422/S423) antibody preferentially recognizes S422/S423-phosphorylated IRS-1. L6 cells stably expressing the indicated FLAG-IRS-1 mutants were serum starved and then collected at the indicated time periods following IGF-I stimulation. FLAG-IRS-1 was immunoprecipitated (IP), and one set of the WT immunoprecipitates was treated with calf intestine alkaline phosphatase (CIP). The immunoprecipitated IRS-1 phosphorylation and protein levels were then detected by immunoblotting (IB) with anti-p-IRS-1 (S422/S423) antibody and anti-FLAG antibody, respectively.
(B) L6 cells were serum starved, treated with the indicated inhibitors, and then collected at the indicated time periods following IGF-I stimulation. The endogenous IRS-1 proteins were immunoprecipitated, and one set of the immunoprecipitates was treated with CIP. The immunoprecipitated IRS-1 phosphorylation and S6K1/S6 phosphorylation were analyzed by immunoblotting with the indicated antibodies.
(C and D) L6 cells stably expressing FLAG-IRS-1 (L6: FLAG-IRS-1) were serum starved and then collected at the indicated time periods following IGF-I stimulation. The cell lysates were subjected to immunoprecipitation and immunoblotting with the indicated antibodies (C). Immunoblots of Tyr, Ser 307, and Ser 422/Ser 423 phosphorylation of IRS-1, and p85 PI3K and β-TRCP1 binding to IRS-1 for (C) were quantified and their time-dependent changes are shown in the graph (D).
(E) L6 cells were transfected with siRNA targeting Raptor or Rictor, serum starved, treated with or without Torin1, and then collected at the indicated time periods following IGF-I stimulation. The cell lysates were subjected to immunoprecipitation and immunoblotting with the indicated antibodies.
(F) L6 cells stably expressing FLAG-IRS-1 were serum starved and then collected at the indicated time periods following IGF-I stimulation. The cell lysates were subjected to immunoprecipitation and immunoblotting with the indicated antibodies against mTOR complex components. See also Figures S5E and S5F.
(G) In vitro phosphorylation of IRS-1 S422/S423 by mTOR. An active mutant FLAG-mTORSL1+IT and FLAG-GFP were expressed in HEK293T cells and were immunoprecipitated with anti-FLAG antibody. The substrates GST-IRS-1 fragment (amino acid residues 256–443), GST-4EBP1, and GST were expressed and purified from Escherichia coli. The kinase reaction was carried out as described in Transparent Methods. The phosphorylation levels of IRS-1 and 4EBP1 were analyzed by immunoblotting with anti-p-IRS-1 (S422/S423) antibody and p-4EBP1 (T37/46) antibody, respectively. The total amounts of recombinant proteins used were examined by Coomassie Brilliant Blue (CBB) staining. See also Figure S5G.
The data shown are representative of three independent experiments except Figures 5D and 5E being from two independent experiments. See also Figure S5.
We next sought to determine whether mTOR requires Raptor, an obligatory mTORC1 component, to phosphorylate IRS-1. In L6 cells, siRNA-mediated knockdown of Raptor significantly reduced basal and IGF-I-induced Ser 422/Ser 423 phosphorylation of IRS-1 (Figure 5E), indicating that mTORC1 is required for Ser 422/Ser 423 phosphorylation of IRS-1. In addition to IGF-I, amino acids are potent activators for mTORC1. In line with this, deprivation of amino acids diminished the basal phosphorylation of IRS-1 Ser 422/Ser 423, and amino acid stimulation, albeit to a lesser degree than IGF-I, induced phosphorylation of IRS-1 Ser 422/Ser 423 (Figure S5D). We also examined the contribution of mTORC2 to the IRS-1 phosphorylation by knocking down Rictor, an mTORC2-specific component. Although the Ser 422/Ser 423 phosphorylation of IRS-1 was modestly reduced in Rictor-depleted cells, mTORC1 activity monitored by Thr 389 phosphorylation of S6K1 was partly reduced probably due to impaired Akt activity in this context (Figure 5E), implying the possible role of mTORC2 in directly or indirectly phosphorylating IRS-1.
To gain further insight into mTORC1-dependent phosphorylation of IRS-1 Ser 422/Ser 423, we next examined the interaction of IRS-1 with mTORC1. Co-immunoprecipitation analysis revealed that mTOR and Raptor, but not Rictor, bound to IRS-1 (Figure 5F). We also found that FLAG-tagged Raptor bound to IRS-1 in HEK293T cells (Figure S5E). Using IRS-1 truncated mutants we mapped the region following the PTB domain (amino acid residues 260–542), which is necessary for the co-immunoprecipitation with mTOR and Raptor (Figure S5F). This region contains the SAIN (Shc and IRS-1 NPXY binding) domain, which has reportedly mediated the mTORC1 binding to IRS-1 (Tzatsos, 2009). Since Raptor is a scaffold that recruits downstream substrates to mTORC1 (Kim et al., 2002), we hypothesized that mTORC1 could directly phosphorylate Ser 422 of IRS-1. We purified GST-fused IRS-1a.a.256−443 from Escherichia coli and mTOR complex containing an active mTOR mutant (mTORSL1+IT) from HEK293T cells (Ohne et al., 2008) and then subjected them to in vitro kinase assay (Figure S5G). Phosphorylation of Ser 422/Ser 423 in IRS-1 as well as a known mTORC1 substrate 4EBP1 was remarkably enhanced when incubated with the mTOR immunoprecipitates (Figure 5G). These data indicate that mTORC1 phosphorylates Ser 422 of IRS-1 in IGF-stimulated cells.
Expression of IRS-1 S422A Mutant Restores IGF-I Sensitivity in Cells Lacking TSC2
We next assessed whether Ser 422 phosphorylation-dependent degradation of IRS-1 causes insulin/IGF resistance in TSC2-deficient cells. To test this idea, we generated L6 TSC2 KO cells stably expressing IRS-1 S422A as well as IRS-1 WT (Figure 6A). Expression of IRS-1 S422A was significantly higher than that of IRS-1 WT in these cells under basal conditions (Figure 6B), which reflected their abilities to undergo mTORC1-dependent degradation. TSC2 KO cells expressing empty vector failed to phosphorylate Akt and its direct substrate FoxO1/3a in response to high-dose IGF-I (100 ng/mL), whereas rescue with TSC2 restored the sensitivity (Figure 6C). In the TSC2 KO cells expressing IRS-1 WT, phosphorylation of Akt and FoxO1/3a was not induced by low-dose IGF-I (20 ng/mL) (Figure 6C). Importantly, the TSC2 KO cells expressing IRS-1 S422A mutant could in part respond to low-dose IGF-I to phosphorylate Akt and FoxO1/3a (Figures 6C and 6D). We also compared the Akt signaling in the TSC2 KO cells expressing the IRS-1 4SA mutant, in which Ser 302, Ser 307, Ser 318, and Ser 522, which were phosphosites sensitive to mTOR inhibitors but were dispensable for degradation, are mutated to Ala (Figure 6A). The expression level of IRS-1 4SA was significantly lower than that of IRS-1 S422A in the TSC2 KO cells (Figure 6B). In addition, the TSC2 KO cells expressing IRS-1 4SA failed to respond to low-dose IGF-I for phosphorylation of Akt and FoxO1/3a to an extent similar to IRS-1 WT-expressing cells (Figures 6C and 6D), indicating that phosphorylation of Ser 422, but not other mTORC1 target sites, is responsible for mTORC1-mediated inhibition of Akt signaling in the TSC2-deficient state.
Figure 6.

Expression of IRS-1 S422A Mutant Restores IGF-I Sensitivity in Cells Lacking TSC2
(A) Schematic illustration of wild-type (WT) IRS-1, IRS-1 S422A, and 4SA mutants.
(B) Immunoblot (IB) analysis of whole-cell lysates derived from L6 TSC2 KO cells stably expressing TSC2, FLAG-IRS-1 WT, S422A, 4SA, or empty vector that were serum starved and then collected at 1 hr following Torin1 stimulation.
(C and D) Immunoblot analysis of whole-cell lysates derived from L6 TSC2 KO cells stably expressing TSC2, FLAG-IRS-1 WT, S422A, 4SA, or empty vector that were serum starved and then collected at 5 min following IGF-I stimulation at the indicated concentration (C). Immunoblots of Akt and FoxO1/3a phosphorylation for (C) were quantified, and the graph is shown as mean ± SEM of four independent experiments (*p < 0.05, **p < 0.01, ***p < 0.001) (D).
(E) Effects of expression of TSC2 or IRS-1 mutants on IGF-I-induced DNA synthesis in L6 TSC2 KO cells. L6 TSC2 KO cells stably expressing TSC2, FLAG-IRS-1 WT, S422A, 4SA, or empty vector were serum starved and then treated with IGF-I at the indicated concentration for 12 hr. [3H]Thymidine incorporation into DNA during 8–12 hr of IGF-I stimulation was measured. The graph is shown as mean ± SEM (n = 4; **p < 0.01).
(F) L6 TSC2 KO cells stably expressing TSC2, FLAG-IRS-1 WT, S422A, 4SA, or empty vector were placed in serum-free medium with or without IGF-I at the indicated concentration for 6 hr. The collected cell lysates were subjected to immunoblotting with the indicated antibodies. See also Figure S6A.
The data shown are representative of at least three independent experiments. See also Figure S6.
Since Akt signaling supports IGF-I-mediated cell proliferation and cell survival, we analyzed the growth and survival responses to IGF-I in L6 TSC2 KO cells expressing IRS-1 mutants. By measuring IGF-I-stimulated DNA synthesis, we found that TSC2 KO cells expressing IRS-1 S422A as well as TSC2-rescued cells showed growth response to low-dose IGF-I, whereas TSC2 KO cells expressing IRS-1 WT and 4SA as well as expressing empty vector only could not (Figure 6E).
The anti-apoptotic program induced by IGF-I is severely compromised in the TSC2-deficient state (Shah et al., 2004). We confirmed that IGF-I could not inhibit serum-starvation-induced cleavage of Caspase3 and its substrate PARP1 in L6 TSC2 KO cells and that rescue with TSC2 in these cells restored the anti-apoptotic effect of IGF-I (Figure 6F). We also observed that low-dose IGF-I inhibited cleavage of Caspase3 and PARP1 in TSC2 KO cells expressing IRS-1 S422A but not IRS-1 WT nor 4SA (Figure 6F). Similar trends in IGF-I-mediated cell survival response were observed by analyzing Annexin V-positive apoptotic cells using flow cytometry (Figure S5A). These data collectively indicate that expression of IRS-1 S422A, but not of IRS-1 WT or 4SA, effectively restores the growth and survival responses to IGF through Akt activation in the TSC2-deficient state (Figure S6B).
Inhibition of Ser 422 Phosphorylation-Dependent IRS-1 Degradation Promotes Sustained Akt Activation in IGF-Stimulated Cells
Previous studies have demonstrated that long-term IGF/insulin stimulation induces IRS-1 degradation with a concomitant decrease in Akt activity in various types of cells (Haruta et al., 2000, Kim et al., 2012, Shi et al., 2011, Yoneyama et al., 2018). To investigate how mTORC1- and SCFβ-TRCP-mediated degradation of IRS-1 influences IGF signaling, we knocked down β-TRCP in L6 cells to inhibit IGF-I-stimulated degradation of IRS-1. Although phosphorylation of Akt was gradually decreased upon prolonged IGF-I stimulation in control cells, loss of β-TRCP resulted in sustained Akt phosphorylation (Figures 7A and 7B). We also found that expression of IRS-1 S422A, but not of IRS-1 WT, promoted sustained Akt phosphorylation up to 12 hr stimulation of IGF-I in L6 cells (Figures 7C and 7D). These data indicate that inhibition of IRS-1 degradation can enhance sustained activation of Akt in response to IGF.
Figure 7.

Inhibition of Ser 422 Phosphorylation-Dependent IRS-1 Degradation Promotes Sustained Akt Activation in IGF-Stimulated Cells
(A and B) L6 cells were transfected with two siRNAs targeting β-TRCP1 and β-TRCP2, serum starved, and then collected at the indicated time periods following IGF-I stimulation. The cell lysates were subjected to immunoblotting (IB) with the indicated antibodies (A). Immunoblots of Akt phosphorylation for (A) were quantified, and the graph is shown as mean ± SEM of four independent experiments (*p < 0.05) (B).
(C and D) Immunoblot analysis of whole-cell lysates derived from L6 cells stably expressing FLAG-IRS-1 WT, S422A, or empty vector that were serum starved and then collected at the indicated time periods following IGF-I stimulation (C). Immunoblots of Akt phosphorylation for (C) were quantified, and the graph is shown as mean ± SEM of three independent experiments (*p < 0.05, **p < 0.01) (D).
(E) Model for temporal regulation of mTORC1-mediated IRS-1 degradation and the PI3K/Akt signaling following IGF stimulation. The figure depicts the interplay of mTORC1-induced Ser 422 phosphorylation of IRS-1, SCFβ-TRCP-mediated ubiquitination of IRS-1, and downregulation of the PI3K/Akt signaling as a function of time following the stimulation. See text for details.
Discussion
IRS-1 function is regulated through complex mechanisms involving phosphorylation of at least 70 Ser/Thr residues within its C-terminal tail region (Copps and White, 2012). Since insulin/IGF-stimulated downstream kinases phosphorylate Ser/Thr residues in IRS-1, the autologous Ser/Thr phosphorylation of IRS-1 is in general regarded as a feedback loop to tightly regulate the strength or duration of the insulin/IGF signaling (Harrington et al., 2005). The data we presented in this study reveal that Ser 422 of IRS-1, which has no previously characterized regulatory role, is critical for mTORC1-mediated degradation of IRS-1. The mechanism is as follows. IGF stimulates mTORC1, which then phosphorylates Ser 422 of IRS-1. Phosphorylation of Ser 422 creates the binding site of the SCFβ-TRCP E3 ligase in IRS-1, leading to subsequent ubiquitination and degradation of IRS-1. Our study reveals that mTORC1-mediated degradation of IRS-1 is a regulatory node determining the duration of IGF signaling (Figure 7E).
Multiple lines of evidence support the conclusion that Ser 422 is a bona fide target phosphorylation site of mTORC1. First, Torin1 and rapamycin inhibited IGF-I-induced phosphorylation of IRS-1 Ser 422 (Figure 5B). Second, knockdown of Raptor resulted in the loss of this phosphorylation under both basal and IGF-I-stimulated conditions, which was also caused by Torin1 (Figure 5E). Third, serum and amino acid starvation reduced the basal phosphorylation of IRS-1 Ser 422, and the add-back of amino acids increased it (Figure S5D). Fourth, the binding of Raptor, but not Rictor, to IRS-1 was detected (Figure 5F). These data suggest that mTORC1 is a major kinase for IRS-1 Ser 422. Considering the fact that Torin1, as well as rapamycin in the case of long-term treatment (Sarbassov et al., 2006), inhibits both mTORC1 and mTORC2, we also evaluated the effect of Rictor knockdown on IRS-1 Ser 422 phosphorylation. Rictor knockdown partially reduced it in IGF-I-stimulated cells (Figure 5E). In our assay, Rictor knockdown inhibited IGF-I-induced phosphorylation of Akt Ser 473, a target site by mTORC2, and also weakly inhibited phosphorylation of S6K1, indicating either a direct or an indirect (mTORC1-mediated) role of mTORC2 in IRS-1 phosphorylation. Further examination of mTORC2 contribution to IRS-1 Ser 422 phosphorylation is required. We also show that IRS-1 interacts with mTORC1 via the SAIN domain (Figures 5F and S5F). Although this interaction was not enhanced by IGF-I, mTORC1 was still active under serum starvation conditions in our setup as judged by S6K1 phosphorylation (Figure S5D), possibly explaining the detected interaction between IRS-1 and active mTORC1 under either unstimulated or stimulated conditions.
Both mTORC1 and S6K1 could phosphorylate IRS-1 in vitro (Harrington et al., 2004, Tzatsos and Kandror, 2006). We showed that IRS-1 degradation induced by prolonged IGF-I stimulation was inhibited by rapamycin and Torin1 but not by the S6K1 inhibitor PF-470861 (Figure 1). In addition, the pharmacological inhibition of S6K1 did not influence Ser 422 phosphorylation of IRS-1 in IGF-I-stimulated cells (Figure 5B), indicating the negligible role of S6K1 activity in IRS-1 degradation. In contrast, RNAi-mediated knockdown of S6K1/2 has reportedly rescued the decrease in IRS-1 protein abundance with the concomitant increase in IRS-1 mRNA expression in TSC2 knockout MEFs (Harrington et al., 2004). This indicates that rapid inhibition of S6K1 by PF-470861, as evident in ablated phosphorylation of its major substrate S6 (Figure 1A), may not influence IRS-1 transcription, whereas chronic inhibition of S6K1/2 by RNAi may affect IRS-1 transcription but not the protein degradation, resulting in the observed IRS-1 protein increase. Therefore, S6K1 is unlikely to trigger IRS-1 degradation under physiological conditions like persistent insulin/IGF stimuli, although S6K1 mediates a negative feedback in ways other than IRS-1 degradation as reportedly shown in S6K1 knockout mice (Um et al., 2004).
Although several RING-type E3 ligases have been reported to ubiquitinate IRS-1 (Nakao et al., 2009, Rui et al., 2002, Shi et al., 2011, Usui et al., 2004, Xu et al., 2008, Yi et al., 2013), none of them have been proved to induce mTORC1-dependent degradation of IRS-1 as a negative feedback regulator of insulin/IGF signaling. The Cullin7/Fbxw8 complex has been reported to target Ser-phosphorylated IRS-1 (Kim et al., 2012, Xu et al., 2008). However, our study showed that neither knockdown of Cullin7 nor of Fbxw8 inhibited IRS-1 degradation induced by prolonged IGF-I stimulation (Figure 2B). Similar results have been shown by another group that used the skeletal muscle cell line C2C12 (Shi et al., 2011). In a report discovering the Cullin1-containing complex that targets IRS-1 for degradation, the RNAi screening has identified a skeletal-muscle-specific Fbxo40 as the F box protein required for IRS-1 degradation in the differentiated myotubes (Shi et al., 2011), which could not yet explain the IRS-1 degradation observed in other cell types. In this study we identified β-TRCP as the F box protein of the SCF complex responsible for IRS-1 degradation. β-TRCP is expressed ubiquitously (Frescas and Pagano, 2008, Wang et al., 2014). Importantly, the interaction of IRS-1 with β-TRCP is dependent on mTORC1-mediated phosphorylation of Ser 422, which was validated in L6 cells in this study. Although the roles of mTORC1 for the β-TRCP recruitment to IRS-1 and the IRS-1 degradation in other cell types remain to be determined, the regulation coupled with SCFβ-TRCP and mTORC1 could be a common mechanism for IRS-1 degradation.
Many studies have revealed that constitutive activation of the mTORC1/S6K cascade, as exemplified in TSC1/2-depleted cells, blocks the PI3K/Akt signaling activated by insulin and IGF. This negative feedback includes inhibition of insulin/IGF-I receptor kinases by mTORC1-dependent stabilization of Grb10 (Hsu et al., 2011, Yu et al., 2011), inhibition of mTORC2 by mTORC1-dependent phosphorylation of Sin1 (Liu et al., 2013), and inhibition of IGF ligand ability by mTORC1-dependent induction of IGF-binding protein 5 (IGFBP5) secretion (Ding et al., 2016). Our study revealed how the degradation of IRS-1 contributes to the ablated sensitivity to insulin/IGF. Expression of the degradation-resistant IRS-1 S422A mutant in TSC2 knockout cells restored the sensitivity to IGF-I in part, which was confirmed by phosphorylation of Akt, DNA synthesis, and protection of starvation-induced apoptosis (Figure 6), suggesting that mTORC1-induced degradation of IRS-1 downregulates IGF-stimulated PI3K/Akt signaling in this context. As shown in Figure S1B, the effect of mTORC1 is not specific for IRS-1 Ser 422 but is also observed in other residues, including Ser 302, Ser 307, and Ser 318. It is worth noting that the sensitivity to IGF-I in TSC2 knockout cells was not restored when the non-degradation-resistant IRS-1 4SA mutant, in which known phosphosites Ser 302, Ser 307, Ser 318, and Ser 522 are mutated into Ala, was expressed at a level comparable with that of IRS-1 WT. Although phosphorylation of these Ser residues has been reported to negatively regulate IRS-1 function (Copps and White, 2012), degradation of IRS-1 via Ser 422 phosphorylation likely plays a predominant role in suppressing the signaling function of IRS-1 in the cells with constitutive mTORC1 activation (Figure S6B). Since TSC2 knockout cells expressing the IRS-1 S422A did not fully restore IGF signaling (Figure 6), other mechanisms should contribute to the mTORC1-mediated inhibition of IGF signaling. In particular, mTORC1-induced secretion of IGFBP5 is a possible candidate for this because our study used the same TSC2 knockout model as a previous study discovering the link between mTORC1 and IGFBP5 (Ding et al., 2016).
The stability of IRS-1 could reflect how long Akt activity is sustained upon IGF stimulation. In line with this, IGF-I-induced phosphorylation of Akt was more sustained when mTORC1-mediated degradation of IRS-1 was inhibited by two independent ways, knockdown of β-TRCP and expression of IRS-1 S422A (Figures 7A–7D). Several lines of evidence have demonstrated that the Akt signaling utilizes different temporal patterns in response to specific stimuli and decodes selective downstream substrates to regulate complex cellular behaviors (Gross and Rotwein, 2016, Kubota et al., 2012). Indeed, a mathematical modeling study has demonstrated that the Akt signaling to FoxO selectively responds to the sustainability but not the amplitude of Akt activity in response to the ligands (Kubota et al., 2012). Therefore, our study indicates that mTORC1-mediated control of IRS-1 degradation encodes the temporal Akt signaling, leading to selective regulation of insulin/IGF actions (Figure 7E).
Deregulation of the negative feedback loop between IRS-1 and the mTORC1 cascade appears to affect several pathogenic conditions. Obese or high-fat-diet-fed mice display elevated mTORC1 signaling and insulin resistance in various tissues, probably due to hyperinsulinemia and excessive nutrients such as amino acids (Khamzina et al., 2005). The enhanced mTORC1 cascade could induce peripheral insulin resistance because of the over-driving feedback inhibition of IRS-1. However, this model still has many challenges, as some reports have suggested that the upstream signaling defect, including IRS-1 degradation, is a consequence of insulin resistance rather than a cause (Hoehn et al., 2008). In addition, mTORC1-dependent suppression of insulin and mTORC2 signaling is an important hallmark of pancreatic β cells under conditions of increased β cell stress and metabolic demands in diabetes (Ardestani et al., 2018). Future studies to determine whether obesity or metabolic stresses affect IRS-1 Ser 422 phosphorylation in insulin-sensitive tissues and β cells could address these issues. Hyperactivation of the mTORC1 cascades is a hallmark in many types of cancers (Menon and Manning, 2008). mTOR inhibitors have been in trial for anti-tumor drugs, but the relief of feedback inhibition of the PI3K/Akt pathway that occurs with mTORC1 inhibition paradoxically could activate Akt and promote cell survival, which may partly account for the limited success of mTOR inhibitors. In line with this idea, mTOR inhibitor treatment upregulates the PI3K/Akt signaling dependent on the insulin/IGF-I receptor pathway in different cancer cell lines (Rodrik-Outmezguine et al., 2011, Wan et al., 2007, Yoon et al., 2017). Although our study did not use cancer cells, these observations raise the idea of a potential role for the mTORC1-IRS-1 feedback cascade in cancer survival strategy, which should be tested in the appropriate model. Our study provides an experimental framework for understanding how mTORC1-mediated control of IRS-1 turnover contributes to insulin resistance and tumor resistance to mTOR inhibitors.
Methods
All methods can be found in the accompanying Transparent Methods supplemental file.
Acknowledgments
We thank Dr. Toshiaki Fukushima (Tokyo Institute of Technology) for technical advice and valuable discussion. We also thank members of the Takahashi laboratory for valuable support and discussion and Dr. Susan Hall (University of North Carolina) for critically reading the manuscript. This work was supported in part by Grants-in-Aid for the Japan Society for the Promotion of Science (JSPS) Fellows and for Young Scientists (B) #15K18766 from JSPS to Y.Y.; Grant-in-Aid for Scientific Research (B) #17H03802 from JSPS to T.M.; Grant-in-Aid for Scientific Research (S) #25221204 and Scientific Research (A) #18H03972, and Core-to-core program A. A. Advanced Research Networks from JSPS to S.-I.T.
Author Contributions
Y.Y., T.I., F.H., and S.-I. T. designed the experiments. Y.Y., T.I., and S.-I.I. performed the experiments. Y.Y., K.C., S.-I.I., T.N., T.M., F.H., and S.-I.T. contributed materials and analysis tools. Y.Y., F.H., and S.-I.T. wrote the paper.
Declaration of Interests
The authors declare no competing interests.
Published: July 27, 2018
Footnotes
Supplemental Information includes Transparent Methods, six figures, and two tables and can be found with this article online at https://doi.org/10.1016/j.isci.2018.06.006.
Supplemental Information
References
- Ardestani A., Lupse B., Kido Y., Leibowitz G., Maedler K. mTORC1 signaling: a double-edged sword in diabetic β cells. Cell Metab. 2018;27:314–331. doi: 10.1016/j.cmet.2017.11.004. [DOI] [PubMed] [Google Scholar]
- Berg C.E., Lavan B.E., Rondinone C.M. Rapamycin partially prevents insulin resistance induced by chronic insulin treatment. Biochem. Biophys. Res. Commun. 2002;293:1021–1027. doi: 10.1016/S0006-291X(02)00333-9. [DOI] [PubMed] [Google Scholar]
- Copps K.D., White M.F. Regulation of insulin sensitivity by serine/threonine phosphorylation of insulin receptor substrate proteins IRS1 and IRS2. Diabetologia. 2012;55:2565–2582. doi: 10.1007/s00125-012-2644-8. [DOI] [PMC free article] [PubMed] [Google Scholar]
- Ding M., Bruick R.K., Yu Y. Secreted IGFBP5 mediates mTORC1-dependent feedback inhibition of IGF-1 signalling. Nat. Cell Biol. 2016;18:319–327. doi: 10.1038/ncb3311. [DOI] [PMC free article] [PubMed] [Google Scholar]
- Duda D.M., Scott D.C., Calabrese M.F., Zimmerman E.S., Zheng N., Schulman B.A. Structural regulation of cullin-RING ubiquitin ligase complexes. Curr. Opin. Struct. Biol. 2011;21:257–264. doi: 10.1016/j.sbi.2011.01.003. [DOI] [PMC free article] [PubMed] [Google Scholar]
- Frescas D., Pagano M. Deregulated proteolysis by the F-box proteins SKP2 and β-TrCP: tipping the scales of cancer. Nat. Rev. Cancer. 2008;8:438–449. doi: 10.1038/nrc2396. [DOI] [PMC free article] [PubMed] [Google Scholar]
- Gross S.M., Rotwein P. Mapping growth-factor-modulated Akt signaling dynamics. J. Cell Sci. 2016;129:2052–2063. doi: 10.1242/jcs.183764. [DOI] [PMC free article] [PubMed] [Google Scholar]
- Harrington L.S., Findlay G.M., Gray A., Tolkacheva T., Wigfield S., Rebholz H., Barnett J., Leslie N.R., Cheng S., Shepherd P.R. The TSC1-2 tumor suppressor controls insulin-PI3K signaling via regulation of IRS proteins. J. Cell Biol. 2004;166:213–223. doi: 10.1083/jcb.200403069. [DOI] [PMC free article] [PubMed] [Google Scholar]
- Harrington L.S., Findlay G.M., Lamb R.F. Restraining PI3K: mTOR signalling goes back to the membrane. Trends Biochem. Sci. 2005;30:35–42. doi: 10.1016/j.tibs.2004.11.003. [DOI] [PubMed] [Google Scholar]
- Hartley D., Cooper G.M. Role of mTOR in the degradation of IRS-1: regulation of PP2A activity. J. Cell. Biochem. 2002;85:304–314. doi: 10.1002/jcb.10135. [DOI] [PubMed] [Google Scholar]
- Haruta T., Uno T., Kawahara J., Takano A., Egawa K., Sharma P.M., Olefsky J.M., Kobayashi M. A rapamycin-sensitive pathway down-regulates insulin signaling via phosphorylation and proteasomal degradation of insulin receptor substrate-1. Mol. Endocrinol. 2000;14:783–794. doi: 10.1210/mend.14.6.0446. [DOI] [PubMed] [Google Scholar]
- Hoehn K.L., Hohnen-Behrens C., Cederberg A., Wu L.E., Turner N., Yuasa T., Ebina Y., James D.E. IRS1-independent defects define major nodes of insulin resistance. Cell Metab. 2008;7:421–433. doi: 10.1016/j.cmet.2008.04.005. [DOI] [PMC free article] [PubMed] [Google Scholar]
- Hornbeck P.V., Zhang B., Murray B., Kornhauser J.M., Latham V., Skrzypek E. PhosphoSitePlus, 2014: mutations, PTMs and recalibrations. Nucleic Acids Res. 2015;43:D512–D520. doi: 10.1093/nar/gku1267. [DOI] [PMC free article] [PubMed] [Google Scholar]
- Hsu P.P., Kang S.A., Rameseder J., Zhang Y., Ottina K.A., Lim D., Peterson T.R., Choi Y., Gray N.S., Yaffe M.B. The mTOR-regulated phosphoproteome reveals a mechanism of mTORC1-mediated inhibition of growth factor signaling. Science. 2011;332:1317–1322. doi: 10.1126/science.1199498. [DOI] [PMC free article] [PubMed] [Google Scholar]
- Huang C., Thirone A.C.P., Huang X., Klip A. Differential contribution of insulin receptor substrates 1 versus 2 to insulin signaling and glucose uptake in L6 myotubes. J. Biol. Chem. 2005;280:19426–19435. doi: 10.1074/jbc.M412317200. [DOI] [PubMed] [Google Scholar]
- Humphrey S.J., Yang G., Yang P., Fazakerley D.J., Stöckli J., Yang J.Y., James D.E. Dynamic adipocyte phosphoproteome reveals that Akt directly regulates mTORC2. Cell Metab. 2013;17:1009–1020. doi: 10.1016/j.cmet.2013.04.010. [DOI] [PMC free article] [PubMed] [Google Scholar]
- Inoki K., Li Y., Zhu T., Wu J., Guan K.-L. TSC2 is phosphorylated and inhibited by Akt and suppresses mTOR signalling. Nat. Cell Biol. 2002;4:648–657. doi: 10.1038/ncb839. [DOI] [PubMed] [Google Scholar]
- Khamzina L., Veilleux A., Bergeron S., Marette A. Increased activation of the mammalian target of rapamycin pathway in liver and skeletal muscle of obese rats: possible involvement in obesity-linked insulin resistance. Endocrinology. 2005;146:1473–1481. doi: 10.1210/en.2004-0921. [DOI] [PubMed] [Google Scholar]
- Kim D.-H., Sarbassov D.D., Ali S.M., King J.E., Latek R.R., Erdjument-Bromage H., Tempst P., Sabatini D.M. mTOR interacts with raptor to form a nutrient-sensitive complex that signals to the cell growth machinery. Cell. 2002;110:163–175. doi: 10.1016/s0092-8674(02)00808-5. [DOI] [PubMed] [Google Scholar]
- Kim S.J., DeStefano M.A., Oh W.J., Wu C., Vega-Cotto N.M., Finlan M., Liu D., Su B., Jacinto E. mTOR complex 2 regulates proper turnover of insulin receptor Substrate-1 via the ubiquitin ligase subunit Fbw8. Mol. Cell. 2012;48:875–887. doi: 10.1016/j.molcel.2012.09.029. [DOI] [PMC free article] [PubMed] [Google Scholar]
- Kubota H., Noguchi R., Toyoshima Y., Ozaki Y., Uda S., Watanabe K., Ogawa W., Kuroda S. Temporal coding of insulin action through multiplexing of the AKT pathway. Mol. Cell. 2012;46:820–832. doi: 10.1016/j.molcel.2012.04.018. [DOI] [PubMed] [Google Scholar]
- Lee A.V., Gooch J.L., Oesterreich S., Guler R.L., Yee D. Insulin-like growth factor I-induced degradation of insulin receptor substrate 1 is mediated by the 26S proteasome and blocked by phosphatidylinositol 3’-kinase inhibition. Mol. Cell. Biol. 2000;20:1489–1496. doi: 10.1128/mcb.20.5.1489-1496.2000. [DOI] [PMC free article] [PubMed] [Google Scholar]
- Liu P., Gan W., Inuzuka H., Lazorchak A.S., Gao D., Arojo O., Liu D., Wan L., Zhai B., Yu Y. Sin1 phosphorylation impairs mTORC2 complex integrity and inhibits downstream Akt signalling to suppress tumorigenesis. Nat. Cell Biol. 2013;15:1340–1350. doi: 10.1038/ncb2860. [DOI] [PMC free article] [PubMed] [Google Scholar]
- Ma X.M., Blenis J. Molecular mechanisms of mTOR-mediated translational control. Nat. Rev. Mol. Cell Biol. 2009;10:307–318. doi: 10.1038/nrm2672. [DOI] [PubMed] [Google Scholar]
- Manning B.D., Cantley L.C. AKT/PKB signaling: navigating downstream. Cell. 2007;129:1261–1274. doi: 10.1016/j.cell.2007.06.009. [DOI] [PMC free article] [PubMed] [Google Scholar]
- Manning B.D., Tee A.R., Logsdon M.N., Blenis J., Cantley L.C. Identification of the tuberous sclerosis complex-2 tumor suppressor gene product tuberin as a target of the phosphoinositide 3-kinase/Akt pathway. Mol. Cell. 2002;10:151–162. doi: 10.1016/s1097-2765(02)00568-3. [DOI] [PubMed] [Google Scholar]
- Menon S., Dibble C.C., Talbott G., Hoxhaj G., Valvezan A.J., Takahashi H., Cantley L.C., Manning B.D. Spatial control of the TSC complex integrates insulin and nutrient regulation of mTORC1 at the lysosome. Cell. 2014;156:771–785. doi: 10.1016/j.cell.2013.11.049. [DOI] [PMC free article] [PubMed] [Google Scholar]
- Menon S., Manning B.D. Common corruption of the mTOR signaling network in human tumors. Oncogene. 2008;27:S43–S51. doi: 10.1038/onc.2009.352. [DOI] [PMC free article] [PubMed] [Google Scholar]
- Myers M.G., Zhang Y., Aldaz G.A., Grammer T., Glasheen E.M., Yenush L., Wang L.M., Sun X.J., Blenis J., Pierce J.H., White M.F. YMXM motifs and signaling by an insulin receptor substrate 1 molecule without tyrosine phosphorylation sites. Mol. Cell. Biol. 1996;16:4147–4155. doi: 10.1128/mcb.16.8.4147. [DOI] [PMC free article] [PubMed] [Google Scholar]
- Nakae J., Kido Y., Accili D. Distinct and overlapping functions of insulin and IGF-I receptors. Endocr. Rev. 2001;22:818–835. doi: 10.1210/edrv.22.6.0452. [DOI] [PubMed] [Google Scholar]
- Nakao R., Hirasaka K., Goto J., Ishidoh K., Yamada C., Ohno A., Okumura Y., Nonaka I., Yasutomo K., Baldwin K.M. Ubiquitin ligase Cbl-b is a negative regulator for insulin-like growth factor 1 signaling during muscle atrophy caused by unloading. Mol. Cell. Biol. 2009;29:4798–4811. doi: 10.1128/MCB.01347-08. [DOI] [PMC free article] [PubMed] [Google Scholar]
- Ohne Y., Takahara T., Hatakeyama R., Matsuzaki T., Noda M., Mizushima N., Maeda T. Isolation of hyperactive mutants of mammalian target of rapamycin. J. Biol. Chem. 2008;283:31861–31870. doi: 10.1074/jbc.M801546200. [DOI] [PubMed] [Google Scholar]
- Pearce L.R., Alton G.R., Richter D.T., Kath J.C., Lingardo L., Chapman J., Hwang C., Alessi D.R. Characterization of PF-4708671, a novel and highly specific inhibitor of p70 ribosomal S6 kinase (S6K1) Biochem. J. 2010;431:245–255. doi: 10.1042/BJ20101024. [DOI] [PubMed] [Google Scholar]
- Rodrik-Outmezguine V.S., Chandarlapaty S., Pagano N.C., Poulikakos P.I., Scaltriti M., Moskatel E., Baselga J., Guichard S., Rosen N. mTOR kinase inhibition causes feedback-dependent biphasic regulation of AKT signaling. Cancer Discov. 2011;1:248–259. doi: 10.1158/2159-8290.CD-11-0085. [DOI] [PMC free article] [PubMed] [Google Scholar]
- Rui L., Yuan M., Frantz D., Shoelson S., White M.F. SOCS-1 and SOCS-3 block insulin signaling by ubiquitin-mediated degradation of IRS1 and IRS2. J. Biol. Chem. 2002;277:42394–42398. doi: 10.1074/jbc.C200444200. [DOI] [PubMed] [Google Scholar]
- Sarbassov D.D., Ali S.M., Sengupta S., Sheen J.-H., Hsu P.P., Bagley A.F., Markhard A.L., Sabatini D.M. Prolonged rapamycin treatment inhibits mTORC2 assembly and Akt/PKB. Mol. Cell. 2006;22:159–168. doi: 10.1016/j.molcel.2006.03.029. [DOI] [PubMed] [Google Scholar]
- Saxton R.A., Sabatini D.M. mTOR signaling in growth, metabolism, and disease. Cell. 2017;168:960–976. doi: 10.1016/j.cell.2017.02.004. [DOI] [PMC free article] [PubMed] [Google Scholar]
- Shah O.J., Wang Z., Hunter T. Inappropriate activation of the TSC/Rheb/mTOR/S6K cassette induces IRS1/2 depletion, insulin resistance, and cell survival deficiencies. Curr. Biol. 2004;14:1650–1656. doi: 10.1016/j.cub.2004.08.026. [DOI] [PubMed] [Google Scholar]
- Shi J., Luo L., Eash J., Ibebunjo C., Glass D.J. The SCF-Fbxo40 complex induces IRS1 ubiquitination in skeletal muscle, limiting IGF1 signaling. Dev. Cell. 2011;21:835–847. doi: 10.1016/j.devcel.2011.09.011. [DOI] [PubMed] [Google Scholar]
- Sun X.J., Crimmins D.L., Myers M.G., Miralpeix M., White M.F. Pleiotropic insulin signals are engaged by multisite phosphorylation of IRS-1. Mol. Cell. Biol. 1993;13:7418–7428. doi: 10.1128/mcb.13.12.7418. [DOI] [PMC free article] [PubMed] [Google Scholar]
- Tzatsos A. Raptor binds the SAIN (Shc and IRS-1 NPXY binding) domain of insulin receptor substrate-1 (IRS-1) and regulates the phosphorylation of IRS-1 at Ser-636/639 by mTOR. J. Biol. Chem. 2009;284:22525–22534. doi: 10.1074/jbc.M109.027748. [DOI] [PMC free article] [PubMed] [Google Scholar]
- Tzatsos A., Kandror K.V. Nutrients suppress phosphatidylinositol 3-kinase/Akt signaling via raptor-dependent mTOR-mediated insulin receptor substrate 1 phosphorylation. Mol. Cell. Biol. 2006;26:63–76. doi: 10.1128/MCB.26.1.63-76.2006. [DOI] [PMC free article] [PubMed] [Google Scholar]
- Um S.H., Frigerio F., Watanabe M., Picard F., Joaquin M., Sticker M., Fumagalli S., Allegrini P.R., Kozma S.C., Auwerx J., Thomas G. Absence of S6K1 protects against age- and diet-induced obesity while enhancing insulin sensitivity. Nature. 2004;431:200–205. doi: 10.1038/nature02866. [DOI] [PubMed] [Google Scholar]
- Usui I., Imamura T., Huang J., Satoh H., Shenoy S.K., Lefkowitz R.J., Hupfeld C.J., Olefsky J.M. β-arrestin-1 competitively inhibits insulin-induced ubiquitination and degradation of insulin receptor substrate 1. Mol. Cell. Biol. 2004;24:8929–8937. doi: 10.1128/MCB.24.20.8929-8937.2004. [DOI] [PMC free article] [PubMed] [Google Scholar]
- Wan X., Harkavy B., Shen N., Grohar P., Helman L.J. Rapamycin induces feedback activation of Akt signaling through an IGF-1R-dependent mechanism. Oncogene. 2007;26:1932–1940. doi: 10.1038/sj.onc.1209990. [DOI] [PubMed] [Google Scholar]
- Wang Z., Liu P., Inuzuka H., Wei W. Roles of F-box proteins in cancer. Nat. Rev. Cancer. 2014;14:233–247. doi: 10.1038/nrc3700. [DOI] [PMC free article] [PubMed] [Google Scholar]
- White M.F. IRS proteins and the common path to diabetes. Am. J. Physiol. Endocrinol. Metab. 2002;283:E413–E422. doi: 10.1152/ajpendo.00514.2001. [DOI] [PubMed] [Google Scholar]
- Wu G., Xu G., Schulman B.A., Jeffrey P.D., Harper J.W., Pavletich N.P. Structure of a β-TrCP1-Skp1-β-Catenin complex: destruction motif binding and lysine specificity of the SCF(β-TrCP1) ubiquitin ligase. Mol. Cell. 2003;11:1445–1456. doi: 10.1016/s1097-2765(03)00234-x. [DOI] [PubMed] [Google Scholar]
- Xu X., Sarikas A., Dias-Santagata D.C., Dolios G., Lafontant P.J., Tsai S.-C., Zhu W., Nakajima H., Nakajima H.O., Field L.J. The CUL7 E3 ubiquitin ligase targets insulin receptor substrate 1 for ubiquitin-dependent degradation. Mol. Cell. 2008;30:403–414. doi: 10.1016/j.molcel.2008.03.009. [DOI] [PMC free article] [PubMed] [Google Scholar]
- Yi J.-S., Park J.S., Ham Y.-M., Nguyen N., Lee N.-R., Hong J., Kim B.-W., Lee H., Lee C.-S., Jeong B.-C. MG53-induced IRS-1 ubiquitination negatively regulates skeletal myogenesis and insulin signalling. Nat. Commun. 2013;4:2354. doi: 10.1038/ncomms3354. [DOI] [PMC free article] [PubMed] [Google Scholar]
- Yoneyama Y., Lanzerstorfer P., Niwa H., Umehara T., Shibano T., Yokoyama S., Chida K., Weghuber J., Hakuno F., Takahashi S.-I. IRS-1 acts as an endocytic regulator of IGF-I receptor to facilitate sustained IGF signaling. Elife. 2018;7 doi: 10.7554/eLife.32893. [DOI] [PMC free article] [PubMed] [Google Scholar]
- Yoneyama Y., Matsuo M., Take K., Kabuta T., Chida K., Hakuno F., Takahashi S.-I. The AP-1 complex regulates intracellular localization of insulin receptor substrate 1, which is required for insulin-like growth factor I-dependent cell proliferation. Mol. Cell. Biol. 2013;33:1991–2003. doi: 10.1128/MCB.01394-12. [DOI] [PMC free article] [PubMed] [Google Scholar]
- Yoon S.-O., Shin S., Karreth F.A., Buel G.R., Jedrychowski M.P., Plas D.R., Dedhar S., Gygi S.P., Roux P.P., Dephoure N., Blenis J. Focal adhesion- and IGF1R-dependent survival and migratory pathways mediate tumor resistance to mTORC1/2 inhibition. Mol. Cell. 2017;67:512–527. doi: 10.1016/j.molcel.2017.06.033. [DOI] [PMC free article] [PubMed] [Google Scholar]
- Yu Y., Yoon S.-O., Poulogiannis G., Yang Q., Ma X.M., Villén J., Kubica N., Hoffman G.R., Cantley L.C., Gygi S.P., Blenis J. Phosphoproteomic analysis identifies Grb10 as an mTORC1 substrate that negatively regulates insulin signaling. Science. 2011;332:1322–1326. doi: 10.1126/science.1199484. [DOI] [PMC free article] [PubMed] [Google Scholar]
Associated Data
This section collects any data citations, data availability statements, or supplementary materials included in this article.