

Abstract
Background
Multidrug resistance (MDR) is a major obstacle in breast cancer treatment. The predominant mechanism underlying MDR is an increase in the activity of adenosine triphosphate (ATP)-dependent drug efflux transporters. Sulbactam, a β-lactamase inhibitor, is generally combined with β-lactam antibiotics for treating bacterial infections. However, sulbactam alone can be used to treat Acinetobacter baumannii infections because it inhibits the expression of ATP-binding cassette (ABC) transporter proteins. This is the first study to report the effects of sulbactam on mammalian cells.
Methods
We used the breast cancer cell lines as a model system to determine whether sulbactam affects cancer cells. The cell viabilities in the present of doxorubicin with or without sulbactam were measured by MTT assay. Protein identities and the changes in protein expression levels in the cells after sulbactam and doxorubicin treatment were determined using LC–MS/MS. Real-time reverse transcription polymerase chain reaction (real-time RT-PCR) was used to analyze the change in mRNA expression levels of ABC transporters after treatment of doxorubicin with or without sulbactam. The efflux of doxorubicin was measures by the doxorubicin efflux assay.
Results
MTT assay revealed that sulbactam enhanced the cytotoxicity of doxorubicin in breast cancer cells. The results of proteomics showed that ABC transporter proteins and proteins associated with the process of transcription and initiation of translation were reduced. The mRNA expression levels of ABC transporters were also decreased when treated with doxorubicin and sulbactam. The doxorubicin efflux assay showed that sulbactam treatment inhibited doxorubicin efflux.
Conclusions
The combination of sulbactam and doxorubicin enhances the cytotoxicity of doxorubicin in the breast cancer cells by inhibiting the expression of ABC transporter proteins and proteins associated with the process of transcription and initiation of translation, and blocking the efflux of doxorubicin. Co-treatment of doxorubicin and sulbactam can be used in breast cancer treatment to decrease the prescribed dose of doxorubicin to avoid the adverse effects of doxorubicin.
Keywords: Sulbactam, Breast cancer, ABC transporters, Doxorubicin, Proteomics, Inhibitors
Background
Breast cancer, the most common cancer in women, annually affects 1.8 million women worldwide [1]. Approximately 12% of women in the United States are estimated to receive diagnoses of breast cancer in their lifetime [2]. Breast cancer is classified into three subtypes according to the expression of receptors: hormone (estrogen and progesterone)-receptor-positive breast cancer, human epidermal growth factor receptor 2 (HER2)-positive breast cancer, and triple-negative breast cancer (TNBC; lacking hormone receptors as well as HER2) [3]. Patients with TNBC exhibit a high risk of early tumor recurrence and poor prognosis [4]. Chemotherapy is a principal treatment for breast cancer, but resistance to chemotherapy—occurring in at least a quarter of all cases—is a major problem in breast cancer management, causing treatment failure in more than 90% of patients with metastatic cancers [5–8]. The mechanisms underlying resistance in different breast cancer subtypes are diverse, complex, and unclear. Cancer cells may develop resistance to a specific class of cytotoxic drugs owing to changes in target proteins and in cellular biological activities affecting the efficacy of the drugs. The changes include increased repair of DNA damage and decreased apoptosis, membrane permeability, and drug metabolism. Furthermore, the uptake of water-soluble drugs decreases due to a decrease in the expression of transporter proteins responsible for drugs to enter the cells and the energy-dependent efflux of hydrophobic drugs increases, for instance, through increased expression of adenosine triphosphate (ATP)-binding cassette (ABC) transporter proteins [9–15].
Doxorubicin, an anthracycline antibiotic, has been considered one of the most effective agents in breast cancer treatment since the 1970s [16]. Doxorubicin mainly intercalates between DNA bases and subsequently inhibits topoisomerase II activity, thus impairing DNA synthesis [17]. Doxorubicin also generates free radicals, which damage DNA and cell membranes [18]. Doxorubicin enters the cells through passive diffusion and accumulates intracellularly, particularly in the nuclear compartments [19]. However, doxorubicin is nonselective toward cancer cells; thus, it causes toxicity in the heart, brain, liver, and kidneys [19, 20]. The most prominent adverse event is life-threatening cardiotoxicity, which limits the prescribed dose of doxorubicin [20]. Doxorubicin resistance is another crucial cause of treatment failure [3]. The reported response rates to doxorubicin as a single agent for breast cancer treatment were 43% and 28% in patients who were exposed to doxorubicin for the first time and those who had been exposed to the drug for more than once, respectively. Thus, nearly 50% of the treated patients developed resistance to doxorubicin, making resistance the major cause of treatment failure [21]. The predominant mechanism underlying resistance to doxorubicin in breast cancer cells is the overexpression of a few ABC transporter proteins that increase doxorubicin efflux, thus decreasing intracellular drug concentrations [3, 9, 22]. Other mechanisms underlying doxorubicin resistance include alterations in cellular signaling pathways, leading to failure of apoptosis, and changes in gene expression, resulting in a chemoresistant phenotype [3, 19].
Increased expression of ABC transporter proteins has been correlated with poor clinical prognosis in patients with breast cancer of any subtype [23, 24]. The human genome has 49 members of the ABC transporter family, divided into seven subfamilies (ABCA–ABCG) based on their sequence similarities [25]. These membrane proteins actively pump various structurally and functionally diverse amphipathic anticancer drugs from inside the tumor cells to the outside, thereby decreasing intracellular drug concentrations and causing chemotherapeutic drug resistance [9, 10]. The primary members of the ABC transporter family leading to doxorubicin resistance in cancer cells are the ABCBs, the ABCCs [also known as multidrug resistance (MDR)-associated proteins], and ABCG2 (also known as breast cancer resistance protein, mitoxantrone resistance protein, or placenta-specific ABC transporter) [9, 26, 27]. Among the aforementioned ABC transporter proteins, ABCB1 [a P-glycoprotein, (p-gp)], ABCC1, and ABCG2 have been extensively characterized in breast cancers [23, 24, 28, 29]. Inhibitors of the ABC transporter proteins activity were used to overcome ABC transporter-mediated MDR for obstructing the expression of the transporter proteins or inhibiting their function. For example, a combination of doxorubicin and verapamil, a P-gp inhibitor, can reverse the resistance of breast cancer cells to doxorubicin [30]. However, verapamil can potentiate the cardiotoxicity of doxorubicin [31]. Over the past decades, numerous inhibitors of MDR-related ABC transporter proteins have been developed and identified. However, the development of most inhibitors has been discontinued because of their low binding affinity, toxicity, detrimental pharmacokinetic interactions, and low patient survival advantages [9, 32]. Furthermore, the expression patterns of ABC transporter proteins in breast cancer cells are heterogeneous; thus, the efficacy of inhibitors specific to some ABC transporter proteins is low [33].
Sulbactam, a β-lactamase inhibitor belonging to Ambler class A, is administered along with β-lactam antibiotics (e.g., ampicillin and penicillin) to prevent the hydrolysis of the antibiotics by bacterial β-lactamases. Sulbactam inhibits the activity of β-lactamases by irreversibly binding to their active sites. The β-lactam/β-lactamase inhibitor combination has been approved by the US Food and Drug Administration for treating dermatological, gynecological, and intraabdominal infections [34]. Although sulbactam has relatively low intrinsic biological activity, it has inherent activity against some bacterial species, including Neisseria gonorrhoeae, Bacteroides fragilis, and Acinetobacter spp. [35, 36]. Preliminary in vitro experiments have demonstrated that sulbactam kills bacteria by binding to the penicillin-binding proteins (PBPs) of Acinetobacter spp. and downregulating the expression of PBP1 and PBP3 [35, 37]. Furthermore, sulbactam reduces the expression of the ABC transporter proteins in Acinetobacter baumannii [38]. The ABC transporter superfamilies are highly conserved protein families, and their structural features and mechanisms of action have been conserved from prokaryotes to humans [39, 40]. Thus, we hypothesized that if sulbactam can reduce the expression of ABC transporter proteins in breast cancer cells, then it can reduce the efflux of doxorubicin from breast cancer cells and enhance its efficacy.
Materials and methods
Reagents
Doxorubicin hydrochloride was purchased from Sigma-Aldrich (St. Louis, MO, USA). Sulbactum sodium was obtained from TTY Biopharm (Taiwan). Verapamil was obtained from Orion Pharma (Espoo, Finland).
Cell lines and cell culture
The breast carcinoma cell lines MDA-MB-231, MDA-MB-435, MDA-MB-453, and MDA-MB-468 were maintained in Dulbecco’s modified Eagle’s medium (DMEM) (Hyclone, Thermo Fisher Scientific Inc. Waltham, MA, USA) containing 10% fetal bovine serum (FBS; Gibco-BRL, Rockville, MD, USA) and 100 units/mL penicillin–streptomycin (Gibco-BRL). The breast carcinoma cell lines MCF-7, BT474, and T-47D were maintained in Roswell Park Memorial Institute (RPMI)-1640 medium (Hyclone) containing 10% FBS and 100 units/mL penicillin–streptomycin. The human breast epithelial cell line MCF-10A was maintained in DMEM/F12 medium containing 5% horse serum (Invitrogen, Carlsbad, CA, USA), 20 ng/mL epithelial growth factor (Peprotech, Rocky Hill, NJ, USA), 0.5 μg/mL hydrocortisone (Sigma-Aldrich), 10 μg/mL insulin (Sigma-Aldrich), and 100 units/mL penicillin–streptomycin. All cell lines were incubated at 37 °C and 5% CO2.
MTT assay
The MTT (3-(4,5-dimethylthiazol-2-yl)-2,5-diphenyltetrazolium bromide) assay was used to access cytotoxicity. The cells were grown in 96-well plates at a density of 1.5 × 10⁴ cells/well. To determine the toxicities of sulbactam and doxorubicin, sulbactam and doxorubicin were added at various concentrations into the wells. At 48 h after treatment, the medium in the wells was replaced with 100 µL/well of medium containing 0.5 µg/µL MTT and incubated for 4 h. Subsequently, the medium was removed and 100 µL DMSO was added in each well to dissolve the formazan crystals. The absorbance of the samples was measured at 550 and 655 nm as the test and reference wavelengths, respectively, by using an iMark microplate reader (Bio-Rad, Hercules, CA, USA). To determine the effects of the combination of sulbactam and doxorubicin, various concentrations of doxorubicin were added to the medium containing 2 mM sulbactam in 96-well plates seeded with the breast cancer cells. The MTT assay was performed as described above. The cytotoxicity was expressed as relative viability (percentage of control). The percentage of cell survival in the negative control (without sulbactam and doxorubicin treatment) was considered 100. Relative viability = [(experimental absorbance − background absorbance)/(absorbance of untreated control − background absorbance)] × 100%. The half maximal inhibitory concentration (IC50) values of sulbactam, doxorubicin, and the combinations of sulbactam and doxorubicin were calculated using the survival curves by using the Bliss method. The degree of resistance was calculated by determining the ratio of the IC50 of the cells treated with sulbactam–doxorubicin combinations to that of the cells treated with doxorubicin alone.
Real-time RT-PCR
Total RNA was extracted using TriZol (Invitrogen) and reverse transcribed (SuperScript III reverse transcriptase, Invitrogen and ExcelRT Reverse Transcriptase RP1000, SMOBIO, Taiwan). Real-time reverse transcription polymerase chain reaction (Real-time RT-PCR) was performed on ABI StepOnePlus™ Real-Time system using the SYBR Green PCR Master Mix (Applied Biosystems). The sequences of the PCR primers were listed in Table 1. The condition for PCR was 95 °C for 10 min, followed by 40 rounds of 95 °C for 15 s and 60 °C for 1 min. The data were analyzed by StepOne Software v2.2.2.
Table 1.
List of primers of ABC transporters used for real-time RT-PCR
| Gene | RefSeq | Forward oligo sequence | Reverse oligo sequence |
|---|---|---|---|
| ABCB1 | NM_000927 | AGCTCGTGCCCTTGTTAGACA | GTCCAGGGCTTCTTGGACAA |
| ABCB5 | NM_178559 | CACAAAAGGCCATTCAGGCT | GCTGAGGAATCCACCCAATCT |
| ABCB8 | NM_007188 | CATCGCCTTCAACTGCATGG | GACCTTTGCACTGTCTGGGA |
| ABCB10 | NM_012089 | TGCGGTTGGATTTCTCACGA | CACACAGAAACACGGCACTG |
| ABCC1 | NM_004996 | CGCTCTGGGACTGGAATGT | AGGTAAAAACAAGGCACCCA |
| ABCC2 | NM_000392 | TGCACAAGCAACTGCTGAAC | CCTCTGGCCTATGCTCAGGTT |
| ABCC3 | NM_020038 | ACCCAGTTTGATACCTGCACTGT | GGACCCTGGTGTAGTCCATGA |
| ABCC4 | NM_005845 | TTGGACACGGTAACTGTTGCA | GGAATGTCGGTTAGAGGTTTGG |
| ABCC5 | NM_005688 | ATTTGGACCCCTTCAACCAGTAC | GGTAGCTGAGCAATACATTCTTTCAT |
| ABCC10 | NM_033450 | CCTGTTGTTGGTGCTCTTCC | GGCCCTGTCCTTATGTAGGC |
| ABCG2 | NM_004827 | TATAGCTCAGATCATTGTCACAGTC | GTTGGTCGTCAGGAAGAAGAG |
| GAPDH | NM_002046 | CCACCCATGGCAAATTCC | TCGCTCCTGGAAGATGGTG |
Efflux assay of doxorubicin
The MDA-MB-453 and MDA-MB-468 cells were seeded on coverslips in 12-well plates at a concentration of 1 × 10⁵ cells/well and grown for 16 h. On the following day, the cells were washed with phosphate buffered saline (PBS) and incubated with 2 mM sulbactam or 5 µM verapamil for 30 min before treating them with 2 µM doxorubicin for 2 h. The cells were subsequently incubated in a doxorubicin-free medium for 0, 8, 12, and 16 h. Images were obtained using a LSM 780 confocal microscope (Zeiss) and analyzed using ZEN 2012.
Gel electrophoresis
The equivalence of the human cell lines was analyzed through 12.5% sodium dodecyl sulfate–polyacrylamide gel electrophoresis (SDS-PAGE). The gels were then stained using the VisPRO protein stain kit (Visual Protein Biotech, Taiwan) for 5 min. After staining, the gels were washed with Milli-Q water and stored at 4 °C until in-gel digestion.
In-gel digestion
The gel lanes corresponding to the samples were cut into five slices, and each slice was subjected to in-gel digestion according to the method of Shevchenko [41]. Briefly, the slices were washed thrice with 50 mM ammonium bicarbonate (pH 7.9) and dehydrated using 50 mM AMBC + 50% acetonitrile (ACN). Subsequently, the cysteine bonds were reduced after treatment with 10 mM dithiothreitol for 1 h at 56 °C and alkylated using 50 mM 4-vinylpyridine for 45 min at room temperature in the dark. After two subsequent wash–dehydration cycles, the slices were dried for 10 min in a vacuum centrifuge (ThermoFisher, Breda, Netherlands) and incubated overnight with 6.25 ng/μL trypsin in 50 mM AMBC at 25 °C. The resulting peptides were extracted once in 100 μL of 1% formic acid and then two times in 100 μL of 50% ACN in 5% formic acid. The volume was reduced to 50 μL in a vacuum centrifuge before liquid chromatography (LC)–tandem mass spectrometry (MS/MS) analysis.
LC–MS/MS
The peptides were separated using an Ultimate 3000 nano LC system (Dionex LC-Packings, Amsterdam, Netherlands) equipped with a 20 cm × 75 μm internal diameter (i.d.) fused-silica column custom packed with 3-μm 120-Å ReproSil Pur C18 aqua (Dr. Maisch, GMBH, Ammerbuch-Entringen, Germany). After injection, the peptides were delivered into the column at a flowrate of 30 μL/min and trapped on a 5 mm × 300 μm i.d. Pepmap C18 cartridge (Dionex LC-Packings), which were then eluted by 2% buffer B (80% ACN and 0.05% formic acid in Milli-Q water) and separated at 300 nL/min in a 10%–40% buffer B gradient within 60 min. The eluting peptides were ionized at 1.7 kV in a Nanomate Triversa Chip-based nanospray source by using a Triversa LC coupler (Advion, Ithaca, NJ, USA). Intact peptide mass spectra and fragmentation spectra were acquired on a LT QFT hybrid mass spectrometer (Thermo Fisher, Bremen, Germany). The intact masses were measured at a resolution of 50,000 in the ion cyclotron resonance (ICR) cell by using a target value of 1 × 10⁶ charges. Simultaneously, following an FT prescan, the five highest peptide signals (charge states 2+ and higher) were submitted for MS/MS in the linear ion trap (3-AMU isolation width, 30 ms activation, 35% normalized activation energy, 0.25 Q-value, and 5000-count threshold. Dynamic exclusion was applied with a repeat count of 1 and an exclusion time of 30 s.
Results
Sulbactam potentiates doxorubicin sensitivity in breast cancer cells
To determine whether sulbactam enhances the cytotoxicity of doxorubicin, MCF-10A (normal), BT474 (ER/PR+, Her2+), MCF-7 (ER/PR+, Her2−), MDA-MB-231 (triple negative), MDA-MB-361 (ER/PR+, Her2+), MDA-MB-435 (ER/PR−, Her2+), MDA-MB-453 (triple negative), MDA-MB-468 (triple negative), and T47D (ER/PR+, Her2−) cell lines were treated for 48 h with 0, 0.1, 0.5, 1, 5, and 10 μM doxorubicin in the presence or absence of 2 mM sulbactam for 48 h. Cell viabilities were measured through the MTT assay. Doxorubicin exerted cytotoxic effects in a dose-dependent manner against all the cell lines (Fig. 1). When the cells were treated with doxorubicin alone, the viability of the MDA-MB-468 cells was < 50% at 0.5 µM doxorubicin, the viabilities of the MCF-7, MDA-MB-361, and MDA-MB-453 cells were < 50% at 1 μM doxorubicin, the viabilities of the BT474, MDA-MB-231, and MDA-MB-435 cells were < 50% at 5 μM doxorubicin, and the viability of T47D cells was < 50% until the concentration of doxorubicin reached 10 μM. Among these breast cancer cell lines, the T47D cell line exhibited low sensitivity to doxorubicin, with a IC50 value of 8.53 µM (Fig. 1i). By contrast, the MDA-MB-453 and MDA-MB-468 cells were more sensitive to doxorubicin than the T47D cells; they had lower IC50 values (0.69 and 0.27 μM, respectively) than the T47D cells and had the lowest viabilities at 5 and 10 μM doxorubicin (Fig. 1g, h). Next, we analyzed whether sulbactam enhanced the cytotoxicity of doxorubicin in the breast cancer cells. When the cells were treated with a combination of sulbactam and doxorubicin, the viabilities of the eight breast cancer cell lines significantly decreased (Fig. 1b–i). The IC50 values of doxorubicin in all the cell lines in the presence and absence of sulbactam are summarized in Table 2. The IC50 values of doxorubicin decreased from 1.14 to 0.54 μM in the BT474 cells, from 0.69 to 0.37 μM in the MCF-7 cells, from 3.16 to 1.25 μM in the MDA-MB-231 cells, from 0.89 to 0.46 μM in the MDA-MB-361 cells, from 1.22 to 0.51 μM in the MDA-MB-435 cells, from 0.69 to 0.27 μM in the MDA-MB-453 cells, from 0.27 to 0.05 μM in the MDA-MB-468 cells, and from 8.53 to 3.83 μM in the T47D cells in the presence of sulbactam. The IC50 of doxorubicin in breast cancer cells treated with a combination of sulbactam and doxorubicin was less than half of the IC50 of doxorubicin in the breast cancer cells treated with doxorubicin alone excluding the resistance of the MCF-7 and MDA-MB-361 cells, showed 1.85- and 1.96-fold decreases, respectively. By contrast, the MCF-10A cells (breast epithelial cells), did not exhibit evident differences in cell viability in the absence and presence of sulbactam; the IC50 values were 2.51 and 2.50, respectively (Fig. 1a). Among all the breast cancer cell lines, sulbactam considerably increased doxorubicin sensitivity in the MDA-MB-453 and MDA-MB-468 cells, by reducing the IC50 of doxorubicin by 2.6- and 5.0-fold, respectively, Subsequently, the cytotoxicity of sulbactam alone was analyzed in the MCF-10A, MDA-MB-453, and MDA-MB-468 cells. The cells were treated with 0, 1, 2, 4, and 8 mM sulbactam. Sulbactam did not exhibit an evident cytotoxic effect on any of the three cell lines at concentrations of up to 8 mM (Fig. 2). However, when combined with 0.5 μM doxorubicin, sulbactam potentiated the cytotoxicity of doxorubicin without evident dose dependence in the MDA-MB-453 and MDA-MB-468 cells. Thus, sulbactam has low cytotoxicity and can enhance the sensitivity of breast cancer cells toward doxorubicin.
Fig. 1.

Treatment with a combination of sulbactam and doxorubicin reduced the viability of breast cancer cells. a MCF10A, b BT474, c MCF-7, d MDA-MB-231, e MDA-MB-361, f MDA-MB-435, g MDA-MB-453, h MDA-MB-468, i T47D. Data are expressed as the percentage of cell viability compared with the negative control in which the cell viability was assumed to be 100%. Reported values represent mean ± SD of at least three independent experiments. *p < 0.05 and **p < 0.01 versus only Dox-treated cells. Sul sulbactam, Dox doxorubicin, ER estrogen receptor, PR progesterone receptor, HER2 human epidermal growth factor receptor 2, MTT 3-(4,5-dimethylthiazol-2-yl)-2,5-diphenyltetrazolium bromide, SD standard deviation
Table 2.
IC50 and resistance fold of breast cell lines in the present of sulbactam and doxorubicin
| Cell line | IC50 of Doxorubicin (Dox, μM) | Resistance fold | |
|---|---|---|---|
| Dox | Dox + Sul | Dox + Sul/Dox | |
| MCF10A | 2.51 | 2.50 | 1.00 |
| BT474 | 1.14 | 0.54 | 0.47 |
| MCF-7 | 0.69 | 0.37 | 0.54 |
| MDA-MB-231 | 3.16 | 1.25 | 0.40 |
| MDA-MB-361 | 0.89 | 0.46 | 0.51 |
| MDA-MB-435 | 1.22 | 0.51 | 0.42 |
| MDA-MB-453 | 0.69 | 0.27 | 0.39 |
| MDA-MB-468 | 0.27 | 0.05 | 0.20 |
| T47D | 8.53 | 3.83 | 0.45 |
IC50 was calculated from the results of Fig. 1 using CompuSyn. Resistance fold was determined by dividing the IC50 values of cells treated with doxorubicin and 2 mM sulbactam (Dox + Sul) by the IC50 of cells treated with doxorubicin (Dox)
Fig. 2.

Sulbactam alone did not significantly affect cell viability of the breast cancer cell lines. a The MCF-10A cells treated with Sul (squares), Sul + D0.5 (triangles), and Sul + D1.0 (circles). The b MDA-MB-453 and c MDA-MB-468 cells treated with Sul (squares) and Sul + D0.5 (triangles). Data are expressed as the percentage of cell viability compared with negative control in which cell viability was assumed to be 100%. Reported values represent mean ± SD of at least three independent experiments. Sul sulbactam, Dox doxorubicin, MTT 3-(4,5-dimethylthiazol-2-yl)-2,5-diphenyltetrazolium bromide, SD standard deviation
Proteomic profiling of total proteins from MDA-MB-468 cells treated with and without sulbactam in presence of doxorubicin
The MDA-MB-468 cells were treated with or without 2 mM sulbactam in the presence of 0.1 μM doxorubicin for 24 h. The total cell lysates were harvested for LC–MS/MS analysis. In total, 2937 proteins were identified using Sequest, which were validated using Scaffold. The expression of 66 and 70 proteins were significantly upregulated and downregulated, respectively, in the MDA-MB-468 cells treated with a combination of sulbactam and doxorubicin (based on p value < 0.05 and fold change > 2; Tables 3 and 4). The UniProt database was used to classify the identified proteins according to their biological processes. The upregulated proteins were classified as RNA processing, response to DNA damage, response to stress, cytoskeleton organization, protein folding, ubiquitin-dependent protein catabolic process, vesicle-mediated transport, carbohydrate metabolism, amino acid metabolism, and positive regulation of apoptosis proteins (Table 3). The downregulated proteins were classified as translation, regulation of transcription, RNA processing, ABC transporter, cytoskeleton organization, protein folding, protein catabolic process, carbohydrate metabolism, mitochondrial metabolic process, negative regulation of apoptosis, and signal transduction proteins (Table 4). The connections among the proteins and GO biological processes of the proteins were tested through STRING network analysis. The proteins are represented as nodes. The thickness of the edges indicates the strength of correlations between the proteins according to neighborhood, gene fusion, co-occurrence, co-expression, previous experiments, databases, and text-mining information at confidence scores higher than 0.5. As shown in Fig. 3a, 38 of the 60 proteins which were upregulated in the MDA-MB-468 cells treated with a combination of sulbactam and doxorubicin were associated with response to stimuli. Functional clusters included proteins involved in carbohydrate metabolism, tubulin-associated cytoskeleton organization, and ubiquitin-dependent protein catabolic process. As shown in Fig. 3b, 31 of 68 proteins which were downregulated in the MDA-MB-468 cells treated with a combination of sulbactam and doxorubicin were associated with gene expression. The functional clusters of these downregulated proteins were associated with actin remodeling, mitochondrial metabolic process, protein catabolic process, transcription and RNA process, and translation.
Table 3.
List of upregulated proteins in the Dox- and Sul-treated MDA-MB-468 cells
| Protein name | Abbreviation | UniProt ID | Mass (Da) | pI | Spectrum count | Dox + Sul/Dox | p value | Biological process | |
|---|---|---|---|---|---|---|---|---|---|
| Dox | Dox + Sul | Folda | |||||||
| Putative pre-mRNA-splicing factor ATP-dependent RNA helicase DHX15 | DHX15 | O43143 | 90,932.8 | 7.1 | 0.00 | 0.82 | 100.00 | 2.57E−07 | RNA processing |
| U5 small nuclear ribonucleoprotein 200 kDa helicase | SNRNP200 | O75643 | 244,507.6 | 5.7 | 0.00 | 1.10 | 100.00 | 2.41E−02 | RNA processing |
| Spliceosome RNA helicase DDX39B | DDX39B | Q5STU3 | 48,826.1 | 7.2 | 0.00 | 1.85 | 100.00 | 2.52E−05 | RNA processing |
| ATP-dependent RNA helicase DDX3X | DDX3X | O00571 | 73,112.2 | 6.7 | 0.00 | 1.39 | 100.00 | 7.43E−04 | RNA processing |
| Nucleolar protein 14 | NOP14 | P78316 | 97,668.7 | 9.1 | 0.00 | 0.96 | 100.00 | 1.50E−03 | RNA processing |
| Growth arrest and DNA damage-inducible proteins-interacting protein 1 | GADD45GIP1 | Q8TAE8 | 25,383.9 | 9.5 | 0.00 | 1.09 | 100.00 | 2.70E−02 | Response to DNA damage |
| 26S protease regulatory subunit 6A | PSMC3 | P17980 | 49,203.5 | 5.1 | 0.27 | 1.11 | 4.06 | 4.64E−02 | Response to DNA damage |
| Proteasome subunit beta type-4 | PSMB4 | P28070 | 29,204.3 | 9.1 | 0.00 | 0.96 | 100.00 | 1.08E−03 | Response to DNA damage |
| Transformation/transcription domain-associated protein | TRRAP | Q9Y4A5 | 437,601.8 | 9.1 | 0.00 | 0.55 | 100.00 | 3.412E−05 | Response to DNA damage |
| Protein DEK | DEK | P35659 | 42,674.4 | 9.3 | 0.00 | 1.53 | 100.00 | 6.37E−03 | Response to DNA damage |
| Serine/threonine-protein kinase BRSK1 | BRSK1 | Q8TDC3 | 85,087.0 | 9.5 | 0.00 | 0.55 | 100.00 | 2.57E−07 | Response to DNA damage |
| Adenomatous polyposis coli protein | APC | E7EMH9 | 32,790.8 | 5.4 | 0.00 | 0.55 | 100.00 | 3.41E−05 | Response to DNA damage |
| Dihydropyrimidinase-related protein 2 | DPYSL2 | Q16555 | 62,293.6 | 5.9 | 0.00 | 0.98 | 100.00 | 1.32E−02 | Response to stress |
| Sodium/potassium-transporting ATPase subunit beta-1 | ATP1B1 | P05026 | 35,061.3 | 9.1 | 0.00 | 1.11 | 100.00 | 7.81E−03 | Response to stress |
| ERO1-like protein alpha | ERO1L | Q96HE7 | 51,991.8 | 5.4 | 0.00 | 0.56 | 100.00 | 1.12E−04 | Response to stress |
| STE20-like serine/threonine-protein kinase | SLK | Q9H2G2 | 142,695.4 | 3.7 | 0.00 | 0.70 | 100.00 | 2.30E−02 | Response to stress |
| Heat shock-related 70 kDa protein 2 | HSPA2 | P54652 | 70,021.0 | 5.6 | 0.00 | 2.69 | 100.00 | 9.41E−04 | Response to stress |
| Putative heat shock 70 kDa protein 7 | HSPA6 | P48741 | 40,244.4 | 7.7 | 0.00 | 3.08 | 100.00 | 5.50E−03 | Response to stress |
| Lipoprotein, Lp(A) | LPA | Q1HP67 | 226,516.1 | 7.2 | 0.00 | 0.55 | 100.00 | 2.57E−07 | Response to stress |
| Apolipoprotein(a) | LPA | P08519 | 501,319.8 | 7.2 | 0.00 | 0.55 | 100.00 | 2.57E−07 | Response to stress |
| Peroxiredoxin-6 | PRDX6 | P30041 | 24,903.8 | 6.0 | 0.27 | 1.68 | 6.15 | 1.42E−02 | Response to stress |
| Solute carrier family 12 member 2 | SLC12A2 | P55011 | 131,447.1 | 6.0 | 0.37 | 2.21 | 6.03 | 4.53E−03 | Response to stress |
| Thioredoxin-related transmembrane protein 1 | TMX1 | Q9H3N1 | 31,791.3 | 3.7 | 0.00 | 0.83 | 100.00 | 2.70E−04 | Response to stress |
| Transmembrane protein 109 | TMEM109 | Q9BVC6 | 26,210.1 | 11.2 | 0.00 | 0.56 | 100.00 | 2.70E−04 | Response to stress |
| MICOS complex subunit MIC60 | IMMT | Q16891 | 80,026.5 | 5.7 | 1.12 | 2.74 | 2.45 | 1.34E−04 | Response to stress |
| Signal transducer and activator of transcription | STAT1 | J3KPM9 | 83,360.6 | 7.2 | 0.00 | 0.83 | 100.00 | 2.70E−04 | Response to stress |
| cDNA FLJ78587 | TUBA1B | A8JZY9 | 50,135.7 | 5.4 | 4.80 | 14.97 | 3.12 | 5.22E−03 | Cytoskeleton organization |
| Myosin regulatory light chain 12A | MYL12A | P19105 | 19,794.1 | 4.7 | 1.23 | 5.81 | 4.71 | 3.07E−02 | Cytoskeleton organization |
| Myosin regulatory light chain 12B | MYL12B | O14950 | 19,779.2 | 4.7 | 1.23 | 5.81 | 4.71 | 3.07E−02 | Cytoskeleton organization |
| Actin-like protein 8 | ACTL8 | Q9H568 | 41,360.4 | 7.2 | 0.27 | 1.11 | 4.06 | 4.64E−02 | Cytoskeleton organization |
| Plastin-1 | PLS1 | Q14651 | 70,253.6 | 5.4 | 0.00 | 0.97 | 100.00 | 7.05E−03 | Cytoskeleton organization |
| F-actin-capping protein subunit beta | CAPZB | P47756 | 31,219.3 | 5.4 | 0.00 | 2.46 | 100.00 | 4.59E−02 | Cytoskeleton organization |
| Vimentin | VIM | B0YJC5 | 26,858.9 | 3.7 | 0.00 | 0.69 | 100.00 | 2.03E−02 | Cytoskeleton organization |
| Filamin A | FLNA | Q60FE5 | 278,226.9 | 7.2 | 2.51 | 7.53 | 3.01 | 2.05E−02 | Cytoskeleton organization |
| Tubulin-folding cofactor B | TBCB | Q99426 | 27,325.5 | 8.7 | 0.00 | 0.70 | 100.00 | 2.30E−02 | Cytoskeleton organization |
| Tubulin beta-3 chain | TUBB3 | Q13509 | 50,432.7 | 4.8 | 1.41 | 6.70 | 4.75 | 3.23E−02 | Cytoskeleton organization |
| Tubulin beta-4A chain | TUBB4A | P04350 | 49,585.8 | 4.8 | 0.00 | 1.94 | 100.00 | 2.70E−04 | Cytoskeleton organization |
| Kinesin heavy chain isoform 5C | KIF5C | O60282 | 109,494.8 | 5.9 | 0.00 | 1.10 | 100.00 | 3.85E−02 | Cytoskeleton organization |
| Septin-9 | SEPTIN9 | Q9UHD8 | 65,401.6 | 9.5 | 0.00 | 1.40 | 100.00 | 1.64E−02 | Cytoskeleton organization |
| Laminin subunit alpha-2 | LAMA2 | A0A087WYF1 | 343,419.0 | 7.2 | 0.28 | 1.26 | 4.46 | 4.32E−02 | Cytoskeleton organization |
| Malectin | MLEC | Q14165 | 32,233.9 | 7.2 | 0.00 | 0.70 | 100.00 | 2.15E−02 | Protein folding |
| T-complex protein 1 subunit gamma | CCT3 | Q2TU64 | 60,579.1 | 7.2 | 0.00 | 3.62 | 100.00 | 1.49E−02 | Protein folding |
| Vesicle-associated membrane protein-associated protein B/C | VAPB | E5RK64 | 7801.0 | 9.5 | 0.00 | 1.54 | 100.00 | 3.83E−02 | Protein folding |
| PEST proteolytic signal-containing nuclear protein | PCNP | Q8WW12 | 18,924.9 | 6.9 | 0.28 | 1.91 | 6.95 | 2.46E−02 | Ubiquitin-dependent protein catabolic process |
| NEDD8-conjugating enzyme Ubc12 | UBE2 M | P61081 | 20,900.0 | 9.1 | 0.00 | 0.83 | 100.00 | 2.70E−04 | Ubiquitin-dependent protein catabolic process |
| Cullin-3 | CUL3 | A0A087WTG3 | 39,147.2 | 9.5 | 0.00 | 1.94 | 100.00 | 2.70E−04 | Ubiquitin-dependent protein catabolic process |
| Coatomer subunit beta | COPB1 | P53618 | 107,142.6 | 7.2 | 0.00 | 1.10 | 100.00 | 3.02E−02 | Vesicle-mediated transport |
| Endoplasmic reticulum resident protein 29 | ERP29 | F8VY02 | 18,115.9 | 9.1 | 0.00 | 0.55 | 100.00 | 3.41E−05 | Vesicle-mediated transport |
| Kinesin-like protein KIF16B | KIF16B | Q96L93 | 152,011.7 | 7.2 | 0.00 | 1.12 | 100.00 | 3.33E−02 | Vesicle-mediated transport |
| Phosphatidylinositol N-acetylglucosaminyltransferase subunit A | PIGA | P37287 | 54,126.7 | 9.1 | 0 | 0.55 | 100.00 | 2.574E−07 | Vesicle-mediated transport |
| Ras-related protein Rab-35 | RAB35 | Q15286 | 23,025.3 | 9.1 | 0.00 | 0.98 | 100.00 | 8.01E−03 | Vesicle-mediated transport |
| Ras-related protein Rab-15 | RAB15 | P59190 | 24,390.6 | 5.5 | 0.00 | 0.98 | 100.00 | 8.01E−03 | Vesicle-mediated transport |
| Ras-related protein Rab-15 isoform AN2 | RAB15 | G5ELZ5 | 13,781.8 | 9.1 | 0.00 | 0.98 | 100.00 | 8.01E−03 | Vesicle-mediated transport |
| Ras-related protein Rab-15 isoform AN3 | RAB15 | G5ELZ6 | 12,759.7 | 9.1 | 0.00 | 0.98 | 100.00 | 8.01E−03 | Vesicle-mediated transport |
| Enolase | ENO1 | F5H0C8 | 34,762.3 | 3.6 | 0.00 | 0.83 | 100.00 | 2.70E−04 | Carbohydrate metabolism |
| Phosphoglycerate mutase | PGAM1 | A4D2J6 | 28,219.6 | 9.5 | 0.00 | 1.40 | 100.00 | 2.15E−02 | Carbohydrate metabolism |
| ATP-dependent 6-phosphofructokinase, platelet type | PFKP | B1APP8 | 22,939.3 | 9.1 | 0.00 | 0.56 | 100.00 | 1.12E−04 | Carbohydrate metabolism |
| Gamma-enolase | ENO2 | P09104 | 47,268.6 | 4.9 | 0.00 | 0.83 | 100.00 | 2.70E−04 | Carbohydrate metabolism |
| Transaldolase | TALDO1 | F2Z393 | 35,328.9 | 9.5 | 0.00 | 2.75 | 100.00 | 3.85E−02 | Carbohydrate metabolism |
| Ganglioside-induced differentiation-associated protein 1 | GDAP1 | Q8TB36 | 41,345.8 | 9.1 | 0.00 | 0.56 | 100.00 | 2.70E−04 | Amino acid metabolic process |
| Multifunctional methyltransferase subunit TRM112-like protein | TRMT112 | F5GX77 | 11,972.0 | 7.8 | 0.00 | 0.56 | 100.00 | 1.12E−04 | Amino acid metabolic process |
| GCSH protein | GCSH | Q6IAT2 | 19,025.8 | 3.7 | 0.00 | 0.96 | 100.00 | 8.84E−03 | Amino acid metabolic process |
| Elongation factor 1-alpha 2 | EEF1A2 | Q05639 | 50,470.2 | 9.1 | 0.00 | 3.21 | 100.00 | 1.94E−02 | Positive regulation of apoptotic process |
| Apoptotic chromatin condensation inducer in the nucleus | ACIN1 | Q9UKV3 | 151,861.9 | 5.4 | 0.00 | 0.82 | 100.00 | 1.30E−02 | Positive regulation of apoptotic process |
Sul sulbactam, Dox doxorubicin
aThe fold is from Dox + Sul/Dox, if the number of Dox is 0.00, the fold would be shown as 100.00
Table 4.
List of downregulated proteins in the Dox- and Sul-treated MDA-MB-468 cells
| Protein name | Abbreviation | UniProt ID | Mass (Da) | pI | Spectrum count | Dox + sul/Dox | p value | Biological process | |
|---|---|---|---|---|---|---|---|---|---|
| Dox | Dox + Sul | Folda | |||||||
| 60S ribosomal protein L4 | RPL4 | P36578 | 47,566.1 | 11.1 | 4.53 | 1.96 | − 2.31 | 2.25E−02 | Translation |
| 60S ribosomal protein L17 | RPL17 | J3QLC8 | 20,246.8 | 9.5 | 1.84 | 0.27 | − 6.76 | 4.24E−02 | Translation |
| 60S ribosomal protein L24 | RPL24 | C9JXB8 | 14,368.8 | 11.3 | 0.56 | 0.00 | − 100.00 | 1.30E−04 | Translation |
| 60S ribosomal protein L27a | RPL27A | P46776 | 16,430.2 | 11.0 | 3.20 | 1.47 | − 2.17 | 1.42E−02 | Translation |
| 60S ribosomal protein L37a | RPL37A | P61513 | 10,275.3 | 9.5 | 1.39 | 0.00 | − 100.00 | 4.08E−03 | Translation |
| 40S ribosomal protein S3a | RPS3A | D6RAT0 | 25,887.1 | 9.5 | 7.51 | 0.00 | − 100.00 | 4.01E−03 | Translation |
| Eukaryotic translation initiation factor 1A, Y-chromosomal | EIF1AY | O14602 | 16,442.4 | 4.6 | 0.65 | 0.00 | − 100.00 | 1.43E−03 | Translation |
| Eukaryotic translation initiation factor 1A, X-chromosomal | EIF1AX | P47813 | 16,460.4 | 4.6 | 0.65 | 0.00 | − 100.00 | 1.43E−03 | Translation |
| Eukaryotic translation initiation factor 4 gamma 1 | EIF4G1 | B2RU10 | 176,207.3 | 5.4 | 1.12 | 0.00 | − 100.00 | 3.18E−02 | Translation |
| Eukaryotic translation initiation factor 3 subunit J | EIF3 J | O75822 | 29,062.4 | 3.7 | 1.38 | 0.27 | − 5.10 | 1.16E−02 | Translation |
| Eukaryotic translation initiation factor 6 | EIF6 | P56537 | 26,599.2 | 3.7 | 0.70 | 0.00 | − 100.00 | 2.17E−02 | Translation |
| Nascent polypeptide-associated complex subunit alpha | NANA2 | Q13765 | 23,383.9 | 4.5 | 1.57 | 0.00 | − 100.00 | 1.47E−03 | Translation |
| Nascent polypeptide-associated complex subunit alpha, muscle-specific form | NANA | F8VZJ2 | 15,016.0 | 4.9 | 1.57 | 0.00 | − 100.00 | 1.47E−03 | Translation |
| Eukaryotic translation elongation factor 1 beta 2 | EEF1B2 | A4D1M6 | 24,891.0 | 3.7 | 1.26 | 0.00 | − 100.00 | 7.44E−03 | Translation |
| Heterogeneous nuclear ribonucleoprotein D0 | HNRNPD | Q14103 | 38,434.2 | 7.6 | 4.25 | 2.39 | − 1.78 | 2.07E−02 | Translation |
| MAP kinase-interacting serine/threonine-protein kinase 1 | MKNK1 | E9PMF1 | 12,586.3 | 9.5 | 0.84 | 0.00 | − 100.00 | 8.80E−07 | Translation |
| Heterogeneous nuclear ribonucleoproteins C1/C2 | HNPNPC | G3V2Q1 | 33,570.9 | 5.0 | 3.50 | 0.81 | − 4.30 | 2.30E−02 | Translation |
| KH domain-containing, RNA-binding, signal transduction-associated protein 1 | KHDRBS1 | Q07666 | 48,227.3 | 8.7 | 0.97 | 0.00 | − 100.00 | 1.21E−02 | Regulation of transcription |
| High mobility group protein HMG-I/HMG-Y | HMGA1 | P17096 | 11,544.8 | 10.3 | 1.53 | 0.70 | − 2.19 | 2.87E−02 | Regulation of transcription |
| cDNA FLJ54188, moderately similar to High mobility group protein HMG-I/HMG-Y | HMGA1 | B4DWA0 | 34,301.4 | 10.4 | 1.53 | 0.70 | − 2.19 | 2.87E−02 | Regulation of transcription |
| Serrate RNA effector molecule homolog | SRRT | Q9BXP5 | 100,666.7 | 7.2 | 0.97 | 0.00 | − 100.00 | 7.88E−03 | Regulation of transcription |
| Protein SIX6OS1 | C14orf39 | Q8N1H7 | 68,166.0 | 5.4 | 0.56 | 0.00 | − 100.00 | 1.30E−04 | Regulation of transcription |
| Heterogeneous nuclear ribonucleoprotein D-like | HNRPDL | O14979 | 46,437.5 | 9.6 | 2.23 | 0.00 | − 100.00 | 9.63E−03 | Regulation of transcription |
| Zinc finger and BTB domain-containing protein 14 | ZFP161 | O43829 | 50,956.5 | 5.4 | 0.74 | 0.00 | − 100.00 | 9.26E−03 | Regulation of transcription |
| Golgin-45 | BLZF1 | Q9H2G9 | 44,910.4 | 9.1 | 0.70 | 0.00 | − 100.00 | 1.68E−02 | Regulation of transcription |
| Zinc finger protein neuro-d4 | DPF1 | E9PDV3 | 45,285.6 | 7.2 | 0.56 | 0.00 | − 100.00 | 1.30E−04 | Regulation of transcription |
| Histone cluster 1, H1e | HIST1H1E | Q4VB24 | 21,893.3 | 9.5 | 4.44 | 0.00 | − 100.00 | 1.25E−02 | Regulation of transcription |
| Serine/arginine-rich splicing factor 10 | SRSF10 | O75494 | 31,300.5 | 11.2 | 0.56 | 0.00 | − 100.00 | 1.30E−04 | RNA processing |
| Heterogeneous nuclear ribonucleoprotein Q | SYNCRIP | O60506 | 69,471.4 | 8.7 | 5.98 | 1.95 | − 3.07 | 3.52E−02 | RNA processing |
| Transformer-2 protein homolog alpha | TRA2A | Q13595 | 32,688.6 | 11.2 | 1.11 | 0.18 | − 6.02 | 3.23E−02 | RNA processing |
| Multidrug resistance protein 1 | ABCB1 | P08183 | 141,479.1 | 9.1 | 3.47 | 0.84 | − 4.13 | 5.08E−04 | Transporters |
| ATP-binding cassette sub-family G member 2 | ABCG2 | Q9UNQ0 | 72,314.0 | 8.9 | 1.66 | 0.36 | − 4.56 | 1.05E−03 | Transporters |
| ATP-binding cassette sub-family A member 8 | ABCA8 | O94911 | 179,245.9 | 9.1 | 0.56 | 0.00 | − 100.00 | 8.80E−07 | Transporters |
| Sodium/potassium-transporting ATPase subunit alpha-4 | ATP1A4 | E9PRA5 | 57,244.4 | 9.1 | 0.56 | 0.00 | − 100.00 | 1.30E−04 | Transporters |
| Syntaxin-8 | STX8 | Q9UNK0 | 26,906.8 | 3.7 | 0.56 | 0.00 | − 100.00 | 8.80E−07 | Transporters |
| Wiskott-Aldrich syndrome protein family member 1 | WASF1 | Q92558 | 61,652.4 | 5.4 | 0.56 | 0.00 | − 100.00 | 1.30E−04 | Cytoskeleton organization |
| Actin-related protein 2/3 complex subunit 2 | ARPC2 | O15144 | 34,333.1 | 9.1 | 1.23 | 0.00 | − 100.00 | 5.68E−03 | Cytoskeleton organization |
| Actin-related protein 2/3 complex subunit 3 | ARPC3 | O15145 | 20,415.5 | 8.8 | 0.97 | 0.00 | − 100.00 | 7.88E−03 | Cytoskeleton organization |
| Ras GTPase-activating-like protein IQGAP1 | IQGAP1 | P46940 | 189,120.8 | 6.1 | 1.25 | 0.00 | − 100.00 | 4.32E−04 | Cytoskeleton organization |
| Myosin light chain 6B | MYL6B | P14649 | 22764.1 | 6.3 | 2.23 | 0.00 | − 100.00 | 8.80E−07 | Cytoskeleton organization |
| TBC1 domain family member 31 | WDR67 | Q96DN5 | 124189.8 | 9.1 | 1.11 | 0.00 | − 100.00 | 9.75E−04 | Cytoskeleton organization |
| Prelamin-A/C | LMNA | Q5TCI8 | 55762.4 | 6.6 | 10.73 | 0.28 | − 37.73 | 1.74E−02 | Cytoskeleton organization |
| Lamin A/C | LMNA | W8QEH3 | 65116.9 | 9.1 | 11.69 | 0.00 | − 100.00 | 8.86E−03 | Cytoskeleton organization |
| Calumenin | CALU | O43852 | 34961.1 | 4.5 | 1.66 | 0.36 | − 4.60 | 2.73E−02 | Cytoskeleton organization |
| Lamina-associated polypeptide 2, isoforms beta/gamma | TMPO | P42167 | 50670.3 | 9.5 | 1.85 | 0.74 | − 2.49 | 2.75E−02 | Cytoskeleton organization |
| Kinesin-like protein | KIF15 | A0A087X0P0 | 312105.2 | 5.5 | 2.19 | 0.00 | − 100.00 | 6.76E−06 | Cytoskeleton organization |
| DnaJ homolog subfamily A member 1 | DNAJA1 | P31689 | 44868.4 | 7.2 | 1.26 | 0.36 | − 3.44 | 2.12E−02 | Protein folding |
| T-complex protein 1 subunit epsilon | CCT5 | P48643 | 59539.8 | 5.4 | 3.47 | 0.41 | − 8.39 | 9.26E−03 | Protein folding |
| T-complex protein 1 subunit beta | CCT2 | P78371 | 57357.0 | 6.0 | 1.11 | 0.00 | − 100.00 | 1.30E−04 | Protein folding |
| Cysteine and histidine-rich domain-containing protein 1 | CHORDC1 | Q9UHD1 | 37489.9 | 7.2 | 0.55 | 0.00 | − 100.00 | 6.76E−06 | Protein folding |
| CDC37 protein | CDC37 | Q6FG59 | 44453.5 | 3.7 | 1.78 | 0.41 | − 4.38 | 4.29E−02 | Protein folding |
| 26S proteasome non-ATPase regulatory subunit 7 | PSMD7 | P51665 | 37025.4 | 6.3 | 0.69 | 0.00 | − 100.00 | 1.95E−02 | Protein catabolic process |
| Proteasome subunit beta type-3 | PSMB3 | P49720 | 22949.0 | 9.1 | 0.56 | 0.00 | − 100.00 | 1.30E−04 | Protein catabolic process |
| Proteasome subunit alpha type-4 | PSMA4 | P25789 | 29483.8 | 7.6 | 0.65 | 0.00 | − 100.00 | 1.01E−03 | Protein catabolic process |
| Ubiquitin carboxyl-terminal hydrolase 43 | USP43 | Q70EL4 | 122809.5 | 9.5 | 0.83 | 0.00 | − 100.00 | 4.42E−02 | Protein catabolic process |
| Enolase-like protein ENO4 | ENO4 | J3KNX1 | 68464.9 | 6.3 | 1.11 | 0.00 | − 100.00 | 5.54E−03 | Carbohydrate metabolism |
| PCK2 protein | PCK2 | Q6IB91 | 70697.2 | 7.2 | 0.70 | 0.00 | − 100.00 | 2.17E−02 | Carbohydrate metabolism |
| Fructose-bisphosphate aldolase | ALDOC | A8MVZ9 | 36295.3 | 7.6 | 1.53 | 0.00 | − 100.00 | 2.78E−03 | Carbohydrate metabolism |
| Cytochrome c oxidase subunit 5A, mitochondrial | COX5A | H3BNX8 | 17234.9 | 7.2 | 1.24 | 0.00 | − 100.00 | 4.42E−02 | Mitochondrial metabolic process |
| Cytochrome b5 type B | CYB5B | J3KNF8 | 16694.6 | 6.3 | 0.82 | 0.00 | − 100.00 | 4.69E−02 | Mitochondrial metabolic process |
| Cytochrome b-c1 complex subunit 1, mitochondrial | UQCRC1 | P31930 | 52646.0 | 7.2 | 0.56 | 0.00 | − 100.00 | 1.30E−04 | Mitochondrial metabolic process |
| MICOS complex subunit MIC19 | CHCHD3 | Q9NX63 | 26152.4 | 9.1 | 0.70 | 0.00 | − 100.00 | 1.68E−02 | Mitochondrial metabolic process |
| Phosphoenolpyruvate carboxykinase [GTP], mitochondrial | PCK2 | Q16822 | 70730.2 | 7.2 | 0.70 | 0.00 | − 100.00 | 2.17E−02 | Mitochondrial metabolic process |
| Dihydrolipoyllysine-residue succinyltransferase component of 2-oxoglutarate dehydrogenase complex, mitochondrial | DLST | P36957 | 48755.5 | 9.5 | 0.56 | 0.00 | − 100.00 | 1.30E−04 | Mitochondrial metabolic process |
| Pyruvate dehydrogenase E1 component subunit alpha, somatic form, mitochondrial | PDHA1 | P08559 | 43295.8 | 9.1 | 0.56 | 0.00 | − 100.00 | 1.30E−04 | Mitochondrial metabolic process |
| Apoptosis inhibitor 5 | API5 | Q9BZZ5 | 59004.7 | 9.1 | 1.21 | 0.27 | − 4.44 | 4.79E−02 | Negative regulation of apoptotic process |
| Epidermal growth factor receptor | EGFR | A9CB80 | 132022.7 | 6.2 | 6.03 | 0.54 | − 11.12 | 5.65E−03 | Signal transduction |
| A-kinase anchor protein 9 | AKAP9 | Q99996 | 453668.7 | 3.7 | 0.84 | 0.00 | − 100.00 | 7.75E−05 | Signal transduction |
| Rho GDP-dissociation inhibitor 1 | ARHGDIA | J3KS60 | 9944.0 | 4.2 | 0.65 | 0.00 | − 100.00 | 5.33E−03 | Signal transduction |
| Serine/threonine-protein phosphatase PP1-alpha catalytic subunit | PPP1CA | P62136 | 37512.2 | 7.2 | 1.81 | 0.00 | − 100.00 | 4.26E−03 | Signal transduction |
Sul sulbactam, Dox doxorubicin
aThe fold is from Dox/Dox + Sul, and “−” means the expression of protein was decrease in Dox + Sul group. If the number of Dox + Sul is 0.00, the fold would be shown as − 100.00
Fig. 3.

Differentially expressed proteins in the MDA-MB-468 cells in the presence of sulbactam and doxorubicin. Proteins are represented as nodes. a Upregulated proteins in the Dox/Sul-treated MDA-MB-468 cells. Red nodes indicate proteins that are related to the response to stimulus. b Downregulated proteins in the Dox/Sul-treated MDA-MB-468 cells. Red nodes indicate the proteins that are related to gene expression. Sul sulbactam, Dox doxorubicin
Sulbactam downregulates mRNA levels of ABC transporters in breast cancer cell lines
Sulbactam significantly reduced ABC transporter protein expression in A. baumannii ATCC 19606. Breast cancer cells can actively remove doxorubicin from inside the cells by using ABC transporters to protect the cells from being killed by doxorubicin. LC–MS/MS results showed a reduction in the protein levels of ABCA8, ABCB1, and ABCG2; hence, we examined whether sulbactam can inhibit the mRNA expression of ABC transporters in the human breast cancer cells in the presence of doxorubicin. Two breast cancer cell lines, MDA-MB-453 and MDA-MB-468, were treated with 0.1 μM doxorubicin and 2 mM sulbactam for 24 h. The mRNA expression of the ABC transporters in these two cell lines were measured using real-time RT-PCR. In the presence of doxorubicin, sulbactam significantly reduced the mRNA expression of ABCB1, ABCB5, and ABCG2 by approximately 50% in the MDA-MB-453 and MDA-MB-468 cells (Fig. 4). Sulbactam also moderately reduced the mRNA expression of ABCB8, ABCB10, ABCC1, ABCC2, ABCC3, ABCC4, and ABCC5 in the MDA-MB-453 cells and those of ABCB8, ABCB10, ABCC2, ABCC5, and ABCC10 in the MDA-MB-468 cells by 20–30%. These results indicate that sulbactam downregulated the mRNA expression of several ABC transporters, particularly ABCB1, ABCB5, and ABCG2. These results also demonstrate that the combination of sulbactam and doxorubicin enhanced the sensitivity of the cells to doxorubicin by downregulating the expressions of ABC transporters related to the efflux of doxorubicin.
Fig. 4.
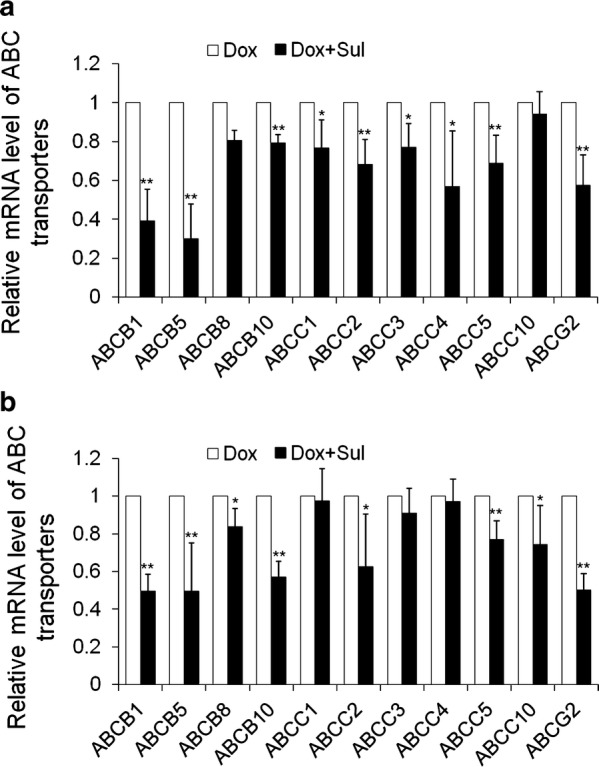
Co-treatment of sulbactam and doxorubicin downregulated mRNA expression levels of ABC transporters. a MDA-MB-453 and b MDA-MB-468. The relative mRNA expression levels are expressed as compared with Dox-treated cells where the mRNA expression levels were assumed to be 1. Reported values represent mean ± SD of at least three independent experiments, each performed in triplicate. *p < 0.05 and **p < 0.01 versus only Dox-treated cells. Sul sulbactam, Dox doxorubicin, SD standard deviation
Sulbactam prolongs doxorubicin retention in breast cancer cells
To investigate whether the sulbactam-induced reduction in the expression of ABC transporters inhibits the efflux of doxorubicin, the distribution of doxorubicin in breast cancer cells was observed using a confocal microscope. A time-course study was performed in the presence and absence of sulbactam. For comparison, the cells were also pretreated with verapamil, a well-known inhibitor of ABCB1 and ABCG2. The fluorescent signal corresponding to doxorubicin was primarily observed in nuclei of the cells, and the concentration of doxorubicin decreased time-dependently (Fig. 5). Pretreatment with sulbactam increased the doxorubicin concentration in the cell nuclei by 15, 45, and 74% in the MDA-MB-453 cells and 17, 26, and 44% in the MDA-MB-468 cells at 8, 12, and 16 h, respectively, compared with that in cells without sulbactam treatment. The intensities of doxorubicin were comparable between the sulbactam- and verapamil-treated MDA-MB-453 cells. Doxorubicin concentration was higher in the sulbactam-treated MDA-MB-468 cells than in the verapamil-treated cells. These results indicate that sulbactam inhibited the efflux of doxorubicin, thus prolonging doxorubicin retention in the breast cancer cells. The increase in intracellular doxorubicin levels resulted in an increase in its cytotoxicity in the breast cancer cells.
Fig. 5.

Prolonged doxorubicin retention in breast cancer cells in the presence of sulbactam. The distribution of Dox in the a MDA-MB-453 and c MDA-MB-468 cells was observed. Dox is shown in red and DAPI in blue, which counterstained the nuclei. Scale bars, 20 μm. b, d are quantifications of a, c, respectively. Reported values indicate the means of fluorescence intensity of Dox overlapping with DAPI and are represented as mean ± SD. **p < 0.01 versus only Dox-treated cells. Sul sulbactam, Dox doxorubicin, SD standard deviation, Vera verapamil, DAPI (4′,6-diamidino-2-phenylindole)
Discussion
The coadministration of sulbactam and a β-lactam antibiotic, such as ampicillin, is an effective therapy against bacteria, such as A. baumannii [42]. Sulbactam alone has intrinsic bactericidal effects against multidrug-resistant A. baumannii because it inhibits the expression of the ABC transporters as well as that of 30S and 50S ribosomal subunit proteins [38]. However, the effects of sulbactam have not been explored in mammalian cells, thus far. Our study results suggest that sulbactam enhanced the cytotoxicity of doxorubicin in many of the tested breast cancer cell lines. Because of the high heterogeneity of breast cancer, we classified breast cancer cell lines as hormone-receptor-positive cancer, HER2-positive cancer, and TNBC; the cells were then treated with sulbactam and doxorubicin. All the cell lines responded to doxorubicin and sulbactam—a finding is evidently uncorrelated with the characteristic of these cell lines. Thus, a combination of doxorubicin and sulbactam exhibited the most significant cytotoxicity in the MDA-MB-453 and MDA-MB-468 cells. Dose-dependency tests showed that approximately 1–8 mM sulbactam was not cytotoxic to MDA-MB-453, MDA-MB-468, and MCF10A cells, which are typically used as normal breast cell lines; hence, in combination with doxorubicin, sulbactam exerted a synergistic effect on doxorubicin.
The results of LC–MS/MS indicated that most of the upregulated proteins (21/66) associated with stress and DNA damage response, such as heat shock-related 70-kDa protein 2 and adenomatous polyposis coli protein, may respond to the stress caused by sulbactam. When used as a drug, sulbactam also stimulates some metabolic pathways and cytoskeleton organizations, such as carbohydrate metabolism and tubulin-associated cytoskeleton organization. In the presence of doxorubicin and sulbactam evidently inhibited the initiation of RNA processing, transcription, and translation (Fig. 6). Doxorubicin interacts with DNA through intercalation between bases and macromolecular biosynthesis inhibition [19]. This inhibits the progression of topoisomerase II, which relaxes supercoils in DNA during transcription. Through intercalation, doxorubicin can also induce histone eviction from transcriptionally active chromatin [43]. Consequently, here, RNA processing and translation were downregulated in the doxorubicin-exposed cells. Sulbactam increased the doxorubicin retention time in the breast cancer cells. Therefore, in the presence of sulbactam, the effects of doxorubicin on transcription and translation were enhanced, and the 60S ribosomal proteins, namely L4, L17, L24, L37a, and 40S ribosomal protein 3A, and translation initiation-associated proteins, namely eIF1A, eIF3, eIF4G1, eIF6, and eEF1B, were downregulated. Hence, the initiation of the translation pathway was inhibited (Fig. 6). The results of LC–MS/MS also indicated that the expression of ABC transporter proteins ABCA8, ABCB1, and ABCG2 were downregulated, corresponding to our previous finding that sulbactam inhibits ABC transporters of A. baumannii and thus kills the bacterium [38]. Most ABC transporter families are transmembrane proteins, which are difficult to isolate and identify through total protein LC–MS/MS; hence, we used real-time RT-PCR to determine the effects of sulbactam on the mRNA expression of the ABC transporter proteins. The expression of ABC transporter proteins in breast cancer cells is highly heterogeneous [33, 44]; thus, we selected the ABCB superfamily, the ABCC superfamily, and ABCG2, which are strongly associated with drug resistance in breast cancer cells [23, 26, 32]. Based on the results of other studies and our PCR analysis, we selected ABCB1, ABCB2, ABCB8, ABCB10, ABCC1, ABCC2, ABCC3, ABCC4, ABCC5, ABCC10, and ABCG2, which exhibit high mRNA expression levels for precise real-time RT-PCR analysis.
Fig. 6.

Co-treatment of sulbactam and doxorubicin blocked the initiation of translation in breast cancer cells. The illustration shows that treatment of the MDA-MB-468 cells with Sul (blue circles) and Dox (red circles) reduced the protein expression levels of eIF1A, eIF3, eIF4G1/3, eIF6, small 40S subunit, and large 60S subunit in the cells. Therefore, the transcription and initiation of translation pathways were blocked. Sul sulbactam, Dox doxorubicin
Although the effects of sulbactam on these ABC transporters were different in MDA-MB-453 and MDA-MB-468 cells, we conclude that in the presence of sulbactam and doxorubicin, the mRNAs levels of the indicated ABC transporter proteins were evidently downregulated. ABCB1, ABCB5, ABCB8, ABCC1, ABCC2, ABCC3, and ABCG2 [22, 45–48] were considered to confer resistance to doxorubicin on the breast cancer cells. We further found that ABCB10, ABCC4, and ABCC5 in the MDA-MB-453 cells and ABCB10, ABCC5, and ABCC10 in the MDA-MB-468 cells also responded to sulbactam treatment. Studies have reported that ABCB5, ABCB8, ABCB10, ABCC2–5, and ABCC10 are overexpressed in breast cancer cells or are associated with breast cancer progression [44, 49–53]. Our doxorubicin efflux assay also indicated that in the presence of sulbactam, the retention time of doxorubicin in MDA-MB-453 and MDA-MB-468 cells was prolonged significantly. We used the computer simulation and found that sulbactam may compete with ATP for the ATP-docking sites of ABCB1, ABCB10, ABCC1, and MsbA, which exhibit structures similar to the ABCG2 (data not shown). This result provides a possibility how sulbactam inhibits the expression and function of ABC transporters, and this possibility is worthy to do more experiments to confirm it.
Conclusion
In conclusion, this is the first study that using sulbactam in the mammalian cell. The combination of sulbactam and doxorubicin can enhance the cytotoxicity of doxorubicin in the breast cancer cells by inhibiting the transcription and initiation of translation associated proteins and ABC transporters, reducing their expression, and blocking the efflux of doxorubicin, thus triggering apoptosis in the breast cancer cells. From these results, sulbactam can be used in breast cancer treatment which can decrease the prescribed dose of doxorubicin to avoid the adverse effects.
Authors’ contributions
KRL conceived and supervised the study. SHW and SCS performed most of the experiments, analyzed and interpreted the data, and wrote the first manuscript draft. BHL involved the discussion and supervised the study. CHL conducted some of the experiment and undertook some data interpretation. All authors read and approved the final manuscript.
Acknowledgements
Not applicable.
Competing interests
The authors declare that they have no competing interests.
Availability of data and materials
All data generated or analysed during this study are included in this published article.
Consent for publication
Not applicable.
Ethics approval and consent to participate
Not applicable.
Funding
This research was supported by a grant from the “Good-Neighbor Fund” of Mackay Memorial Hospital (Hsin-chu, Taiwan).
Publisher’s Note
Springer Nature remains neutral with regard to jurisdictional claims in published maps and institutional affiliations.
Abbreviations
- MDR
multidrug resistance
- ATP
adenosine triphosphate
- ABC
ATP-binding cassette
- MTT
3-(4,5-dimethylthiazol-2-yl)-2,5-diphenyltetrazolium bromide
- HER2
human epidermal growth factor receptor 2
- TNBC
triple-negative breast cancer
- P-gp
P-glycoprotein
- PBP
penicillin-binding protein
- DMEM
Dulbecco’s modified Eagle’s medium
- FBS
fetal bovine serum
- RPMI
Roswell Park Memorial Institute
- IC50
the half maximal inhibitory concentration
- RT-PCR
reverse transcription-polymerase chain reaction
- PCR
polymerase chain reaction
- PBS
phosphate buffered saline
- SDS-PAGE
sodium dodecyl sulfate–polyacrylamide gel electrophoresis
- ACN
acetonitrile
- LC
liquid chromatography
- MS/MS
tandem mass spectrometry
- ICR
ion cyclotron resonance
- ΔG
Gibbs free energy
- ER
estrogen receptor
- PR
progesterone receptor
- Sul
sulbactam
- Dox
doxorubicin
- Vera
verapamil
Contributor Information
Shao-hsuan Wen, Email: wen.shaohsuan@gmail.com.
Shey-chiang Su, Email: 4267@mail.pch.org.tw.
Bo-huang Liou, Email: 2031@mmh.org.tw.
Cheng-hao Lin, Email: slsampras@gmail.com.
Kuan-rong Lee, Email: krlee@mx.nthu.edu.tw.
References
- 1.Fitzmaurice C, Dicker D, Pain A, Hamavid H, Moradi-Lakeh M, MacIntyre MF, et al. The global burden of cancer 2013. JAMA Oncol. 2015;1(4):505–527. doi: 10.1001/jamaoncol.2015.0735. [DOI] [PMC free article] [PubMed] [Google Scholar]
- 2.Siegel RL, Miller KD, Jemal A. Cancer statistics, 2015. CA Cancer J Clin. 2015;65(1):5–29. doi: 10.3322/caac.21254. [DOI] [PubMed] [Google Scholar]
- 3.Martin HL, Smith L, Tomlinson DC. Multidrug-resistant breast cancer: current perspectives. Breast Cancer. 2014;6:1. doi: 10.2147/BCTT.S37638. [DOI] [PMC free article] [PubMed] [Google Scholar]
- 4.Liu P, Kumar IS, Brown S, Kannappan V, Tawari PE, Tang JZ, et al. Disulfiram targets cancer stem-like cells and reverses resistance and cross-resistance in acquired paclitaxel-resistant triple-negative breast cancer cells. Br J Cancer. 2013;109(7):1876. doi: 10.1038/bjc.2013.534. [DOI] [PMC free article] [PubMed] [Google Scholar]
- 5.Gonzalez-Angulo AM, Morales-Vasquez F, Hortobagyi GN. Overview of resistance to systemic therapy in patients with breast cancer. In: Breast cancer chemosensitivity. New York: Springer; 2007. p. 1–22. [DOI] [PubMed]
- 6.Musgrove EA, Sutherland RL. Biological determinants of endocrine resistance in breast cancer. Nat Rev Cancer. 2009;9(9):631. doi: 10.1038/nrc2713. [DOI] [PubMed] [Google Scholar]
- 7.Clarke R, Dickson RB, Brünner N. The process of malignant progression in human breast cancer. Ann Oncol. 1990;1(6):401–407. doi: 10.1093/oxfordjournals.annonc.a057790. [DOI] [PubMed] [Google Scholar]
- 8.Coley HM. Mechanisms and consequences of chemotherapy resistance in breast cancer. Eur J Cancer Suppl. 2009;7(1):3–7. doi: 10.1016/S1359-6349(09)70003-5. [DOI] [Google Scholar]
- 9.Szakács G, Paterson JK, Ludwig JA, Booth-Genthe C, Gottesman MM. Targeting multidrug resistance in cancer. Nat Rev Drug Discov. 2006;5(3):219. doi: 10.1038/nrd1984. [DOI] [PubMed] [Google Scholar]
- 10.Higgins CF. Multiple molecular mechanisms for multidrug resistance transporters. Nature. 2007;446(7137):749. doi: 10.1038/nature05630. [DOI] [PubMed] [Google Scholar]
- 11.Longley DB, Ferguson PR, Boyer J, Latif T, Lynch M, Maxwell P, et al. Characterization of a thymidylate synthase (TS)-inducible cell line: a model system for studying sensitivity to TS-and non-TS-targeted chemotherapies. Clin Cancer Res. 2001;7(11):3533–3539. [PubMed] [Google Scholar]
- 12.Wang HY, Cheng Z, Malbon CC. Overexpression of mitogen-activated protein kinase phosphatases MKP1, MKP2 in human breast cancer. Cancer Lett. 2003;191(2):229–237. doi: 10.1016/S0304-3835(02)00612-2. [DOI] [PubMed] [Google Scholar]
- 13.Longley DB, Johnston PG. Molecular mechanisms of drug resistance. J Pathol. 2005;205(2):275–292. doi: 10.1002/path.1706. [DOI] [PubMed] [Google Scholar]
- 14.Colmegna B, Morosi L, D’Incalci M. Molecular and pharmacological mechanisms of drug resistance: an evolving paradigm. Handb Exp Pharmacol. 2017 doi: 10.1007/164_2017_20. [DOI] [PubMed] [Google Scholar]
- 15.Chaney SG, Sancar A. DNA repair: enzymatic mechanisms and relevance to drug response. J Natl Cancer Inst. 1996;88(19):1346–1360. doi: 10.1093/jnci/88.19.1346. [DOI] [PubMed] [Google Scholar]
- 16.Arcamone F, Cassinelli G, Fantini G, Grein A, Orezzi P, Pol C, et al. Adriamycin, 14-hydroxydaunomycin, a new antitumor antibiotic from S. peucetius var. caesius. Biotechnol Bioeng. 2000;67(6):704–713. doi: 10.1002/(SICI)1097-0290(20000320)67:6<704::AID-BIT8>3.0.CO;2-L. [DOI] [PubMed] [Google Scholar]
- 17.Momparler RL, Karon M, Siegel SE, Avila F. Effect of adriamycin on DNA, RNA, and protein synthesis in cell-free systems and intact cells. Cancer Res. 1976;36(8):2891–2895. [PubMed] [Google Scholar]
- 18.Wang S, Kotamraju S, Konorev E, Kalivendi S, Joseph J, Kalyanaraman B. Activation of nuclear factor-kappaB during doxorubicin-induced apoptosis in endothelial cells and myocytes is pro-apoptotic: the role of hydrogen peroxide. Biochem J. 2002;367(Pt 3):729. doi: 10.1042/bj20020752. [DOI] [PMC free article] [PubMed] [Google Scholar]
- 19.Tacar O, Sriamornsak P, Dass CR. Doxorubicin: an update on anticancer molecular action, toxicity and novel drug delivery systems. J Pharm Pharmacol. 2013;65(2):157–170. doi: 10.1111/j.2042-7158.2012.01567.x. [DOI] [PubMed] [Google Scholar]
- 20.Meredith AM, Dass CR. Increasing role of the cancer chemotherapeutic doxorubicin in cellular metabolism. J Pharm Pharmacol. 2016;68(6):729–741. doi: 10.1111/jphp.12539. [DOI] [PubMed] [Google Scholar]
- 21.Taylor CW, Dalton WS, Parrish PR, Gleason MC, Bellamy WT, Thompson FH, et al. Different mechanisms of decreased drug accumulation in doxorubicin and mitoxantrone resistant variants of the MCF7 human breast cancer cell line. Br J Cancer. 1991;63(6):923. doi: 10.1038/bjc.1991.202. [DOI] [PMC free article] [PubMed] [Google Scholar]
- 22.Wind NS, Holen I. Multidrug resistance in breast cancer: from in vitro models to clinical studies. Int J Breast Cancer. 2011;2011:967419. doi: 10.4061/2011/967419. [DOI] [PMC free article] [PubMed] [Google Scholar]
- 23.Noguchi K, Katayama K, Sugimoto Y. Human ABC transporter ABCG2/BCRP expression in chemoresistance: basic and clinical perspectives for molecular cancer therapeutics. Pharmacogenomics Pers Med. 2014;7:53. doi: 10.2147/PGPM.S38295. [DOI] [PMC free article] [PubMed] [Google Scholar]
- 24.Clarke R, Leonessa F, Trock B. Multidrug resistance/P-glycoprotein and breast cancer: review and meta-analysis. In: Seminars in oncology. Vol. 32. New York: Elsevier; 2005. p. 9–15. [DOI] [PubMed]
- 25.Kathawala RJ, Gupta P, Ashby CR, Jr, Chen ZS. The modulation of ABC transporter-mediated multidrug resistance in cancer: a review of the past decade. Drug Resist Updat. 2015;18:1–7. doi: 10.1016/j.drup.2014.11.002. [DOI] [PubMed] [Google Scholar]
- 26.Borst P, Evers R, Kool M, Wijnholds J. A family of drug transporters: the multidrug resistance-associated proteins. J Natl Cancer Inst. 2000;92(16):1295–1302. doi: 10.1093/jnci/92.16.1295. [DOI] [PubMed] [Google Scholar]
- 27.Fletcher JI, Haber M, Henderson MJ, Norris MD. ABC transporters in cancer: more than just drug efflux pumps. Nat Rev Cancer. 2010;10(2):147. doi: 10.1038/nrc2789. [DOI] [PubMed] [Google Scholar]
- 28.Bao L, Haque A, Jackson K, Hazari S, Moroz K, Jetly R, et al. Increased expression of P-glycoprotein is associated with doxorubicin chemoresistance in the metastatic 4T1 breast cancer model. Am J Pathol. 2011;178(2):838–852. doi: 10.1016/j.ajpath.2010.10.029. [DOI] [PMC free article] [PubMed] [Google Scholar]
- 29.Kunická T, Souček P. Importance of ABCC1 for cancer therapy and prognosis. Drug Metab Rev. 2014;46(3):325–342. doi: 10.3109/03602532.2014.901348. [DOI] [PubMed] [Google Scholar]
- 30.Futscher BW, Foley NE, Gleason-Guzman MC, Meltzer PS, Sullivan DM, Dalton WS. Verapamil suppresses the emergence of P-glycoprotein-mediated multi-drug resistance. Int J Cancer. 1996;66(4):520–525. doi: 10.1002/(SICI)1097-0215(19960516)66:4<520::AID-IJC16>3.0.CO;2-B. [DOI] [PubMed] [Google Scholar]
- 31.Akimoto H, Bruno NA, Slate DL, Billingham ME, Torti SV, Torti FM. Effect of verapamil on doxorubicin cardiotoxicity: altered muscle gene expression in cultured neonatal rat cardiomyocytes. Cancer Res. 1993;53(19):4658–4664. [PubMed] [Google Scholar]
- 32.Li W, Zhang H, Assaraf YG, Zhao K, Xu X, Xie J, et al. Overcoming ABC transporter-mediated multidrug resistance: molecular mechanisms and novel therapeutic drug strategies. Drug Resist Updat. 2016;27:14–29. doi: 10.1016/j.drup.2016.05.001. [DOI] [PubMed] [Google Scholar]
- 33.Szakács G, Annereau JP, Lababidi S, Shankavaram U, Arciello A, Bussey KJ, et al. Predicting drug sensitivity and resistance: profiling ABC transporter genes in cancer cells. Cancer Cell. 2004;6(2):129–137. doi: 10.1016/j.ccr.2004.06.026. [DOI] [PubMed] [Google Scholar]
- 34.Adnan S, Paterson DL, Lipman J, Roberts JA. Ampicillin/sulbactam: its potential use in treating infections in critically ill patients. Int J Antimicrob Agents. 2013;42(5):384–389. doi: 10.1016/j.ijantimicag.2013.07.012. [DOI] [PubMed] [Google Scholar]
- 35.Penwell WF, Shapiro AB, Giacobbe RA, Gu RF, Gao N, Thresher J, et al. Molecular mechanisms of sulbactam antibacterial activity and resistance determinants in Acinetobacter baumannii. Antimicrob Agents Chemother. 2015;59(3):1680–1689. doi: 10.1128/AAC.04808-14. [DOI] [PMC free article] [PubMed] [Google Scholar]
- 36.Noguchi JK, Gill MA. Sulbactam: a beta-lactamase inhibitor. Clin Pharm. 1988;7(1):37–51. [PubMed] [Google Scholar]
- 37.Papp-Wallace KM, Senkfor B, Gatta J, Chai W, Taracila MA, Shanmugasundaram V, et al. Early insights into the interactions of different β-lactam antibiotics and β-lactamase inhibitors against soluble forms of Acinetobacter baumannii PBP1a and Acinetobacter sp. PBP3. Antimicrob Agents Chemother. 2012;56(11):5687–5692. doi: 10.1128/AAC.01027-12. [DOI] [PMC free article] [PubMed] [Google Scholar]
- 38.Lin CH, Su SC, Ho KH, Hsu YW, Lee KR. Bactericidal effect of sulbactam against Acinetobacter baumannii ATCC 19606 studied by 2D-DIGE and mass spectrometry. Int J Antimicrob Agents. 2014;44(1):38–46. doi: 10.1016/j.ijantimicag.2014.03.004. [DOI] [PubMed] [Google Scholar]
- 39.van Veen HW, Callaghan R, Soceneantu L, Sardini A, Konings WN, Higgins CF. A bacterial antibiotic-resistance gene that complements the human multidrug-resistance P-glycoprotein gene. Nature. 2014;391(6664):291. doi: 10.1038/34669. [DOI] [PubMed] [Google Scholar]
- 40.Ter Beek J, Guskov A, Slotboom DJ. Structural diversity of ABC transporters. J Gen Physiol. 2014;143(4):419–435. doi: 10.1085/jgp.201411164. [DOI] [PMC free article] [PubMed] [Google Scholar]
- 41.Shevchenko A, Tomas H, Havli J, Olsen JV, Mann M. In-gel digestion for mass spectrometric characterization of proteins and proteomes. Nat Protoc. 2006;1(6):2856. doi: 10.1038/nprot.2006.468. [DOI] [PubMed] [Google Scholar]
- 42.Levin AS. Multiresistant Acinetobacter infections: a role for sulbactam combinations in overcoming an emerging worldwide problem. Clin Microbiol Infect. 2002;8(3):144–153. doi: 10.1046/j.1469-0691.2002.00415.x. [DOI] [PubMed] [Google Scholar]
- 43.Pang B, Qiao X, Janssen L, Velds A, Groothuis T, Kerkhoven R, et al. Drug-induced histone eviction from open chromatin contributes to the chemotherapeutic effects of doxorubicin. Nat Commun. 2013;4:1908. doi: 10.1038/ncomms2921. [DOI] [PMC free article] [PubMed] [Google Scholar]
- 44.Gillet JP, Schneider J, Bertholet V, De Longueville FR, Remacle J, Efferth T. Microarray expression profiling of ABC transporters in human breast cancer. Cancer Genomics Proteomics. 2006;3(2):97–106. [PubMed] [Google Scholar]
- 45.Elliott AM, Al-Hajj MA. ABCB8 mediates doxorubicin resistance in melanoma cells by protecting the mitochondrial genome. Mol Cancer Res. 2009;7(1):79–87. doi: 10.1158/1541-7786.MCR-08-0235. [DOI] [PubMed] [Google Scholar]
- 46.Frank NY, Margaryan A, Huang Y, Schatton T, Waaga-Gasser AM, Gasser M, et al. ABCB5-mediated doxorubicin transport and chemoresistance in human malignant melanoma. Cancer Res. 2005;65(10):4320–4333. doi: 10.1158/0008-5472.CAN-04-3327. [DOI] [PubMed] [Google Scholar]
- 47.Cui Y, König J, Buchholz U, Spring H, Leier I, Keppler D. Drug resistance and ATP-dependent conjugate transport mediated by the apical multidrug resistance protein, MRP2, permanently expressed in human and canine cells. Mol Pharmacol. 1999;55(5):929–937. [PubMed] [Google Scholar]
- 48.Young LC, Campling BG, Cole SP, Deeley RG, Gerlach JH. Multidrug resistance proteins MRP3, MRP1, and MRP2 in lung cancer: correlation of protein levels with drug response and messenger RNA levels. Clin Cancer Res. 2001;7(6):1798–1804. [PubMed] [Google Scholar]
- 49.Yang JY, Ha SA, Yang YS, Kim JW. p-Glycoprotein ABCB5 and YB-1 expression plays a role in increased heterogeneity of breast cancer cells: correlations with cell fusion and doxorubicin resistance. BMC Cancer. 2010;10(1):388. doi: 10.1186/1471-2407-10-388. [DOI] [PMC free article] [PubMed] [Google Scholar]
- 50.Balaji SA, Udupa N, Chamallamudi MR, Gupta V, Rangarajan A. Role of the drug transporter ABCC3 in breast cancer chemoresistance. PLoS ONE. 2016;11(5):e0155013. doi: 10.1371/journal.pone.0155013. [DOI] [PMC free article] [PubMed] [Google Scholar]
- 51.Ge G, Zhou C, Ren Y, Tang X, Wang K, Zhang W, et al. Enhanced SLC34A2 in breast cancer stem cell-like cells induces chemotherapeutic resistance to doxorubicin via SLC34A2-Bmi1-ABCC5 signaling. Tumor Biol. 2016;37(4):5049–5062. doi: 10.1007/s13277-015-4226-0. [DOI] [PubMed] [Google Scholar]
- 52.Liu Y, Peng H, Zhang JT. Expression profiling of ABC transporters in a drug-resistant breast cancer cell line using AmpArray. Mol Pharmacol. 2005;68(2):430–438. doi: 10.1124/mol.105.011015. [DOI] [PubMed] [Google Scholar]
- 53.Hlaváč V, Brynychová V, Václavíková R, Ehrlichová M, Vrána D, Pecha V, et al. The expression profile of ATP-binding cassette transporter genes in breast carcinoma. Pharmacogenomics. 2013;14(5):515–529. doi: 10.2217/pgs.13.26. [DOI] [PubMed] [Google Scholar]
Associated Data
This section collects any data citations, data availability statements, or supplementary materials included in this article.
Data Availability Statement
All data generated or analysed during this study are included in this published article.