Abstract
Aims
To provide comprehensive information on the access and use of cardiac implantable electronic devices (CIED) and catheter ablation procedures in Africa.
Methods and results
The Pan-African Society of Cardiology (PASCAR) collected data on invasive management of cardiac arrhythmias from 2011 to 2016 from 31 African countries. A specific template was completed by physicians, and additional information obtained from industry. Information on health care systems, demographics, economics, procedure rates, and specific training programs was collected. Considerable heterogeneity in the access to arrhythmia care was observed across Africa. Eight of the 31 countries surveyed (26%) did not perform pacemaker implantations. The median pacemaker implantation rate was 2.66 per million population per country (range: 0.14–233 per million population). Implantable cardioverter-defibrillator and cardiac resynchronization therapy were performed in 12/31 (39%) and 15/31 (48%) countries respectively, mostly by visiting teams. Electrophysiological studies, including complex catheter ablations were performed in all countries from Maghreb, but only one sub-Saharan African country (South Africa). Marked variation in cost (up to 1000-fold) was observed across countries with an inverse correlation between implant rates and the procedure fees standardized to the gross domestic product per capita. Lack of economic resources and facilities, high cost of procedures, deficiency of trained physicians, and non-existent fellowship programs were the main drivers of under-utilization of interventional cardiac arrhythmia care.
Conclusion
There is limited access to CIED and ablation procedures in Africa. A quarter of countries did not have pacemaker implantation services, and catheter ablations were only available in one country in sub-Saharan Africa.
Keywords: Pacemaker, Cardiac resynchronization therapy, Implantable cardioverter-defibrillator, Cardiac electrophysiology, Africa, Interventional electrophysiological procedures, Catheter ablation
What’s new?
This survey highlights the appalling lack of infrastructure and human resource available for the management of cardiac arrhythmias in sub-Saharan Africa.
There is no consistent access to invasive therapies (pacing/catheter ablation) in 30% of the African countries.
The pacemaker implantation rate of pacemakers is 200-fold lower than in Western Europe.
The very low density of trained physicians, lack of economic resources and facilities, high-procedural costs in the setting of pay-out-of-pocket health care, and a shortage of fellowship programmes remain the main drivers for under-utilization of interventional arrhythmia therapies in Africa.
The data can serve as a roadmap for future strategic initiatives to develop cardiac arrhythmia services in the African countries including more ambitious public health expenditure, more efficient training of personnel, and improved infrastructure development.
Introduction
Cardiac arrhythmias are under diagnosed and pacing and electrophysiological (EP) procedures remain poorly developed in most African countries.1 While there is some information on pacemaker implantation, implantable cardioverter-defibrillator (ICD), and cardiac electrophysiology services in a few sub-Saharan African (SSA) countries,2–11 there are no studies addressing the question of access to cardiac implantable electronic devices (CIED) and ablation techniques in Africa. The Cardiac Arrhythmia and Pacing Task Forces of the Pan-African Society of Cardiology (PASCAR) sought to carry out a comprehensive assessment of device implantations and EP procedures in African countries and to determine the major influencing factors, including demographic, social, economic, and health governance aspects.
Methodology
The PASCAR Cardiac Arrhythmias and Pacing Task Forces collected comparative statistics from 31 countries representing all regions of Africa, with the aim of providing comprehensive information on EP activity, and EP staff, in relation to the demographic and economic aspects of the African continent. A questionnaire on activities of centres in the various countries affiliated to the PASCAR was sent to cardiologists and cardiac surgeons on the PASCAR mailing list, EP physicians, and heads of cardiology departments; these data were cross-checked by device manufacturers (Biotronik, Boston Scientific, Medtronic, Saint Jude Medical-Abott, and Liva Nova) and local distributors who were provided information of CIED sales. For countries outside the PASCAR network, we requested official governmental information on the existence (or otherwise) of CIED and EP services (Sao Tome and Principle for instance). Finally, reports on demographic, social, economic and financial, and vital statistics came from World Bank, World Health Organization (WHO), and International Monetary Fund database.12,13
The questionnaire sent to local investigators focused on the annual activity during the study period regarding (i) patient’s demographics, estimates of the total number of medical staff, EP physicians, affiliated centres by country, curriculum, and specific training programs; (ii) pacemakers, cardiac resynchronization therapy (CRT), ICD implantations; (iii) the availability of isoprenaline and temporary pacing as a bridge to permanent pacemaker insertion; (iv) EP studies and catheter ablations procedures; and (v) details on local costs of invasive procedures. We attempted to establish the association between the cost of procedures, the gross domestic product (GDP) per capita, and the implantation rates.
This is a descriptive study. Statistical analysis was made using Microsoft Excel. Mean (standard deviation), median (interquartile range), and ranges were used as appropriate for the different variables. The rates were standardized by the population in the corresponding country, and implantation rates were presented per million of population.
Results
Demographics, societal, financial and economic, and vital statistics aspects
Distribution of the population, vital statistics, and GDP of the 31 countries surveyed are presented in Table 1.
Table 1.
Socio-demographics and vital status of 31 African countries
| Country | Population | Population growth rate (%) | Life expectancy at birth | Death rate/1000 population | GDP (×1000 billion USD) | GDP per capita (USD) | Health expenditure as % of GDP (2014) | Health expenditures per capita | Human development index (2010–15) |
|
|---|---|---|---|---|---|---|---|---|---|---|
| World rank | Study sample rank | |||||||||
| Mauritius | 1 260 934 | 0.2 | 74 | 8 | 12 803 445.9 | 10 153.9 | 4.8 | 482 | 64 | 1 |
| Algeria | 39 113 313 | 2 | 75 | 5 | 213 983 107.8 | 5470.9 | 7.2 | 362 | 83 | 2 |
| Tunisia | 11 143 908 | 1.2 | 75 | 7 | 47 603 227.9 | 4271.7 | 7 | 305 | 97 | 3 |
| Lybia | 6 204 108 | 0.1 | 72 | 5 | N/A | N/A | 5 | 372 | 102 | 4 |
| Gabon | 1 875 713 | 3.2 | 64 | 9 | 18 179 717.8 | 9692.2 | 3.4 | 321 | 109 | 5 |
| Egypt | 91 812 566 | 2.2 | 71 | 6 | 305 529 656.5 | 3327.8 | 5.6 | 178 | 111 | 6 |
| South Africa | 54 146 735 | 1.6 | 57 | 12 | 350 850 571.8 | 6479.6 | 8.8 | 570 | 119 | 7 |
| Morocco | 34 318 082 | 1.4 | 74 | 6 | 109 881 398.5 | 3154.5 | 5.9 | 190 | 123 | 8 |
| Congo. Rep | 4 871 101 | 2.5 | 62 | 9 | 14 177 437.6 | 2910.5 | 5.2 | 162 | 135 | 9 |
| Equatorial Guinea | 1 129 424 | 4.1 | 58 | 11 | 21 461 989.5 | 19 002.6 | 3.7 | 663 | 135 | 9 |
| Ghana | 26 962 563 | 2.3 | 61 | 9 | 38 616 536.1 | 1432.2 | 3.6 | 58 | 139 | 10 |
| Sao Tome et Principe | 191 266 | 2.2 | 66 | 7 | 348 463.5 | 1821.9 | 8.3 | 166 | 142 | 11 |
| Kenya | 46 024 250 | 2.6 | 62 | 8 | 61 445 346.0 | 1335.1 | 5.7 | 78 | 146 | 12 |
| Tanzania | 52 234 869 | 3.1 | 65 | 7 | 48 197 218.3 | 950.4 | 5.6 | 52 | 151 | 13 |
| Nigeria | 176 460 502 | 2.7 | 53 | 13 | 568 498 939.8 | 3221.7 | 3.7 | 118 | 152 | 14 |
| Cameroon | 22 239 904 | 2.7 | 55 | 11 | 32 050 817.6 | 1441.1 | 4.1 | 59 | 154 | 15 |
| Mauritania | 4 063 920 | 2.9 | 63 | 8 | 5 391 475.9 | 1326.7 | 3.8 | 49 | 157 | 16 |
| Rwanda | 11 345 357 | 2.5 | 64 | 7 | 8 016 288.4 | 706.6 | 7.5 | 52 | 159 | 17 |
| Senegal | 14 546 111 | 3 | 66 | 6 | 15 308 965.4 | 1052.4 | 4.7 | 50 | 162 | 18 |
| Sudan | 37 737 913 | 2.4 | 63 | 8 | 82 151 588.4 | 2176.9 | 8.4 | 130 | 165 | 19 |
| Uganda | 38 833 338 | 3.4 | 58 | 10 | 27 927 875.3 | 719.2 | 7.2 | 52 | 163 | 19 |
| Togo | 7 228 915 | 2.6 | 60 | 9 | 4 482 880.4 | 620.1 | 5.2 | 34 | 166 | 20 |
| Benin | 10 286 712 | 2.8 | 60 | 9 | 9 707 432.0 | 943.7 | 4.6 | 38 | 167 | 21 |
| IvoryCoast | 22 531 350 | 2.5 | 52 | 14 | 35 372 603.5 | 1569.9 | 5.7 | 88 | 171 | 22 |
| Ethiopia | 97 366 774 | 2.6 | 64 | 7 | 55 612 228.2 | 571.2 | 4.9 | 27 | 174 | 23 |
| Mali | 16 962 846 | 2.9 | 58 | 10 | 14 004 067.5 | 825.6 | 6.9 | 42 | 175 | 24 |
| Guinea Conakry | 11 805 509 | 2.3 | 59 | 10 | 6 624 068.0 | 561.1 | 5.6 | 30 | 183 | 25 |
| Burkina Faso | 17 585 977 | 3 | 59 | 10 | 12 400 688.6 | 705.1 | 5 | 35 | 185 | 26 |
| Chad | 13 569 438 | 3.3 | 52 | 14 | 13 922 223.2 | 1026 | 3.6 | 37 | 186 | 27 |
| Niger | 19 148 219 | 3.8 | 61 | 9 | 8 245 312.1 | 430.6 | 5.8 | 24 | 187 | 28 |
| Central African Republic | 4 515 392 | 0.3 | 51 | 15 | 1 702 898.9 | 377.1 | 4.2 | 16 | 188 | 31 |
GDP, gross domestic product; USD, United States dollar.
Green color indicates countries belonging to high-human development index category, yellow color indicates countries belonging to medium-human development index, and red color indicated countries from low-human development index.
Source: World bank data 2014.
Regarding the financial profile of the different African countries, it is worth stressing that in 2014, GDP ranged between $0.3 billion in Sao Tome and Principe to $568.5 billion in Nigeria, while GDP per capita ranged between $377.1 in Central African Republic to $19 002.6 in Equatorial Guinea (Table 1). This clearly demonstrates the marked heterogeneity in the financial profiles of the countries.
Health care systems and expenditures
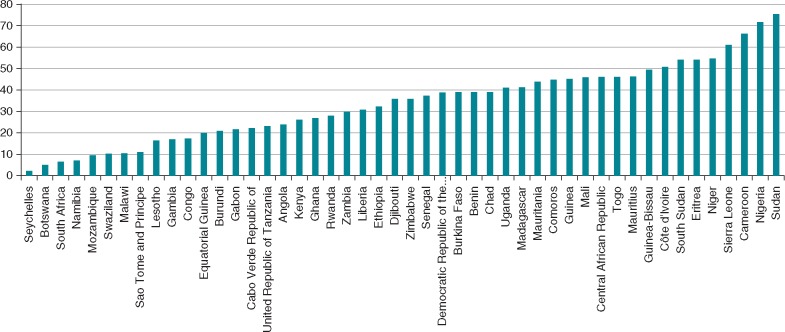
Many countries face large, unmet health needs, and pressures on health systems are expected to increase. Making further progress towards universal health coverage (UHC) is critical to promote equity, human rights, and patient safety in health care and subsequently improve the human development index that is critical for almost all African countries (Table 1). The organization of health care across the PASCAR countries is heterogeneous with few providing universal health care services to the entire population. In most countries, health care services are primarily supported by household incomes (out-of-pocket payment expenditures) rather than by public or commercial health insurance companies.13 In 2014, between 40% and 60% of total health expenditures (THE) were funded by households in half of SSA countries13 (Figure 1).
Figure 1.
Percentage of THE funded by households. In more than half of African countries, households funded overwhelming health care expenditures. THE, total health expenditures. Source: WHO database 2014.
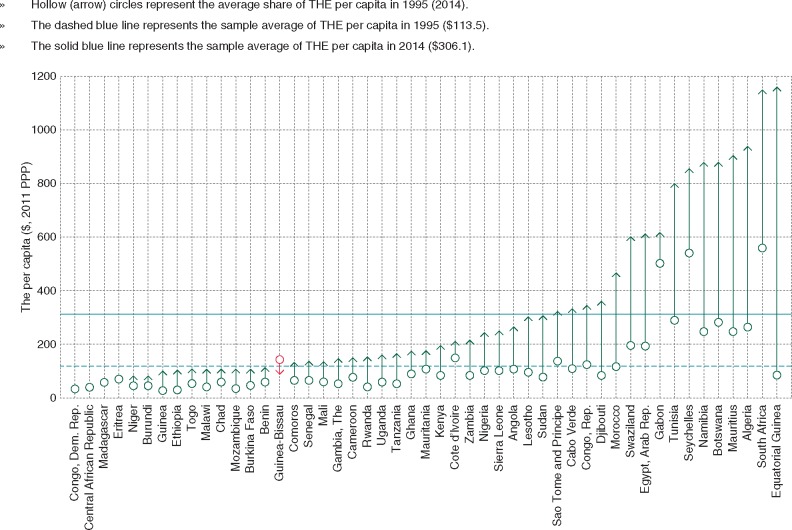
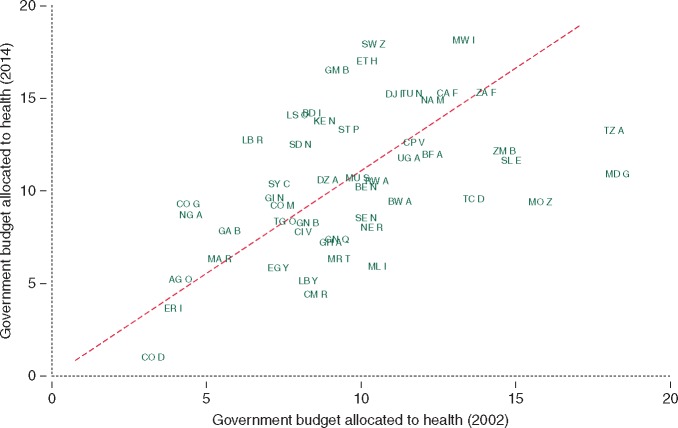
Health care expenditure has been escalating rapidly in some countries such as Algeria, Botswana, Egypt, Equatorial Guinea, Mauritius, Morocco, Namibia, South Africa, Swaziland, and Tunisia (Figure 2). In contrast, for the same period from 1995 to 2014, this progression was slow in many other countries of SSA (Figure 2). Most countries committed to increase public health spending to at least 15% of the government’s budget in line with the 2001 Abuja Declaration.13 However, between 2002 and 2014, government health expenditures diminished in 50% of African countries (Figure 3). As shown in Table 1, the mean health expenditure in the countries surveyed as percentage of the GDP was 5.5%. It was lowest in Gabon (3.4%) and highest in South Africa (8.8%). The health expenditure per capita was lowest in Central African Republic (16 USD) and Niger (24 USD), and highest in South Africa (570 USD) and Equatorial Guinea (663 USD). Hence, there was more than 40-fold difference between the lowest and highest health care expenditures per capita in the survey.
Figure 2.
Evolution of the THE per capita from 1995 to 2014 among African countries. Except Guinea Bissau and countries with high political instability such as Central African Republic and Republic Democratic of Congo, countries have increase their THE per capita between 1995 and 2014. Source: World Bank Group 2014.
Figure 3.
Government budget allocated to health between 2002 and 2014. There is a high disparity among countries regarding the budget allocated to health. Source: World Bank Group 2014.
Pacemakers
General information
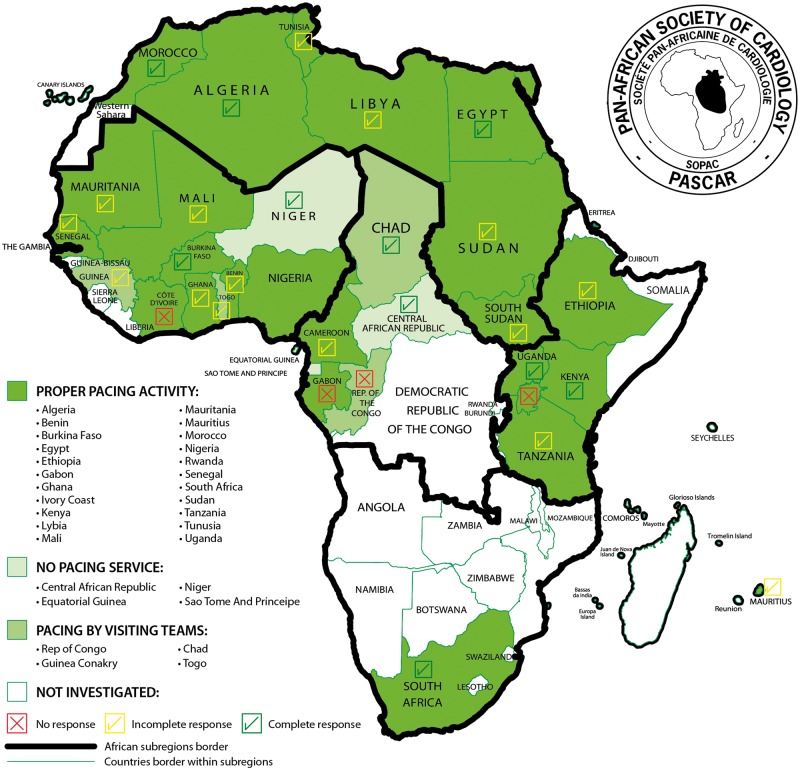
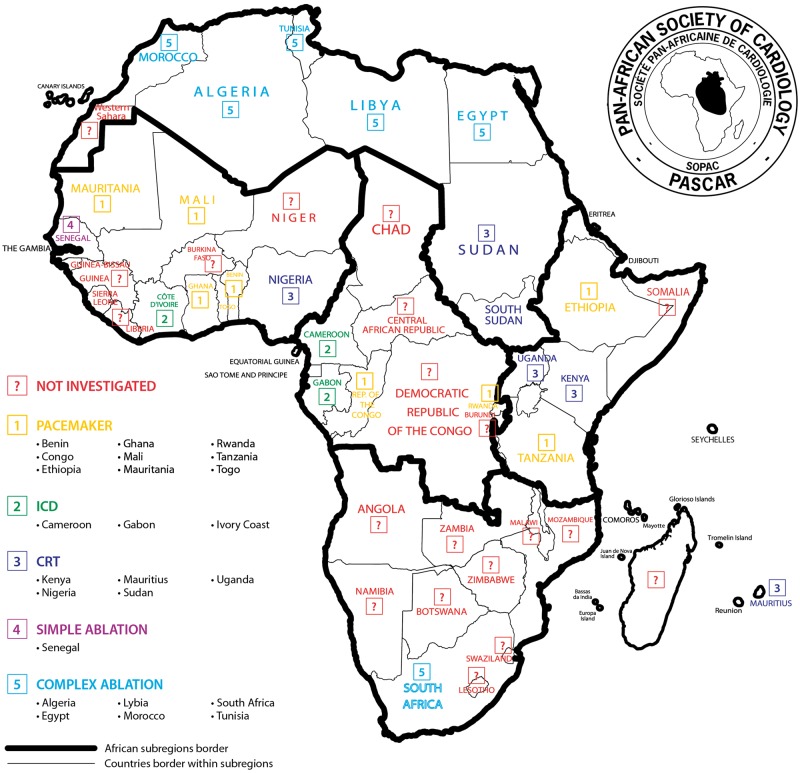
We collected data from 31 PASCAR countries (Figure 4). The information on affiliation of EP physicians (teaching or non-teaching hospitals and private clinics), the availability of isoprenaline, the use of temporary pacing as the bridge to permanent pacing, and EP studies are reported in Table 2. Table 3 lists the number of pacing centres and implanting physicians of 23 countries with consistent pacemaker activity. Central African Republic, Equatorial Guinea, Niger, and Saô Tomé and Principe did not have local expertise (13%), whereas countries like Chad, Congo Republic, Guinea Conakry, and Togo were dependent on visiting missions to implant pacemakers (Figure 4). A national registry was not available in any country. Population data (World Bank; 2014 database) estimate a total of 835 058 745 people living in the 23 countries where pacemakers were implanted and 62 459 264 people in the 8 countries without any pacemaker service.
Figure 4.
Pacemaker activity per country.
Table 2.
General characteristics of pacing activities among 15 countries
| Characteristics | n = 15 (%) | |
|---|---|---|
| Title of local investigator | Doctor | 13 (87%) |
| Professor | 2 (13%) | |
| Type hospital | Teaching hospital | 9 (64%) |
| Non-teaching hospital | 3 (22%) | |
| Private hospital/clinic | 2 (14%) | |
| Isoprenaline availability | Yes | 8 (57%) |
| No | 6 (43%) | |
| Temporary stimulation when indicated | Yes | 9 (60%) |
| No | 6 (40%) | |
| Electrophysiological study performed | Yes | 1 (7%) |
| No | 14 (93%) |
Table 3.
Number of centres, operators, and cost of procedures in every countries
| Centres (n) | Operators (n) | Cost of procedure (USD) |
||
|---|---|---|---|---|
| Countries | Single- chamber | Dual- chamber | ||
| Algeriaa | 19 | n/a | Free | Free |
| Benin | 2 | n/a | 1374 | 2290 |
| Burkina Faso | 3 | 3 | 1448 | 1982 |
| Cameroon | 3 | 4 | 2000 | 2500 |
| Chadb | 1 | 0 | n/a | n/a |
| Congo Republicb | 1 | 0 | n/a | n/a |
| Gabon | 1 | n/a | n/a | n/a |
| Egypt | 33 | n/a | n/a | n/a |
| Ethiopia | 3 | 3 | n/a | n/a |
| Ghana | 2 | 2 | n/a | n/a |
| Guinea Conakryb | 1 | 0 | n/a | n/a |
| IvoryCoast | n/a | n/a | 2825 | 3282 |
| Kenya | 7 | n/a | 2820 | 4230 |
| Lybia | 2 | 4 | n/a | n/a |
| Mali | 1 | 2 | n/a | n/a |
| Mauritania | 1 | n/a | 1832 | 2137 |
| Morocco | 13 | 112 | n/a | n/a |
| Nigeria | 12 | 15 | n/a | n/a |
| Mauritiusa | 8 | 50 | free | free |
| Rwanda | 2 | n/a | n/a | n/a |
| Senegal | 4 | 11 | 1984 | 2290 |
| South Africa | 54 | 173 | 1030 | 1380 |
| Sudan | 8 | 14 | 1000 | 1480 |
| Tanzania | 2 | 7 | free | free |
| Togo | 1 | 1 | 2290 | 3053 |
| Tunisia | 60 | 130 | 860 | 1300 |
| Uganda | 1 | 3 | 1880 | 2632 |
USD, United States dollar.
Full coverage in public hospitals.
The pacemaker generator was free based on humanitarian donation, free referred to a national insurance system covering the implantation cost.
Pacemaker facilities and implantation rate
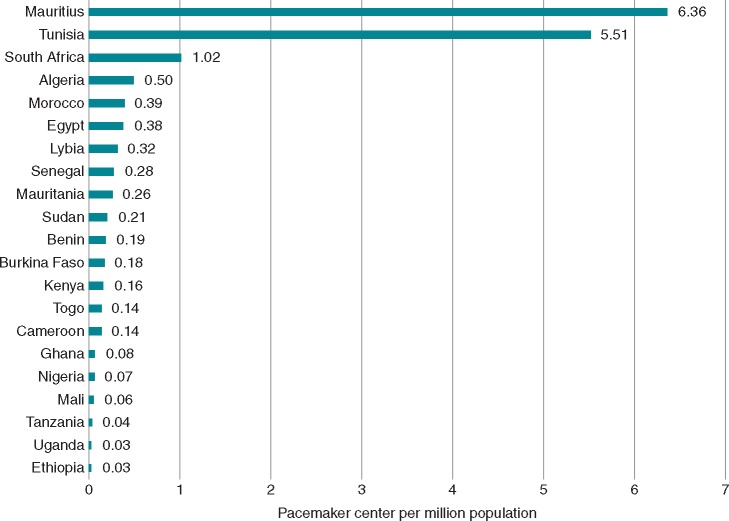
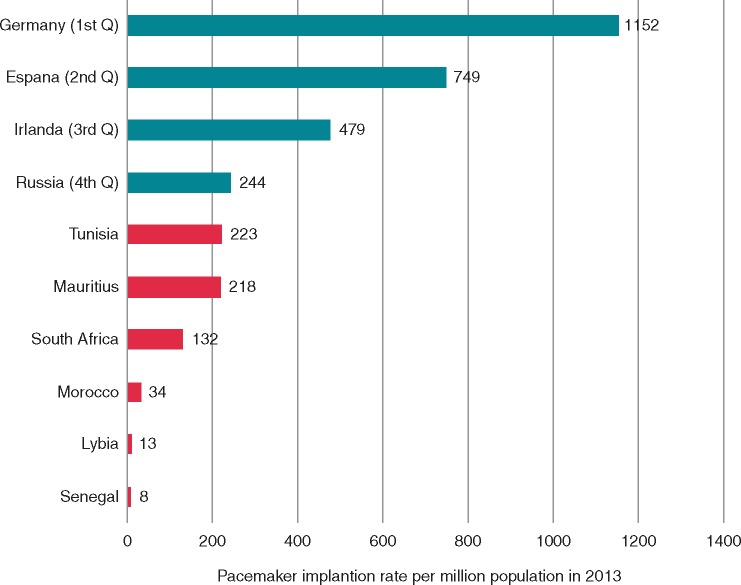
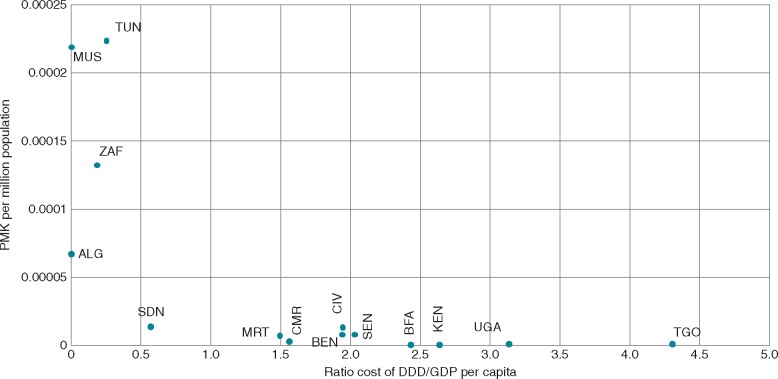
Our survey demonstrates that in 2013, a total number of 16 271 devices were implanted in 21 countries, representing an implantation rate of 18 devices per million population; whereas in 2014, a total number of 11 600 devices were implanted in 17 countries, representing an implantation rate of 19 devices per million population. The number of pacing centres per million population was <1.0 in 2013 and remained unchanged in 2014. Mauritius had the highest density of facilities (6.3 centres per million population) in contrast to Uganda and Ethiopia (0.03 per million population, Figure 5). Overall, countries from North Africa had a higher pacemaker implantation rate compared with SSA countries (Table 4). In 2013, the median implantation rate in Africa was 2.66 per million population which was 200-fold lower compared with Europe with 552 per million population (Figure6). In 2014 the lowest implantation rate was in Nigeria with 0.14 implants per million population. Longer term data spanning a minimum of 3 years are available from 11 countries (Figure 7), and the overall trends were in favour of an increase in the number of pacemakers implanted (Figure 7). Between 2012 and 2013, the number of pacemaker implantations per million population did not change significantly in Tunisia, Egypt, and Senegal, whereas Cameroon, Uganda, and Togo had a 20%, 46%, and 500% increase in the number of pulse generator implantations, respectively (Table 4). Between 2013 and 2014, however, SSA countries displayed significant fluctuation and variation in the implantation rates: Benin (+88%), Burkina Faso (+88%), Senegal (+41%), Cameroon (−42%), Nigeria (−50%), and Togo (−83%). Algeria (0%) and Tunisia (−10%) were stable or marginally changed. The exceptions came from Morocco with significant changes (+29%) and Mauritius (+9%). The sawtooth trend seen in Togo (Table 4) depicts the dependence of pacing service of this country and others on visiting specialists. Unfortunately, this scenario is common in some SSA countries such as Guinea Conakry, where a French humanitarian mission implanted the first seven recycled pacemakers of the country in 20148 without further actions afterward, as well as in other African countries.4,9Figure 8 shows the correlation between the cost of procedure, the GDP per capita, and the implantation density per country. It is clearly demonstrated that low income dramatically limits access to such expensive treatment modality, especially in the setting of pay-out-of-pocket health care access. To improve access to CIED, government should provide adequate implantation facilities, adequately trained personnel, and complete reimbursement. These characterizes the health care insurance policy of Mauritius and explains why this small country takes the lead on CIED implantation services in Africa (Figure 5, Table 4). Moreover, health expenditures per capita increased rapidly in those countries where the CIED implanting rate was higher (Figure 3); reinforcing the evidence of impact of public health policies in population health coverage. Tunisia, Mauritius, South Africa, and Algeria had the best health expenditures per capita progression (Figure 3) and pacing service (Table 4, Figures 5, 7, 11, and 12).
Figure 5.
Pacemaker implantation centre per million population in 2013.
Table 4.
Pacemaker implantation rates per million population from 2011 to 2016
| Pacemaker implanting rate per million population |
||||||
|---|---|---|---|---|---|---|
| Countries | 2011 | 2012 | 2013 | 2014 | 2015 | 2016 |
| Nigeria | n/a | n/a | 0.23 | 0.12 | n/a | n/a |
| Burkina Faso | 0.59 | 0.53 | 0.47 | 0.88 | n/a | n/a |
| Guinea Conakry | n/a | n/a | 0.59 | n/a | n/a | |
| Ghana | n/a | n/a | 0.61 | n/a | n/a | n/a |
| Benin | 1.45 | 1.55 | 0.78 | 1.45 | n/a | n/a |
| Togo | 0.14 | 0.14 | 0.85 | 0.14 | n/a | n/a |
| Mali | n/a | n/a | 0.96 | n/a | n/a | n/a |
| Uganda | 0.46 | 0.69 | 1.05 | n/a | 0.66 | n/a |
| Ivoary Coast | 1.48 | 1.53 | 1.29 | 1.66 | n/a | n/a |
| Kenya | n/a | 1.42 | 1.72 | 2.84 | 5.06 | 7.42 |
| Cameroon | 1.62 | 2.21 | 2.66 | 1.53 | 1.89 | 1.67 |
| Mauritania | n/a | n/a | n/a | 6.97 | n/a | n/a |
| Senegal | 5.91 | 8.30 | 7.81 | 10.97 | n/a | n/a |
| Lybia | n/a | n/a | 7.98 | n/a | n/a | n/a |
| Sudan | n/a | n/a | 13.42 | n/a | n/a | 13.35 |
| Egypt | n/a | 30.00 | 33.00 | 38.00 | 40.54 | n/a |
| Morocco | 39.00 | 38.00 | 34.00 | 44.00 | 54.00 | n/a |
| Algeria | n/a | n/a | 65.00 | 65.00 | 76.00 | n/a |
| South Africa | n/a | 88.30 | 132.00 | 114.00 | n/a | 138.25 |
| Tunisia | 155.00 | 233.00 | 223.21 | 201.00 | n/a | n/a |
| Mauritius | n/a | n/a | 218.49 | 238.4 | n/a | n/a |
Figure 6.
Pacemaker implantation rate of countries in Africa compared with Europe. 1st Q, 2nd Q, 3rd Q, and 4th Q are based on the Raatikainen et al.15 classification. Source: ESC/EHRA White book 2014.
Figure 7.
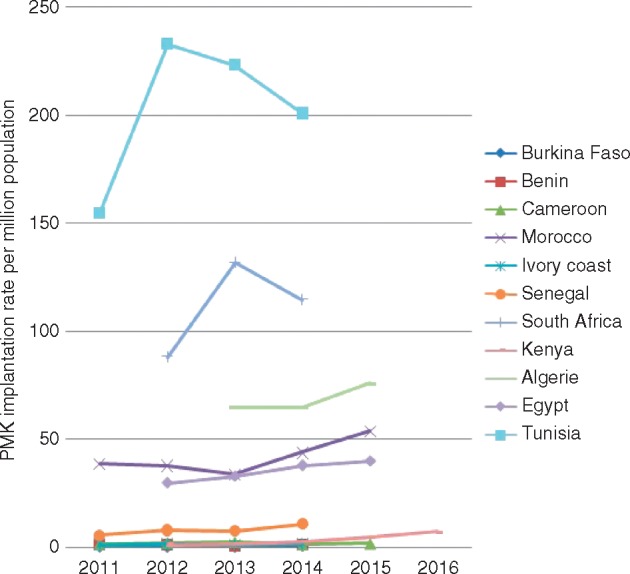
Pacemaker implantation trends among countries with at least three consecutive years of available data. Majority of the countries show positive trend. Five countries have pacemakers’ implantation rate per million population <7 devices per million of population.
Figure 8.
Pacemaker implantation rate per ratio of implantation cost on GDP per capita. Pacemaker implantation cost rated by GDP per capita informed about the expense carried by such procedure regarding the population average wealth. The figure shows that countries with low ratio (mainly because of the existence of public health care insurance) tend to have higher pacemaker rate. ALG, Algeria; BEN, Benin; BFA, Burkina Faso; CMR, Cameroon; CIV, Ivory Coast; EGY, Egypt; KEN, Kenya; MAR, Morocco; MUS, Mauritius; NGA, Nigeria; SDN, Sudan; SEN, Senegal; TGO, Togo; TUN, Tunisia; ZAF, South Africa Republic.
Figure 11.
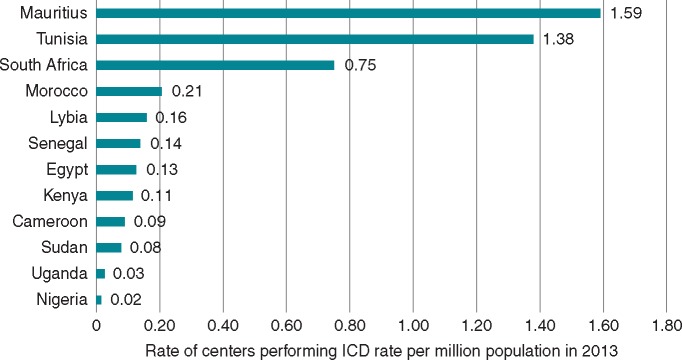
Density rate of ICD implanting centres in 2013.
Figure 12.
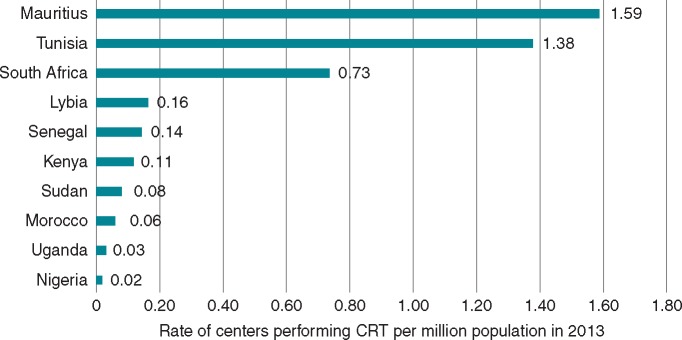
Density rate of CRT implanting centres in 2013. Mauritius had the highest density of centres, followed by Tunisia and South Africa. Nigeria displayed the latest volume.
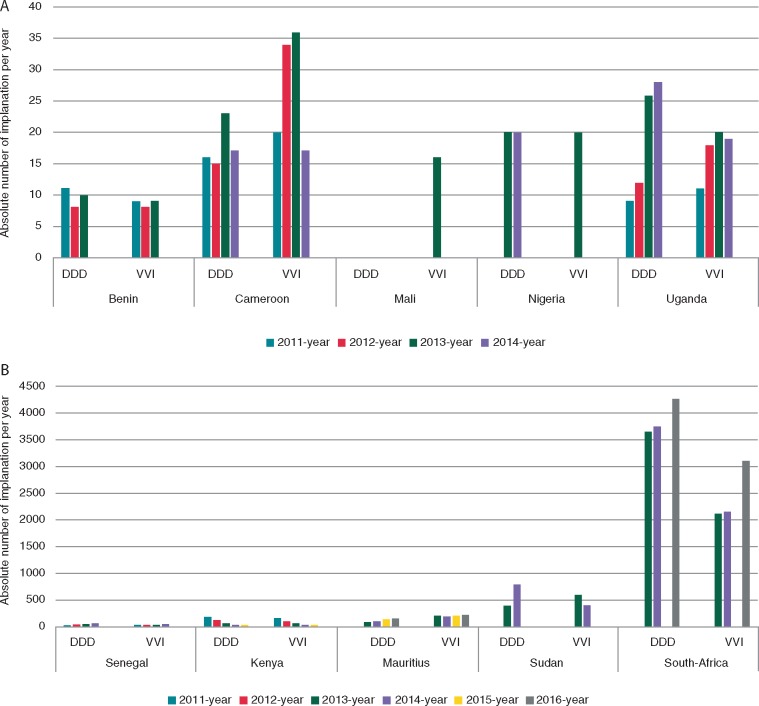
Compared to statistics in western countries where single-chamber devices are implanted in the minority of cases,14–17 in Africa the trends shows almost equal implantation rates in many countries (Figure 9A and B). In Mali, single-chamber pacing is the solely available procedure (Figure 9A), and in Cameroon and Mauritius dual-chamber pacing is less performed (Figure 9A and B). South Africa and Ghana are the sole countries where dual-chamber outweighed single-chamber pacing (Figure 9A). The main reason for this trend towards higher single-chamber pacing is the low cost of single chamber pacing and in conjunction with the lack of expertise required for dual-chamber pacing. All the five main brands of pacemakers are present in the countries investigated (Figure 10), with only few centres implanting all brands. Apart from South Africa, SSA lacks the presence of manufacturers, and local distributors are few. Therefore, EP physicians tend to establish contact with a brand that guarantees low device prices. This has the potential disadvantage of narrowing the choice and use of CIEDs.
Figure 9.
(A) Trend in the number of single- and dual-chamber pacemakers implantation in five countries with lowest activity between 2011 and 2016. (B) Trend in the number of single- and dual-chamber pacemakers implantation in five countries with highest activity between 2011 and 2016.
Figure 10.
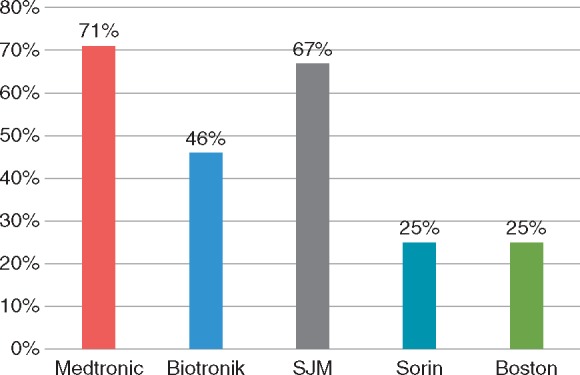
Distribution of pacemaker brands in the African market. SJM, Saint Jude Medical/Abott; Sorin, Liva Nova.
Implantable cardioverter-defibrillators
General information
Figure 11 indicates the density of centres which offered ICD implantations. Implantations were done mostly in public hospitals (Table 2). Given the low implant rates of pacemakers in SSA, we assumed that ICD which is a quite expensive device was less implanted and their implant rates did not add new information. On the other hand, countries from North Africa and South Africa were compared to the European countries having comparable GDP per capita. The European countries had higher implantation rates (Table 4).
Implantable cardioverter-defibrillator facilities and implantation rate
As shown in Figure 11, the rate of ICD implantation was significantly low. Mauritius had the highest density of centres, followed by Tunisia and South Africa. Tunisia had the highest ICD implantation rate with 12.8 ICD implants per million population, whereas Germany claimed 295 per million population, representing a 23-fold difference.17 In fact, South Africa which had the highest GDP per capita on the continent had only 11.71 ICD implants per million population, whereas Serbia with a lower GDP per capita implanted almost six-fold more ICD in 2014 (Table 5).
Table 5.
Comparison between eastern European countries and African countries
| GDP per capita (USD) | Number of ICD implants |
Number of CRT (CRT-P+ CRT-D) implants |
|||
|---|---|---|---|---|---|
| Country | Absolute number | Per million population | Absolute number | Per million population | |
| Ukraine | 3104 | 57 | 1.29 | 85 | 2 |
| Morroco | 3154 | 27 | 0.81 | 62 | 2 |
| Egypt | 3328 | 236 | 2.72 | 530 | 6 |
| Tunisia | 4272 | 140 | 12.8 | 180 | 16 |
| Georgia | 4429 | 104 | 21.07 | 55 | 11 |
| Bosnia-Herzegovia | 5194 | 55 | 14.21 | 23 | 6 |
| Algeria | 5470 | 60 | 1.55 | 56 | 1 |
| Serbia | 6200 | 457 | 63.39 | 321 | 45 |
| South Africa | 6479 | 634 | 11.71 | 790 | 14.59 |
GDP, growth demographic product.
Italicized emphasis indicates African countries and unitalicized emphasis indicates Eastern European countries.
Source: ESC/EHRA White book.
Cardiac resynchronization therapy
General information
Figure 12 indicates the density of centres where CRT device implantations were performed. Most procedures were performed in public hospitals. Apart from South Africa and Kenya (from 2012), all SSA countries where CRT has been implanted were performed by visiting specialists. We believe that the low implant rates of CIED in SSA reflect a dearth of specialists in the technique and that the training requirements have been less available. On the other hand, countries from Maghreb and South Africa were comparable to the European countries with similar GDP per capita (Table 5).
Cardiac resynchronization therapy facilities and implantation rate
Most countries where ICD implantation was available also offered CRT therapy (Figure 12) although CRTs were mostly performed by visiting specialists. The rate of CRT implantation was very low throughout the continent. Indeed, South Africa implanted only 14.59 CRT per million population, whereas Serbia with almost a similar GDP per capita implanted 45 devices per million population in 2014 (Table 5). Tunisia was the first African country with 16 CRT per million population when Germany implanted 128 devices per million population, representing an eight-fold difference.17
Catheter ablation
General information
Eight countries submitted data on EP studies and catheter ablations (Figure 14). Algeria, Egypt, Kenya, Libya, Morocco, Senegal, South Africa, and Tunisia reported somewhat consistent ablation procedures. No country keeps a national registry of catheter ablation, and the data were estimated by the centres where the procedures are performed. Only a few sub-Saharan countries have started EP procedures, mainly under the supervision of visiting specialists. South Africa is the only SSA country independently providing simple and complex ablation procedures.
Figure 14.
Type of procedure existing in countries. Simple ablation includes radiofrequency ablation of flutter and junctional tachycardias, complex ablation refers to simple ablation and atrial fibrillation catheter ablation.
Figure 13.
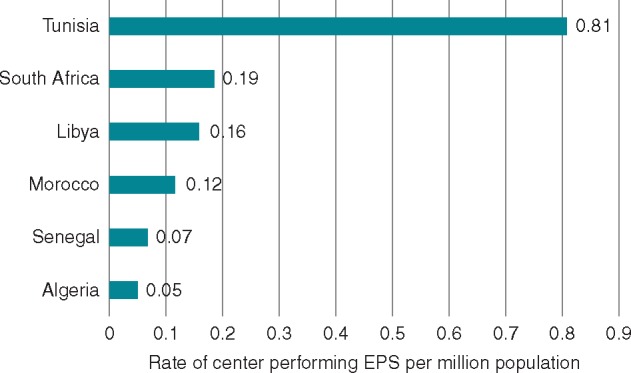
Number of centres per million population performing ablation procedures.
Ablation facilities and procedure rates
Figure 14 shows that Senegal and South Africa are the only countries in SSA with EP service, although Senegal performed exclusively cavo-tricuspid isthmus for atrial flutter. North-Africa provided more access to interventional cardiac arrhythmias therapies. In Algeria, the number of ablations rose from 6 per million population in 2013 to 8 million per population in 2015. In Egypt, 11 procedures per million population were performed in 2012 and 16 per million in 2015. The trend was more sustainable in Tunisia with 56 per million population in 2011 and 78 ablations per million population in 2014.
Discussion
Current analysis shows that there are considerable variations in the availability of medical expertise, centres, and procedure rates among African countries.
The mean CIED implantation rates were markedly lower in the Western and Central African countries. Despite some progress over the last 6 years, there is still a clear unmet demand. Although the African population is younger than the European, and therefore less likely to need CIED therapy, the difference of more than 200-fold in the implantation rates is not fully explained by this alone.
The survey highlights several weaknesses in the management of arrhythmias in Africa: (i) the virtual absence of pacemaker implantation facilities in many countries, (ii) the very low CIED implant rates, (iii) the very low number of implanting centres, (iv) the low number of trained operators per million population, (v) the non-existence of EP studies and ablation techniques in SSA countries aside from Senegal where simple ablations (mainly atrial flutter) were started in 2014, and South Africa where CIED implantations and EP procedures have been practised for decades, and (vi) high cost of the CIEDs and the implantation procedure.In this survey, only Mauritius and Algeria offered free health care for CIED in the public sector. The mean cost of the procedure was USD 1778 and 2379 for single- and dual-chamber pacemaker implantation respectively, which exceed the yearly earnings of the average citizen in most lower-income and middle-income countries.
Although recycled CIED have been shown to be a safe and efficient therapy and a viable alternative for low-incomes settings,10,11 many centres in Africa have not yet adopted this practice. This may reflect concerns over the long-term safety of this practice, access to recycled devices or due to the fact that this cost-saving solution deprives operators and distributors of income in the setting of generalized pauperization of medical profession.
Three brands dominate the African market, serving more than 70% of SSA. However, few of them have a local official distributor in many countries. This may partly be because the African CIED market is too small to attract manufacturers’ interest. The prevailing low implantation rates deprive EP physicians of a market-basis for training opportunities sponsored by manufacturers and may contribute to a vicious cycle. Because international-standard fellowship programs are not provided, young physicians have limited access to training opportunities abroad.
The survey also demonstrates that the lack of reimbursement systems which is the commonest scenario in developing countries, in conjunction with a high cost of procedures in the setting of pay-out-of-pocket health care policies, may affect early detection and patient follow-up.4,5
The indicators of good governance assessed (summarized in the Table 1), indicate that countries which aggregated high GDP per capita, life expectancy at birth, health expenditure as percentage of GDP or per capita, and human development index were those with the better cardiac arrhythmia services (Figures 5, 7, 9A and B, 11, 12, 13, and 14).
Strengths and limitations
This multi-source approach to data collection allowed estimate of use of CIED in many African countries where national registries are not available. For the reliability of our statistics, we compared our information from Maghreb with the data published in EHRA white books (18), given that Algeria, Egypt, Lybia, Morocco, and Tunisia have annual report of their activities in this European database.
Although this report is the first attempt to provide complete data on CIED for the African continent, we acknowledge some limitations. Data collection was exclusively voluntary by physicians affiliated with the PASCAR working group on pacing and EP. Of the 31 countries where we knew EP physicians or had useful contact to share national statistics, 40% of countries did not respond necessitating the use of alternative methods of obtaining data. Obviously, data such as the rates of recycled pacemakers, the proportion of implantations by visiting specialists, and others are challenging to collect in this setting.
Perspectives
The ultimate short-term objective of the PASCAR is to provide ubiquitous access to therapy for cardiac arrhythmia, especially potentially life-saving treatment such as pacemaker implantation for complete heart block. The results of this study should serve as the PASCAR roadmap for convincing governments, manufacturers, and other stakeholders to invest in implantation facilities, minimize implantation cost, and increase local expertise by establishing fellowship programs through South–South and South–North partnership. The difficulties highlighted regarding management of arrhythmias is a reflection of the poor state of health care in SSA, a state which requires a comprehensive and concerted effort by government to improve access through the provision of adequate funding for infrastructure, training, and health care insurance.
Conclusion
Although in rise in most countries, pacemaker implantations remain suboptimal in sub-Saharan Africa, and more advanced techniques such as ICD, CRT, and ablation procedures are largely unavailable. High cost of procedures in the setting of pay-out-of-pocket policies, underuse of recycled devices, lack of national registries, and the deficit of trained specialists are major impediments to the management of cardiac arrhythmias in Africa.
Acknowledgements
The database of this survey was obtained through the collective efforts of several medical doctors and local distributors, to whom we are immensely grateful. We express our gratitude to Wendy Watton (Medtronic South Africa) and Gary A. Hardy (Amayeza Abantu Pvt. Ltd, for Abott/St Jude Medical) for linking us with EP physicians in countries where we did not have contacts, as well as sharing their transversal statistics, Annarie Peterson (PATZWI design house) for the design of figures. The following doctors participated in the study by collecting relevant data from their countries: Adama Kane (Senegal), Hamadou Diakité (Mali), Martin Houenassi (Benin), Kemi Tibarzawa (Tanzania), Benedict Anisuiba (Nigeria), Cabral Tantchou (Cameroon), Sonia Marrakchi (Tunisia), Mérimée Ouankou (Cameroon), and A. Gehani (Lybia). Finally, we thank the European Heart Rhythm Association (EHRA) for their White Book on the statistics of CIED and EP procedures which guided this work.
Conflict of interest: none declared.
References
- 1. Bestawros M. Electrophysiology in the developing world: challenges and opportunities. Cardiol Clin 2017;35:49–58. [DOI] [PubMed] [Google Scholar]
- 2. Mayosi BM, Scott Millar R.. The 1995 survey of cardiac pacing in South Africa. S Afr Med J 1988;88(Suppl 4):C207–11. [Google Scholar]
- 3. Mayosi BM, Scott Millar RN.. Permanent cardiac pacing in Africa. East Afr Med J 2000;77:339.. [PubMed] [Google Scholar]
- 4. Yayehd K, Ganou K, Tchamdja T, Tété Y, N’Cho Mottoh MP, Pessinaba S. et al. Management of high-grade atrioventricular block in Lomé, Togo. Med Trop Rev Corps Sante Colon 2011;71:637–8. [PubMed] [Google Scholar]
- 5. Tantchou Tchoumi JC, Foresti S, Lupo P, Cappato R, Butera G.. Follow up in a developing country of patients with complete atrio-ventricular block. Cardiovasc J Afr 2012;23:538–40. [DOI] [PMC free article] [PubMed] [Google Scholar]
- 6. Millar RNS, Mayosi BM.. Utilization of implantable defibrillators in Africa. Card Electrophysiol Rev 2003;7:14–6. [DOI] [PubMed] [Google Scholar]
- 7. Jouven X. Cardiac pacing in western Africa. Ann Cardiol Angeiol (Paris) 2003;52:204. [DOI] [PubMed] [Google Scholar]
- 8. Balde EY, Barry IS, Balde MD, Beavogui M, Diop IB, Jouven X. et al. Permanent cardiac pacing: first experience in Guinea. Trop Cardiol 2014;140. [Google Scholar]
- 9. Ikama SM, Makani J, Jouven X, Kimbally-Kaky G.. Permanent cardiac pacing: first Congolese experiment. Pan Afr Med J 2015;20:381. [DOI] [PMC free article] [PubMed] [Google Scholar]
- 10. Jama ZV, Chin A, Badri M, Mayosi BM.. Performance of re-used pacemakers and implantable cardioverter defibrillators compared with new devices at Groote Schuur Hospital in Cape Town, South Africa. Cardiovasc J Afr 2015;26:181–7. [DOI] [PMC free article] [PubMed] [Google Scholar]
- 11. Sani MU, Mayosi BM.. The Pacemaker and ICD Reuse Programme of the Pan-African Society of Cardiology 10.1136/heartjnl-2017-311462 (31 May 2017, date last accessed). [DOI] [PubMed]
- 12. World Health Organization. Improving Mortality Statistics as part of Strengthening Civil Registration and Vital Statistics Systems Geneva, Switzerland: Chateau de Penthes, 2014. http://www.who.int/healthinfo/civil_registration/CRVS_MortalityStats_Guidance_Nov2014.pdf (18 Septemper 2017, date last accessed).
- 13. Bank TW. Universal Health Coverage (UHC) in Africa : A Framework for Action : Main Report (English) The World Bank; 2016 Jan. p1–60. Report No.: 108008. http://documents.worldbank.org/curated/en/735071472096342073/Main-report (18 Septemper 2017, date last accessed).
- 14. Dretzke J, Toff WD, Lip GYH, Raftery J, Fry-Smith A, Taylor R.. Dual chamber versus single chamber ventricular pacemakers for sick sinus syndrome and atrioventricular block. Cochrane Database Syst Rev 2004;CD003710. [DOI] [PMC free article] [PubMed] [Google Scholar]
- 15. Raatikainen MJP, Arnar DO, Zeppenfeld K, Merino JL, Kuck K-H, Hindricks G.. Current trends in the use of cardiac implantable electronic devices and interventional electrophysiological procedures in the European Society of Cardiology member countries: 2015 report from the European Heart Rhythm Association. Europace 2015;17:iv1–72. [DOI] [PubMed] [Google Scholar]
- 16. Raatikainen MJP, Arnar DO, Merkely B, Camm AJ, Hindricks G.. Access to and clinical use of cardiac implantable electronic devices and interventional electrophysiological procedures in the European Society of Cardiology Countries: 2016 Report from the European Heart Rhythm Association. Europace 2016;18:iii1–79. [DOI] [PubMed] [Google Scholar]
- 17. Raatikainen MJP, Arnar DO, Merkely B, Nielsen JC, Hindricks G, Heidbuchel H. et al. A decade of information on the use of cardiac implantable electronic devices and interventional electrophysiological procedures in the European Society of Cardiology countries: 2017 report from the European Heart Rhythm Association. Europace 2017;19:ii1–ii90. [DOI] [PubMed] [Google Scholar]


