Abstract
A mathematical model of oxygen (O2) transport within a capillary utilizes axisymmetric red blood cell (RBC) shapes that were predicted theoretically by Zarda et al. in 1977. Chemical kinetics and both free and facilitated diffusion of O2 are accounted for in this time-dependent model. The finite-element method is used to solve the governing partial differential equations. It is found that the shape of RBCs, characterized by the shape parameter θ adapted from Zarda et al., affects such important O2 transport characteristics as capillary wall O2 flux and hemoglobin (Hb) saturation. At an RBC residence time (time for an RBC to travel from the capillary inlet to a given point) of 0.22 s, a change in the shape parameter θ from 0 (undeformed cell) to 26 (parachute-shaped cell) decreases the spatially averaged O2 flux by 26%. The dependence of O2 flux on RBC shape diminishes as the RBC residence time increases. The difference in Hb saturation at the RBC residence time of 0.22 s can be as large as 10% for different values of θ. The mass transfer Nusselt number, which is inversely proportional to transport resistance, decreases with increases in θ. The fractional transport resistance in the plasma region accounts for approximately 65–80% of the total intracapillary resistance. Calculations show that local chemical equilibrium in the O2–Hb chemical reaction is attained everywhere except within a thin boundary layer adjacent to the erythrocyte membrane, where significant deviation from chemical equilibrium occurs.
INTRODUCTION
Recent studies of the effects of the particulate nature of blood flow [2, 4, 5, 12, 13] and of oxygen–hemoglobin kinetics [2, 3, 17] on oxygen release in capillaries provide new insights into the questions: (1) Does intracapillary [including red blood cell (RBC) and plasma] resistance account for a significant fraction of the total oxygen transport resistance in the diffusion pathway from RBC to tissue mitochondria? (2) Is there a true chemical equilibrium between oxygen and hemoglobin in RBCs?
Hellums [12] modeled the capillary as a circular tube and the erythrocytes as cylindrical slugs that fill the lumen of the capillary in single-file fashion, separated by gaps of plasma, which he assumed were not functional for oxygen exchange. Because only half of the capillary surface area is available for exchange at a hematocrit of 50%, he predicted that intracapillary resistance accounts for a significant frac-tion of the total transport resistance to tissue. Aroesty and Gross [1], Homer et al. [13], and Federspiel and Sarelius [4] considered the diffusion of oxygen in the gaps of plasma between the cylindrical slugs representing RBCs and determined the oxygen tension () distribution within the gaps. Oxygen transport inside the cells was not considered; instead, at the cell surface was specified. They found that the diffusion limitation of O2 transport in the gap resulted in a decrease in when a constant O2 flux was imposed at the boundary and a decrease in O2 flux when a constant boundary was imposed. Thus, it was concluded that the plasma gaps are part of the pathway for oxygen transfer to tissue, but these gaps have limited carrying capacity.
Federspiel and Popel [5] further extended the theory by considering spherical RBCs in a cylindrical capillary and investigated the dependence of transport characteristics on RBC clearance (gap width between cell and capillary wall) and cell spacing. Oxygen–hemoglobin kinetics and free and facilitated diffusion of oxygen inside the cells were taken into account. They concluded that the capillary resistance could account for 30–70% of total resistance to transport between RBCs and tissue cells. Groebe and Thews [7, 8] represented RBCs as cylindrical particles and showed that RBC movement not only enhances oxygen release but also renders more uniform the oxygen flux out of the capillary wall. In these investigations, the effect of RBC shape on oxygen transport was not addressed.
Sheth and Hellums [17] and Baxley and Hellums [2] investigated the effects of hemoglobin diffusion and oxygen–hemoglobin kinetics on oxygen transport from RBCs in capillaries and found both effects of significant importance under typical microcirculatory conditions. Clark et al. [3] also took these effects into account and developed a simple asymptotic expression for the rate of oxygen unloading from red blood cells.
In the present study, we investigate the effect of RBC shape on capillary oxygen transport. Since accurate data on the deformed RBC shape are not available from either in vivo or in vitro studies, the choice of specific shapes is not obvious. Gaehtgens et al. [6] observed that RBC shape was sausage-like in very small capillaries (5 μm), whereas a variety of shapes were seen in larger capillaries (12 μm). This finding suggests that a hypothetical RBC shape of cylindrical slugs may be adequate for very small capillaries. For larger capillaries, the deformed shape of an RBC when it traverses a capillary is typically parachute-like, with the leading end bulging out and the trailing end flattened. Because no accurate experimental data on RBC shape are available, the axisymmetric shapes calculated by Zarda et al. [19] for a capillary diameter of 8.2 μm are used in the present work. Hematocrit-dependent transition of blood flow pattern from single-file to multifile, which usually occurs in capillaries of larger diameter, is not considered in this investigation. The model also includes hemoglobin diffusion, hence facilitated oxygen transport, and oxygen—hemoglobin kinetics, which is represented by a variable reaction coefficient model [3, 5].
FORMULATION OF THE PROBLEM
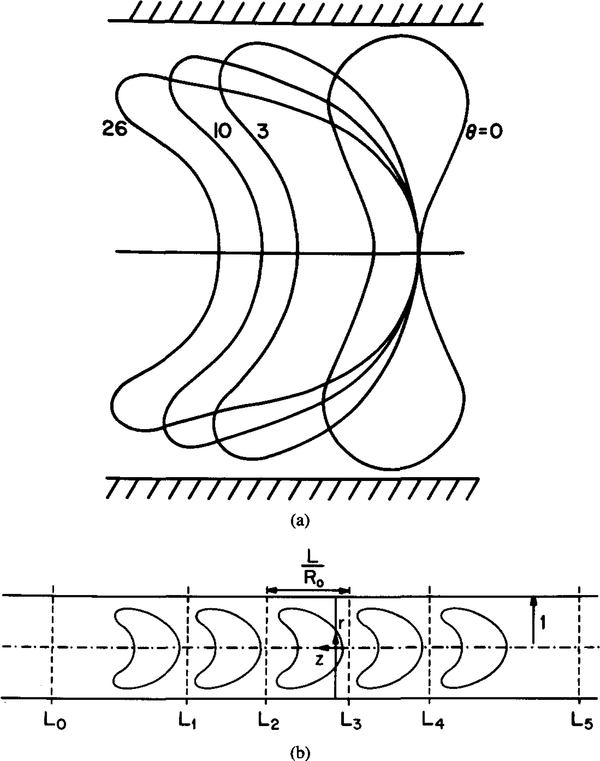
Consider a train of RBCs flowing through a capillary in single file. The shape of the RBC is dependent upon flow rate. The present theoretical study examines the effect of the shape of RBC on the oxygen transport in capillaries. Figure 1 illustrates the geometry and coordinate system used in the model. The coordinate system is moving together with the cells, so in this system the cells are stationary. The shape of each RBC is based on the theoretical study of Zarda et al. [19] and is characterized by a dimensionless pressure drop θ, henceforth referred to as the shape parameter. It is assumed that RBC volume and surface area remain constant for different degrees of deformation. All lengths are normalized by the capillary radius R0.
FIG. 1.
Model geometry in cylindrical coordinates. r = R / R0 is dimensionless radial coordinate; z = Z / R0 is dimensionless axial coordinate. (a) Different RBC shapes correspond to θ ranging from 0 to 26. (Adapted from Zarda et al. [19].) (b) Five-cell model. The unit cell length L is normalized by the capillary radius R0.
TRANSPORT EQUATION
Equations of oxygen transport inside an RBC were derived in [3] and [5]. The equations for free oxygen and oxyhemoglobin are
| (1) |
and
| (2) |
In the plasma region, convective transport of oxygen is neglected [1], and diffusion is described by
| (3) |
Here r = R / R0 is a dimensionless radial coordinate, z = Z / R0 is a dimensionless axial coordinate, is dimensionless time, P is oxygen tension in mm Hg, and S is oxyhe-moglobin saturation (dimensionless). All parameters are defined in Tables 1 and 2.
TABLE 1.
Values of Parameters
| Parameter | Value |
|---|---|
| R0, capillary radius, characteristic length | 4.12 μm |
| L, unit cell length | 6.8 μm |
| VRBC, RBC volume | 94.1 μm3 |
| H, hematocrit | 0.26 |
| D1, diffusivity of oxygen in RBC | 9.5 × 10⁻⁶ cm2 /s |
| D2, diffusivity of oxyhemoglobin in RBC | 1.44 × 10⁻⁷ cm2 /s |
| diffusivity of oxygen in plasma | 2.4 × 10⁻⁵ cm2 /s |
| α, solubility coefficient for oxygen in RBC | 1.56 × 10⁻⁹ mol/(cm3·mm Hg) |
| α(p) solubility coefficient for oxygen in plasma | 1.4 × 10⁻⁹ mol/(cm3·mm Hg) |
| P50 = N50 /α, oxygen tension at 50% Hb saturation | 26 mm Hg |
| n, Hill exponent | 2.7 |
| S0, initial value of hemoglobin saturation | 0.9 |
| P0, initial value of oxygen tension | 59.6 mm Hg |
| Pw, capillary wall oxygen tension | 0 mm Hg |
| NT, total heme concentration | 2.03 × 10⁻⁵ mol/cm3 |
| k, oxyhemoglobin dissociation constant | 44 s−1 |
TABLE 2.
Definition and Values of Dimensionless Groups
| Group | Value |
|---|---|
| 385 | |
| 51 | |
| δ1 = ρ0.5N50/ NT | 0.039 |
| 0.017 |
The hematocrit level of 26% is appropriate for the capillaries and represents roughly 50% of systemic hematocrit. For convenience, oxygen tension P is kept dimensional, because it is easier to assess the results in dimensional units. Equations (1) and (2) are consistent with the Hill oxyhemoglobin dissociation curve under the equilibrium conditions
| (4) |
where P50 is the oxygen tension at 50% saturation (N50 = αP50), and n is the Hill exponent.
BOUNDARY AND INITIAL CONDITIONS
At the capillary wall (R = R0), the oxygen tension, Pw, was set to zero to simulate the rate of oxygen uptake by tissue under maximal oxygen demand. At R = 0, the capillary centerline, the radial flux of oxygen disappears (∂P/∂R = 0) because of the axial symmetry of the problem. At the cell—plasma boundary both and normal oxygen flux are continuous,
| (5) |
where N is the unit normal to the RBC boundary. At the lateral sections surrounding the cell, sections L2 and L3 in Figure 1, periodic boundary conditions are imposed for both P and S.
The initial conditions at t = 0 are such that is constant in the cell and plasma, P = P0, and the oxygen and hemoglobin are in the chemical equilibrium described by the Hill equation
| (6) |
where S0 is the initial hemoglobin saturation.
NUMERICAL METHOD
The problem was solved with a finite-element program, IMSL PDE/ PROTRAN. To implement the model, two modifications were made. First, because of the difficulty in implementing the periodic boundary conditions for a single RBC, a train of three or five cells was consid-ered, as shown in Figure 1b, and no-flux boundary conditions were imposed on the lateral sections denoted L0 and L5. As a result, the condition of periodicity on sections L2 and L3 was satisfied with sufficient accuracy (errors in local oxygen fluxes were less than 1%). Second, to avoid dealing with internal boundaries in the computational domain, hemoglobin concentration was defined in the entire domain, including the plasma. However, the diffusivity of hemoglobin in the plasma was set to a very small value so that the governing equation for hemoglobin saturation in the plasma region was reduced to approximately ∂S / ∂t = 0. The initial value of S was set to zero, and thus S ≈ 0 for all t in the plasma region. The advantage of this approach was that the equations for P and S were solved in the entire cylindrical domain; hence, the “internal” conditions of continuity for oxygen tension and normal flux at the cell boundary were satisfied automatically.
The number of triangles in the computational domain was typically 1200. This triangulation was created to generate a higher grid density near the RBC—plasma interface. The conjugate gradient method and a second-order Crank-Nicolson scheme were used in the calculations.
PARAMETERS OF THE MODEL
Numerical values of the parameters are given in Table 1. These values are the same as in [5] except for capillary diameter and RBC volume, which are taken from [19]. Because the shape of an RBC cannot be expressed by a single one-to-one function, every cell contour was divided into two parts, and each part was fitted, with a high degree of accuracy, by a fourth-degree polynomial. Erroŕ in RBC volume calculated from the fitted contours did not exceed 4%. Results were obtained for four RBC shapes that represent different degrees of RBC deformation, θ = 0, 3, 10, and 26.
RESULTS
The Nusselt number, a dimensionless group expressing the relationship between the oxygen flux and gradient, that is, transport conductance, is defined by
| (7) |
where ⟨ P ⟩ is the spatially averaged RBC, and F is the spatially averaged flux of oxygen out of the capillary,
| (8) |
This definition of Nusselt number is similar to that of the mass transfer coefficient k* defined in [5]. The difference is in the calcula-tion of concentration gradient: Federspiel and Popel [5] calculated the gradient to be α(P)(P* — Pw), the product of the plasma oxygen solubility coefficient and the difference between P* (oxygen tension corresponding to spatially averaged saturation ⟨ S ⟩ of an RBC through the Hill equation) and Pw (the capillary wall oxygen tension), but in Equation (7) P* is substituted by ⟨ P ⟩ (the spatially averaged RBC oxygen tension). We will show that despite the difference in definition, the values of k* and Nu are very close under the conditions of interest.
OXYGEN TENSION AND HEMOGLOBIN SATURATION DISTRIBUTION
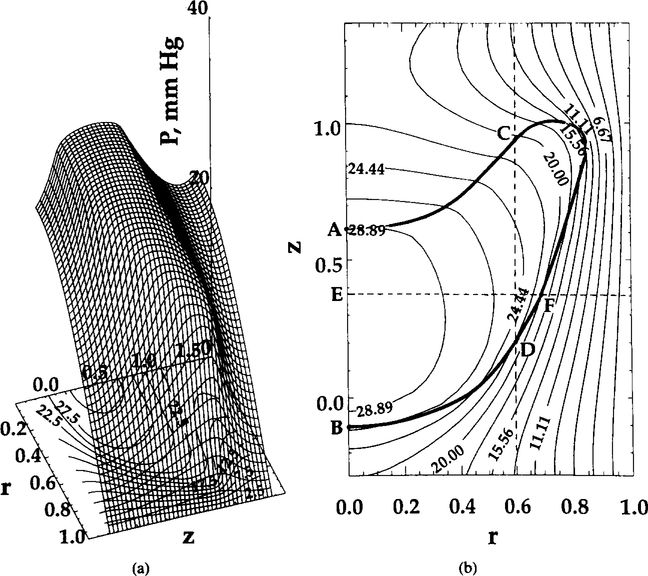
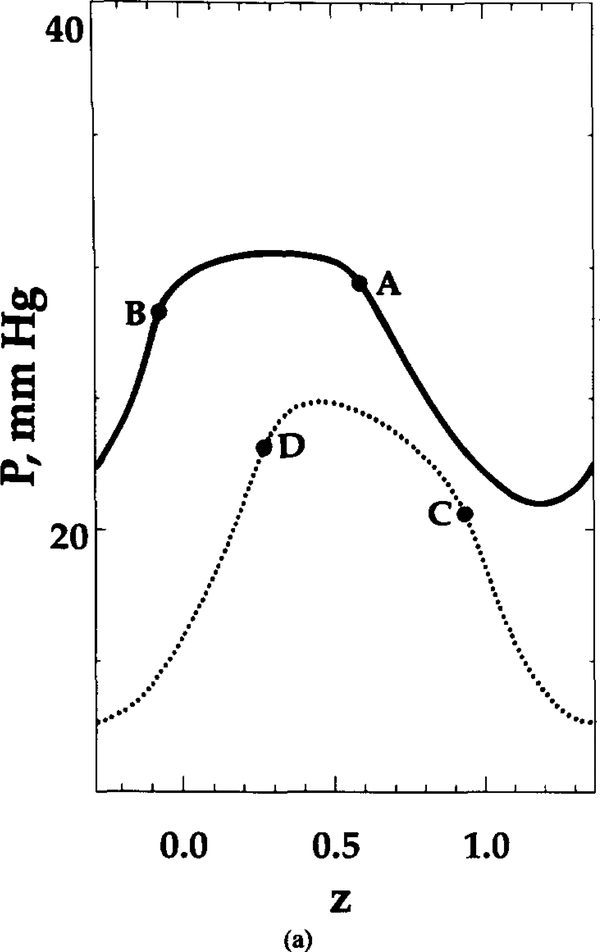
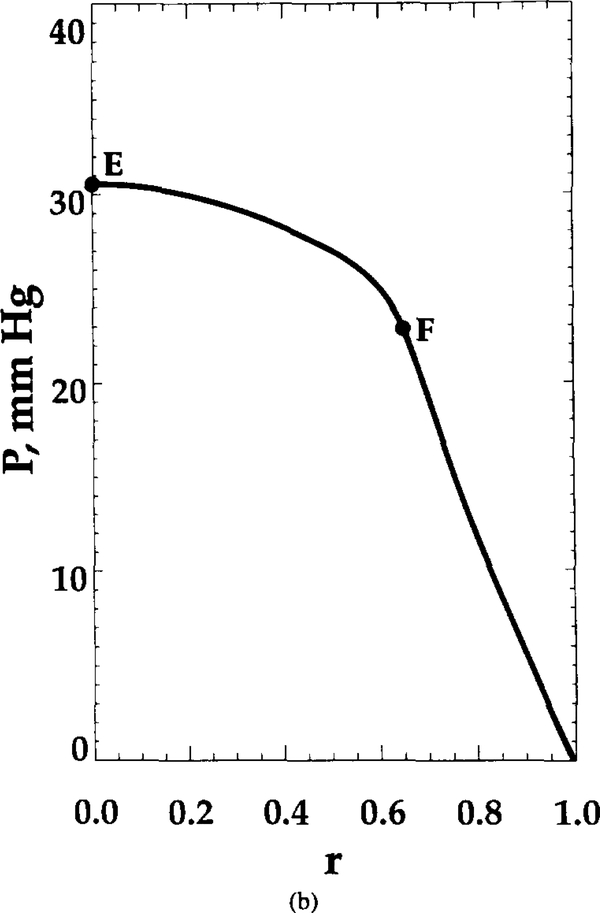
Figure 2 presents the surface and contour plots of PO for the central cell of the train. Due to the difference in effective oxygen diffusivity (free and facilitated diffusion) between the RBC and plasma and the oxygen replenishment from oxyhemoglobin inside the RBC, the gradients of oxygen tension inside the RBC are significantly smaller than those in the plasma. Axial and radial profiles are shown in Figure 3. Recall that the boundary conditions (5) at the RBC—plasma interface require continuity of the normal O2 flux. Oxygen flux in other directions may be discontinuous at the interface. In addition, because the diffusion and solubility coefficients inside and outside the RBC are different, the first derivatives of on both sides of the interface are, generally, different ( is always continuous). Graphs shown in Figures 2 and 3 and elsewhere in this paper are smoother at the RBC boundaries and do not reflect these discontinuities because of limitations of the software used in the present study.
FIG. 2.
Oxygen tension distribution at t = 0.22 s. Shape parameter θ = 10. (a) Surface plot; (b) contour plot. Ihe RBC contour is also shown in (b) by the heavy solid line.
FIG. 3.
Oxygen tension distribution at t = 0.22 s. Shape parameter θ = 10. distribution is shown for (a) constant radial position (r = 0, upper curve; r = 0.6, lower curve) and (b) constant axial position (z = 0.37), marked in Figure 2b by dashed lines. Points A, B, C, D, E, and F are the points of intersection of these lines with RBC contour or capillary centerline.
The plasma fractional resistance, γ, can be characterized by the ratio of the Nusselt number Nu and the Nusselt number Nu0, calculated in the hypothetical case when intraerythrocytic transport resistance is neglected,
| (9) |
The Nusselt number Nu0 is calculated with a boundary condition of constant oxygen tension P0 at the RBC—plasma interface, hence no resistance inside the RBC. The values of γ depend on the RBC shape, clearance, and residence time and the spatial dimensions and are summarized in Table 3. Particle clearance is defined as λ = (1 — b/ R0)−1, where b is the minimum plasma sleeve thickness. For the shape parameter θ ranging between 0 and 26, the values of γ range between 0.63 and 0.82. Because Nusselt number is inversely propor-tional to transport resistance, we conclude that the intraerythrocytic resistance accounts for approximately 20—35% of the total intracapillary resistance.
TABLE 3.
Nusselt Number and γ for Selected Values of Shape Parameter θ
| θ | Nu | Nu0 | γ | λ |
|---|---|---|---|---|
| 0 | 5.7 | 9.1 | 0.63 | 1.05 |
| 3 | 4.6 | 6.5 | 0.70 | 1.10 |
| 10 | 3.9 | 5.1 | 0.76 | 1.18 |
| 26 | 3.3 | 4.0 | 0.82 | 1.30 |
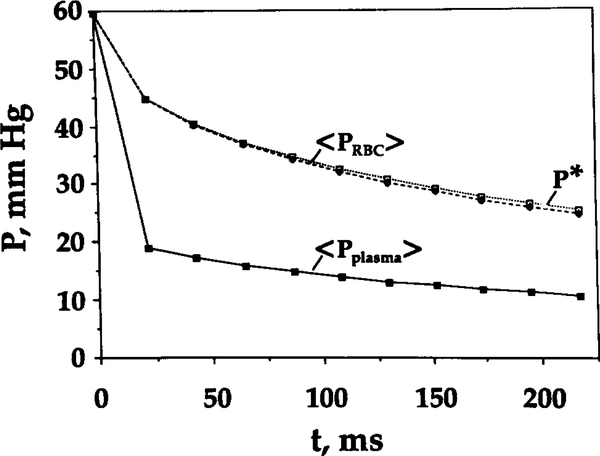
Figure 4 depicts the spatially averaged RBC and plasma and oxygen tension corresponding to spatially average saturation, P*, as a function of RBC residence time for shape parameter θ = 10. At the capillary entrance, RBC and plasma are assumed to be equal. However, both RBC and plasma drop quickly within the initial 0.02 s of RBC residence, by 15 and 40 mm Hg, respectively. This time course is consistent with an estimate of the characteristic time required for oxygen to diffuse from the plasma gap between RBCs: . It is also consistent with the time course of oxygen unloading from RBCs reported by Clark et al. [3]. The significant difference between RBC and plasma found in the present study corroborates predictions of Gutierrez [9] obtained with a continuum capillary model; this result will be further commented on in the Discussion. It can also be seen from this figure that the difference between the values of P* and the spatially averaged RBC oxygen tension, 〈 P ⟩, is small.
FIG. 4.
Spatially averaged RBC, plasma , and oxygen tension corresponding to spatially averaged saturation, P*, versus time. Shape parameter θ = 10.
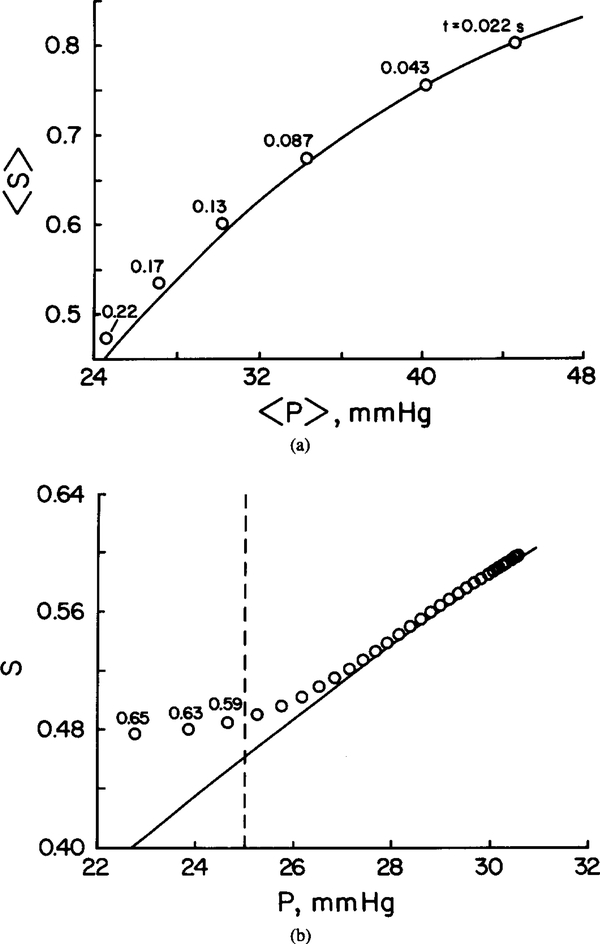
It is interesting to determine whether the chemical reactions are fast enough for the oxygen and hemoglobin to be nearly in local chemical equilibrium. This point is illustrated in Figure 5a, where the spatially averaged hemoglobin saturation 〈 S⟩ is plotted against the spatially averaged oxygen tension, 〈 P ⟩. Figure 5b displays the local oxygen tension and hemoglobin saturation values. The numbers of the reaction path diagram correspond to the residence time of RBC in seconds (Figure 5a) and the radial coordinate within the RBC (Figure 5b). It can be seen that the deviation from local chemical equilibrium is significant only in a boundary layer near the RBC—plasma interface. Since the volume of this thin layer constitutes only a very small fraction of total RBC volume, the relationship between spatially averaged values, ⟨ P ⟩ and ⟨ S⟩, falls closely on the sigmoidal oxygen—hemoglobin equilibrium dissociation curve. This finding corroborates the results of several studies [3, 18].
FIG. 5.
Deviation from local chemical equilibrium for θ = 10. Solid lines: Equilibrium curve. (a) Spatially averaged Hb saturation, 〈 S⟩, versus spatially averaged oxygen tension 〈 P ⟩. The numbers on the reaction path diagram correspond to RBC residence time in seconds. (b) Hemoglobin saturation versus local at t = 0.22 s. Points to the left of dashed line deviate from equilibrium by more than 5%. These local data points were obtained from the radial profiles along line E–F of Figure 2b. The numbers on the reaction path diagram correspond to the radial coordinate r.
EFFECT OF RED BLOOD CELL SHAPE ON OXYGEN TRANSPORT
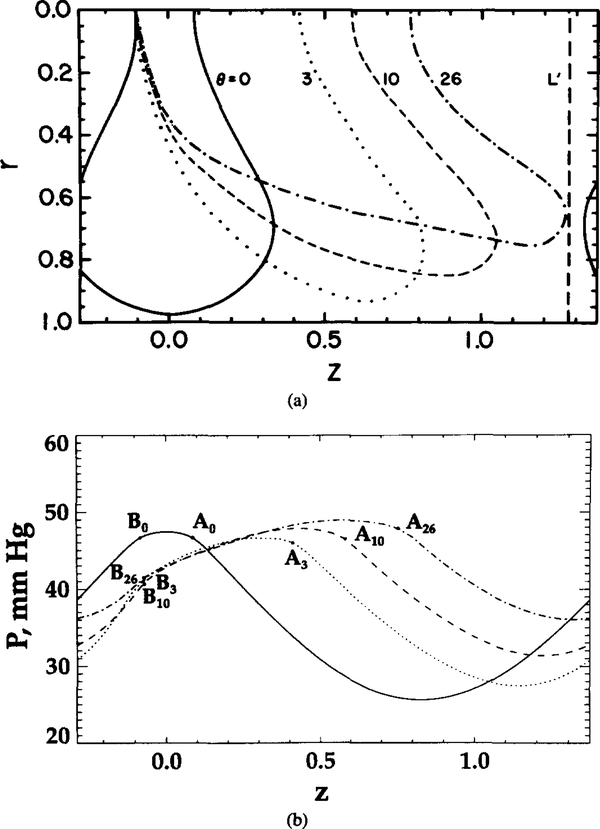
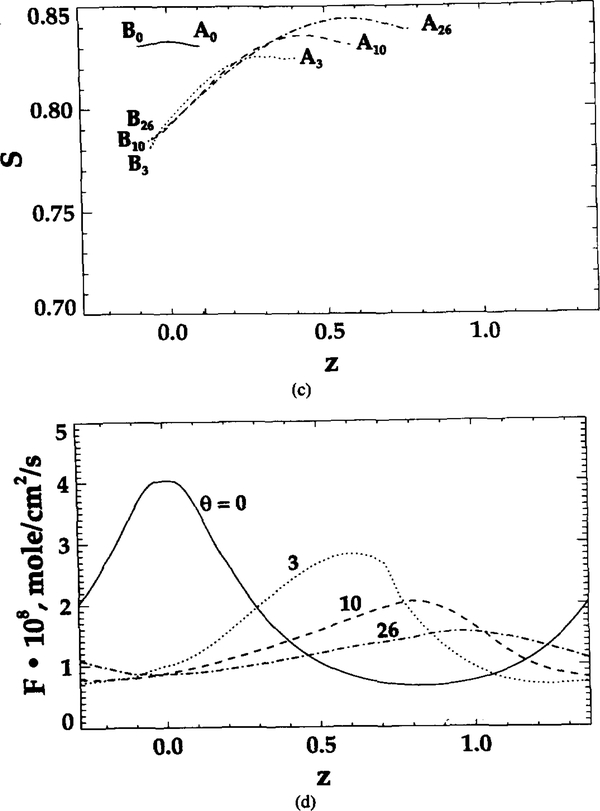
Figure 6 shows the variation of local and hemoglobin saturation for different degrees of RBC deformation. Aθ and Bθ represent the points on the cell contour at the capillary centerline for a given θ (same notation as in Figure 2b). In Figures 6b and 6c, the oxygen tension and hemoglobin saturation are higher at point Aθ (at the trailing edge of the cell) than at point Bθ (at the leading edge) for θ = 3, 10, and 26, even though the two points are equidistant from the capillary wall.
FIG. 6.
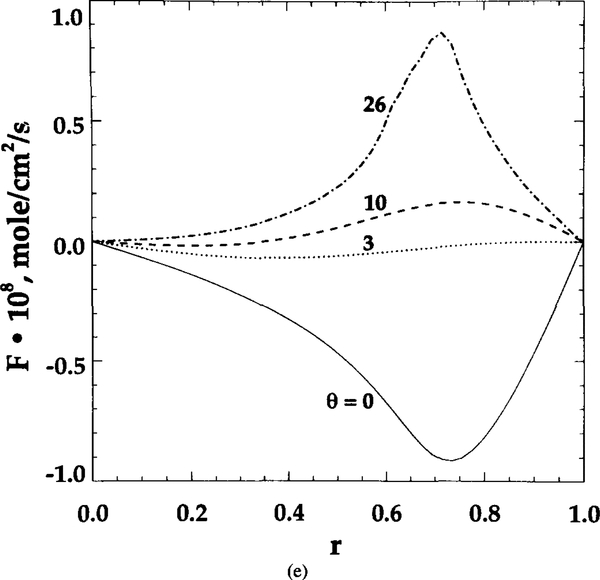
Dependence of local transport characteristics on RBC shape. Aθ and Bθ represent the points of intersection of RBC contours and capillary centerline for shape parameter θ. (a) Unit cell geometry. (b) profiles at capillary centerline. (c) Hemoglobin saturation S profiles at capillary centerline. (d) Radial oxygen flux at capillary wall. (e) Axial oxygen flux at section L’ shown in (a) by a vertical dashed line
As θ increases from 0 to 26, the difference in both and S between points Aθ and Bθ increases. These uneven values indicate that geometric shape affects the microscopic distribution of oxygen tension, flux, and hemoglobin saturation. RBC geometry prevents some sites (like A) from effectively transporting oxygen into tissue. However, the increase in θ makes the capillary wall flux more uniform (Figure 6d). The ratio of peak to bottom oxygen flux decreases from 4 to 1.5 with the increase in θ from 0 to 26. Figure 6e displays the axial oxygen flux profile at section L’, which is depicted in Figure 6a by a vertical dashed line. The axial fluxes are the highest at θ = 0 and 26; however, they are of opposite sign. Since the cell contour at θ = 0 of the neighboring cell to the right is much closer to section L’ than to the cell contour of this unit cell, the negative value of the axial flux means that the diffusional flux from the neighboring cell dominates in this region. Similarly, for θ = 26, a significant positive axial flux is obtained because this contour is more elongated along the capillary and is much closer to section L’ than its neighbor. For θ = 3 and 10, the axial fluxes are low because both cell contours are away from section L’.
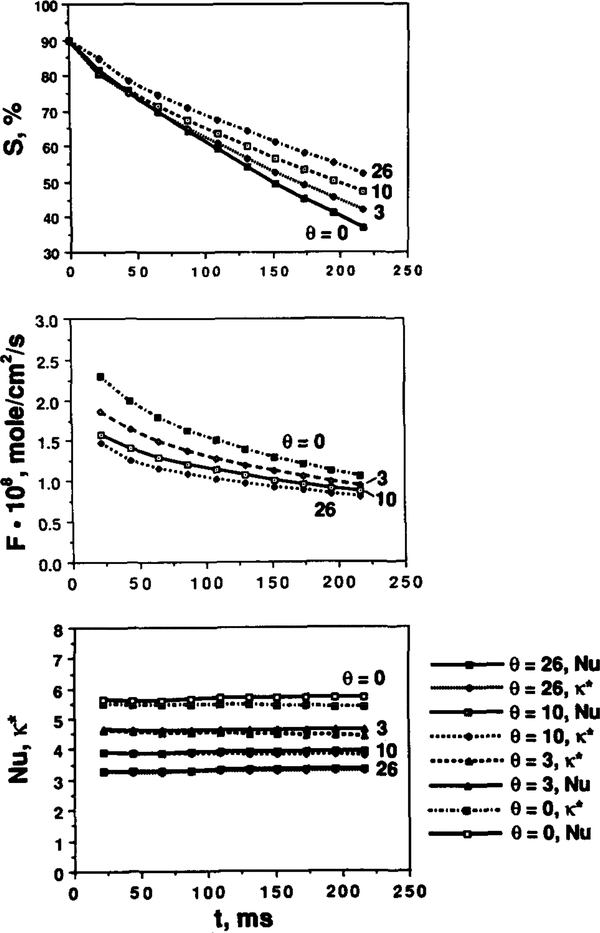
The effects of shape parameters on oxygen transport, specifically on spatially averaged oxygen flux, hemoglobin saturation, and Nusselt number are shown in Figure 7. In Figure 7a, the hemoglobin saturation is plotted as a function of time. The decrease in θ yields a faster oxygen release rate. Figure 7b shows that oxygen flux decreases as time and θ increase. For the undeformed RBCs (θ = 0), oxygen flux drops from 2.3 × 10⁻⁸ to 1.13 × 10⁻⁸ mol/(cm2·s) within 0.198 s. The corresponding decrease for the highly deformed RBCs (θ = 26) is from 1.48 × 10⁻⁸ to 0.84 × 10⁻⁸ mol/(cm2·s). Comparison between fluxes from the present model and those from Clark et al. [3] shows that in the latter case the initial flux is higher and the rate of decrease in higher. The difference in oxygen unloading rates results from the fact that in [3] a zero boundary condition was imposed at the RBC membrane, whereas our zero boundary condition was imposed at the capillary wall. The slower oxygen unloading rate in our model is due to the transport resistance in the plasma region. Figure 7c shows that the Nusselt number remains approximately constant with time for each shape. As θ increases, the Nusselt number decreases. The values of Nu and k* defined above, both representing capillary conductance to oxygen transport, are very close for all values of parameters studied.
FIG. 7.
Hemoglobin saturation, oxygen flux, Nusselt number, and mass transfer coefficient versus time for different RBC shapes. (a) Spatially averaged hemoglobin saturation versus time; (b) spatially averaged radial O2 flux at the capillary wall versus time; (c) transport conductance (Nusselt number and k* ) versus time.
DISCUSSION
TRANSPORT RESISTANCE
There are several steps in the transport pathway for oxygen from blood to the tissue cell mitochondria. First, oxygen dissociates from oxyhemoglobin in RBCs, and then it diffuses out of the RBCs into the plasma. Oxygen continues to diffuse outward across the perierythrocytic carrier-free region, consisting of a plasma gap, the capillary endothelium, and the interstitial space, until it reaches the parenchymal cell membrane. Our simulation shows that the oxygen tension drop inside the RBCs and plasma is approximately 5 mm Hg and 20 mm Hg, respectively, under conditions simulating maximal tissue oxygen demand, that is, zero at the capillary wall. This result is consistent with the prediction of Honig et al. [15]; they proposed that the drop of oxygen tension from the interior to the surface of an RBC is 3–4 mm Hg at maximal O2 consumption, and the carrier-free region of approximately 1.5 μm may account for 30 mm Hg drop or 20 mm Hg/ μm gradient. Therefore, this region behaves as a functional barrier in the microcirculatory transport pathway. It should be noted, however, that the O2 flux value corresponding to zero wall is higher than the typical reported experimental values for working skeletal muscle. A more detailed model, combining capillary and tissue regions, is needed for a quantitative comparison with experimental data. We also note that the uniform capillary oxygen conductance shown in Figure 7c differs from that predicted by Baxley and Hellums [2]. They reported an increasing conductance along the capillary that was derived from a constant-flux boundary condition. This difference is a result of the different boundary conditions in the two studies.
RBC TRANSIT TIME
One other important capillary transport parameter is the erythrocyte transit time that determines the fractional capillary oxygen extraction. For a longer RBC transit time, a larger fraction of oxygen is extracted, and therefore better oxygen utilization is accomplished. Only limited direct measurements of RBC transit times in striated muscle are available (e.g., [16]); however, several indirect estimates have been obtained. Honig and Odoroff [14] estimated mean transit times of 300 ms at stimulation rates of 4 Hz and 100 ms at 8 Hz for working dog gracilis muscle. The boundary condition of zero capillary wall in our model is a lower bound for the conditions of maximal tissue oxygen demand. RBC transit time in our simulation is assumed to be 220 ms, in accordance with the above values.
COMPARISON WITH OTHER CAPILLARY TRANSPORT MODELS
Capillary oxyhemoglobin desaturation was investigated by use of several previous microcirculatory models. We compare our model geometry and the results of these previous studies in Table 4.
TABLE 4.
Comparison of Parameters of Several Models
| Parameter | Honig et al. [15] | Groebe and Thews [7] | Federspiel and Popel [5] | Groebe and Thews [8] | Present work |
|---|---|---|---|---|---|
| Capillary radius | 2.5 μm | 2.75 μ m | 2.2–3 μ | 2.75 μm | 4.12 μm |
| RBC shape | Cylindr | Cylindr | Sphere | Cylindr | See Figure 1 |
| RBC size | Radiu = 1 or 2 μ m | Radiu = 1–2 μ m; length = 7.32 μ m | Radiu = 2 μ m | Radius =2 μ m; length = 5.25 μ m | See Figure 1 |
| RBC volume | —a | 92 μ m3 | 33.5 μ m3 | 66 μ m2 | 94.1 μ m3 |
| RBC surface area | —a | 117.12 μ m2 | 50.25 μ m2 | 91.10 μ m2 | 134.1 μ m2 |
| Capillary wall boundary condition | Pw = 0 | Pw = 2–3 mm Hg | Pw = 0 or 10 mm Hg | Pw = 3 mm Hg or corresp. boundary flux | Pw = 0 |
| Cell spacing | —a | 1 RBC length | 0.1–3 RBC diameters | 1–4 RBC lengths | Unit cell length = 6.8 μm |
| Thickness of perierythrocytic resistance layer | 1 or 2 μm | Plasma sleeve, 0.75 μm; resistance layer; 1–2 μm | Variable | Thickness of endothelium and interstitial space, 0.8–3.2 μm | Variable |
| Capillary inlet hemoglobin saturation | 85% | 85% | 90% | 85% | 90% |
RBCs are distributed continuously, no plasma gap between cells.
Honig et al. [15] modeled the RBC as a cylinder of 1 or 2 μm radius. In their model, the RBC was surrounded by a resistance layer that accounted for the diffusional resistance of the plasma, endothelium, and extracellular regions that separated the RBC from muscle fiber. The boundary condition for at the edge of this resistance layer was set to zero to simulate the oxygen transport under maximal tissue oxygen demand. However, the diffusion from the two “end-caps” of the RBC cylinder was neglected.
In a similar way, Groebe and Thews [7, 8] approximated erythrocyte, plasma, and tissue spaces by axially symmetric coaxial cylinders. The cylinder representing the RBC was filled with hemoglobin and was shorter than the other; RBCs in capillaries were separated from each other by plasma gaps. On the lateral cylinder surface, a constant or constant oxygen flux was specified. Hence, these boundary conditions provided an upper-bound estimate of the nonuniformity of capillary wall oxygen flux and tension.
The novelty of the present model is that the RBC shape is no longer limited to cylindrical or spherical shapes. The deformation of RBCs allows for the nonuniform, asymmetric distribution of oxygen flux at the capillary wall, providing a more realistic simulation of the passage of an erythrocyte along a capillary. Figure 6d shows the normal oxygen flux distribution along the capillary wall. Due to the shape of the deformed RBC, the flux curve shows asymmetric slopes around the peak value. There is a higher oxygen transport rate near the tail of each cell. It can be seen that the nonuniformity of capillary wall oxygen flux decreases with the increase in θ. Comparison of the results shows that Groebe and Thews predicted a curve with a wider plateau than ours. This difference can be attributed primarily to the difference between the model geometries.
EFFECT OF RBC SHAPE
Our analysis showed that oxygen flux and Nusselt number decrease as shape parameter θ increases at a constant hematocrit. Even though each RBC has the same volume and surface area, some of the surface area is not functional for oxygen unloading because of the geometrical hindrance. Because these “dead” surface areas are shielded by other parts of the cell, they do not provide for efficient diffusive transport between the RBC and plasma.
As θ decreases, the plasma gap between the RBC and the capillary wall becomes thinner, and this effectively increases the oxygen exchange area; thus both the oxygen flux and Nusselt number increase. Since the RBC shape is closely related to the hydrodynamic pressure drop across the two sides of the cell and this pressure drop depends on the RBC velocity, the velocity may influence the intracapillary transport of oxygen not only via convective transport but also indirectly via diffusive transport.
In comparing the results of the present model with previous results obtained for spherical and cylindrical particles, it should be kept in mind that values of the parameters used in simulations have a significant effect on the predictions. Baxley and Hellums [2] reported Nusselt number values ranging between 4 and 12 in modeling erythrocytes as cylindrical slugs that alternate with plasma gaps such that oxygen is transported by radial diffusion. Their Nusselt number values are similar to ours (Table 3), even though a different boundary condition, hemat-ocrit, and other parameters are used. The higher value of hematocrit (50%) in their model tends to predict a higher transport conductance; however, it is difficult to identify the respective role of each factor.
EFFECT OF CHEMICAL KINETICS
Theoretical and experimental studies of Gutierrez [9] and Gutierrez et al. [10, 11] suggest that chemical kinetics is an important factor to be considered in tissue oxygenation. They observed a higher difference between mean tissue and venous in hypoxemia and anemia than in normoxia. The effect was attributed to chemical kinetics. The assumption of instantaneous release of oxygen from RBC to plasma, which leads to a chemical equilibrium between oxygen and hemoglobin inside an RBC, might not be valid for every point in the capillary. Gutierrez [9] explained the deviation between end-capillary and venous predicted by his model by the following arguments. The chemical reaction limits oxygen replenishment from hemoglobin-bound to free form, the result being that plasma oxygen tension lags behind the “equilibrium”. When RBCs reach the venous pool, the hemoglobin and plasma reequilibrate, causing oxygen tension to rise. These results suggest that venous may not be an accurate measure of tissue under hypoxic conditions. In addition to the kinetic effects explanation, the discrepancy between tissue and venous values might be explained by functional peripheral shunts that decrease the efficiency of oxygen utilization, such as arteriovenous anastomoses, or by diffusional transport of oxygen between arterioles and venules.
Our results showed that for the shape parameter θ = 10, end-capillary plasma is about 15 mm Hg lower than RBC (Figure 4), a finding that is in qualitative agreement with the results of Gutierrez. However, major differences in the two models make it difficult to compare the results quantitatively. First, Gutierrez’s model is a continuum model, whereas ours is discrete. Second, the values of oxygen flux used in the models are probably different; and, third, the reaction coefficients used in these two simulations are different. Gutierrez’s kinetic coefficients are smaller than ours, apparently because his coefficients include both true kinetic and passive diffusion effects. These smaller values may account for the diffusional resistance of oxygen inside and outside the red blood cell in his model.
Acknowledgments
We wish to thank Ms. Marcia Riley for technical assistance and Mrs. Brenda Moon for help in preparation of the manuscript. This work was performed in partial fulfillment of the requirements for M.S. degree in Biomedical Engineering (C.-H. W.). Supported by NIH grant HL 18292.
REFERENCES
- 1.Aroesty J and Gross JF, Convection and diffusion in the microcirculation, Microvasc. Res 2:247–267 (1970). [DOI] [PubMed] [Google Scholar]
- 2.Baxley PT and Hellums JD, A simple model for simulation of oxygen transport in the microcirculation, Ann. Biomed. Eng 11:401–416 (1983). [DOI] [PubMed] [Google Scholar]
- 3.Clark A Jr., Federspiel WJ, Clark PA, and Cokelet GR, Oxygen delivery from red cells, Biophys. J 47:171–181 (1985). [DOI] [PMC free article] [PubMed] [Google Scholar]
- 4.Federspiel WJ and Sarelius IH, An examination of the contribution of red cell spacing to the uniformity of oxygen flux at the capillary wall, Microvasc. Res 27:273–285 (1984). [DOI] [PubMed] [Google Scholar]
- 5.Federspiel WJ and Popel AS, A theoretical analysis of the effect of particulate nature of blood on oxygen release in capillaries, Microvasc. Res 32:164–189 (1986). [DOI] [PMC free article] [PubMed] [Google Scholar]
- 6.Gaehtgens P, Duhrssen C, and Albrecht KH, Motion, deformation, and interaction of blood cells and plasma during flow through narrow capillary tubes, Blood cells 6:799–812 (1980). [PubMed] [Google Scholar]
- 7.Groebe K and Thews G, Theoretical analysis of oxygen supply to contracted skeletal muscle, Adv. Exp. Med. Biol 200:495–514 (1986). [DOI] [PubMed] [Google Scholar]
- 8.Groebe K and Thews G, Effects of red cell spacing and red cell movement upon oxygen release under conditions of maximally working skeletal muscle, Adv. Exp. Med. Biol 248:175–185 (1989). [DOI] [PubMed] [Google Scholar]
- 9.Gutierrez G, The rate of oxygen release and its effect on capillary O2 tension: a mathematical analysis, Resp. Physiol 63:79–96 (1986). [DOI] [PubMed] [Google Scholar]
- 10.Gutierrez G, Lund M, Acero AL, and Marini C, Relationship of venous PO2 to muscle PO2 during hypoxemia, J. Appl. Physiol 67(3):1093–1099 (1989). [DOI] [PubMed] [Google Scholar]
- 11.Gutierrez G, Marini C, Acero AL, and Lund N, Skeletal muscle PO2 during hypoxemia and isovolumic anemia, J. Appl. Physiol 68(5):2047–2053 (1990). [DOI] [PubMed] [Google Scholar]
- 12.Hellums JD, The resistance to oxygen transport in the capillaries relative to that in the surrounding tissue, Microvasc. Res 13:131–136 (1977). [DOI] [PubMed] [Google Scholar]
- 13.Homer LD, Weathersby PK, and Kiesow LA, Oxygen gradients between red blood cells in the microcirculation, Microvasc. Res 22:308–323 (1981). [DOI] [PubMed] [Google Scholar]
- 14.Honig CR and Odoroff CL, Calculated dispersion of capillary transit times: significance for oxygen exchange, Am. J. Physiol 240:H199–H208 (1981). [DOI] [PubMed] [Google Scholar]
- 15.Honig CR, Gayeski TEJ, Federspiel WJ, Clark A Jr., and Clark P, Muscle O2 gradients from hemoglobin to cytochrome: new concepts, new complexities, Adv. Exp. Med. Biol 169:23–38 (1984). [DOI] [PubMed] [Google Scholar]
- 16.Sarelius IH and Duling BR, Direct measurement of microvessel hematocrit, red cell flux, velocity and transit time, Am. J. Physiol 243:H1018–H1026 (1982). [DOI] [PubMed] [Google Scholar]
- 17.Sheth BV and Hellums JD, Transient oxygen transport in hemoglobin layers under conditions of the microcirculation, Ann. Biomed. Eng 8: 183–196 (1980). [DOI] [PubMed] [Google Scholar]
- 18.Yap EW and Hellums JD, Use of Adair four-step kinetics in mathematical simulation of oxygen transport in the microcirculation, Adv. Exp. Med. Biol 215:193–207 (1986). [DOI] [PubMed] [Google Scholar]
- 19.Zarda PR, Chien S, and Skalak R, Interaction of viscous incompressible fluid with an elastic body, Symp. Fluid—Structure Interaction, ASME, New York, 1977, pp. 65–82. [Google Scholar]


