Abstract
We present a new technique to fully automate the segmentation of an organ from 3D ultrasound (3D-US) volumes, using the placenta as the target organ. Image analysis tools to estimate organ volume do exist but are too time consuming and operator dependant. Fully automating the segmentation process would potentially allow the use of placental volume to screen for increased risk of pregnancy complications. The placenta was segmented from 2,393 first trimester 3D-US volumes using a semiautomated technique. This was quality controlled by three operators to produce the “ground-truth” data set. A fully convolutional neural network (OxNNet) was trained using this ground-truth data set to automatically segment the placenta. OxNNet delivered state-of-the-art automatic segmentation. The effect of training set size on the performance of OxNNet demonstrated the need for large data sets. The clinical utility of placental volume was tested by looking at predictions of small-for-gestational-age babies at term. The receiver-operating characteristics curves demonstrated almost identical results between OxNNet and the ground-truth). Our results demonstrated good similarity to the ground-truth and almost identical clinical results for the prediction of SGA.
Keywords: Reproductive Biology
Keywords: Diagnostic imaging, Obstetrics/gynecology
Deep-learning was used to automatically segment the placenta in first trimester 3D ultrasound images, and automatic placental volume measure gave similar performance to semi-automated methods.
Introduction
Researchers have been attempting to “teach” computers to perform complex tasks since the 1970s. With the falling cost of hardware and availability of open-source software packages, machine learning has experienced something of a renaissance. This has led to the development of several deep-learning methods, so named as they use neural networks with a complex, layered architecture. Fully convolutional neural networks (fCNNs) have provided state-of-the-art performance for object classification and image segmentation (1). Of 306 papers surveyed in a 2017 review on deep learning in medical imaging (2), 240 were published in the last 2 years. Of those using 3D data, most used relatively small amounts of labeled “ground-truth” data sets for training (n = 10; median, 66;,range, 20–1,088). The Dice similarity coefficient (DSC, an index representing similarity between predicted and manually estimated data) in these studies was variable (median, 0.84; range, 0.72–0.92) and dependent on the difficulty of the segmentation task and imaging modality used. The key advantage of fCNNs is their robust performance when dealing with very heterogeneous input data, a particular challenge in ultrasound imaging. Efforts to segment the fetal skull in 3D ultrasound (3D-US) have obtained a DSC of 0.84 (3). A deep-learning method to segment the placenta in MRI with a training set of 50 cases obtained a DSC of 0.72 (4). However, for fCNNs to be trained effectively, large data sets are required that reflect the diversity of organ appearance. Obtaining ground-truth data sets is challenging due to the laborious nature of data labeling, which typically is performed by clinicians experienced with the particular imaging modality. Efforts to segment the placenta using different fCNNs have been recently presented, but both used small data sets (5, 6). A pilot study performed by the authors of this study using a different, simpler architecture and only 300 cases obtained a DSC of 0.73 (5), while another demonstrated a DSC of 0.64 using 104 cases (6). While promising, what remains unclear is whether the DSC value, which is analogous to segmentation performance, is a result of the fCNN used or a reflection of the size the training set used.
First trimester placental volume (PlVol) has long been known to correlate with birth weight at term (7–9), and it was suggested as early as 1981 that PlVol measured with B-mode ultrasound could be used to screen for growth restriction (10). Since then many studies have demonstrated that a low PlVol between 11 and 13 weeks of gestation can predict adverse pregnancy outcomes, including small for gestational age (SGA) (11) and preeclampsia (7). As PlVol has also been demonstrated to be independent of other biomarkers for SGA, such as pregnancy-associated plasma protein A (PAPP-A) (8, 11) and nuchal translucency (11), a recent systematic review concluded that it could be successfully integrated into a future multivariable screening method for SGA (12) analogous to the “combined test” currently used to screen for fetal aneuploidy. As PlVol is measured at the same gestation as this routinely offered combined test, no extra ultrasound scans would be required, making it more economically appealing to healthcare providers worldwide.
Until now, the only way to estimate PlVol was for an operator to examine the 3D-US image, identify the placenta and manually annotate it. Commercial tools, such as Virtual Organ Computer-aided AnaLysis (VOCAL; General Electric Healthcare) and a semiautomated random walker–derived (RW-derived) method, have been developed (13) to facilitate this process, but they remain too time consuming and operator dependent to be used as anything other than research tools. For PlVol to become a useful imaging biomarker, a reliable, real-time, operator-independent technique for estimation is needed.
This study has three major contributions to the application of deep learning to medical imaging. First, we applied a deep-learning fCNN architecture (OxNNet) to a large amount of quality-controlled ground-truth data to generate a real-time, fully automated technique for estimating PlVol from 3D-US scans. Second, the relationship of segmentation accuracy to size of the training set was investigated to determine the appropriate amount of training data required to optimize segmentation performance. Finally, the performance of the PlVol estimates generated by the fully automated fCNN method to predict SGA at term was assessed.
Results
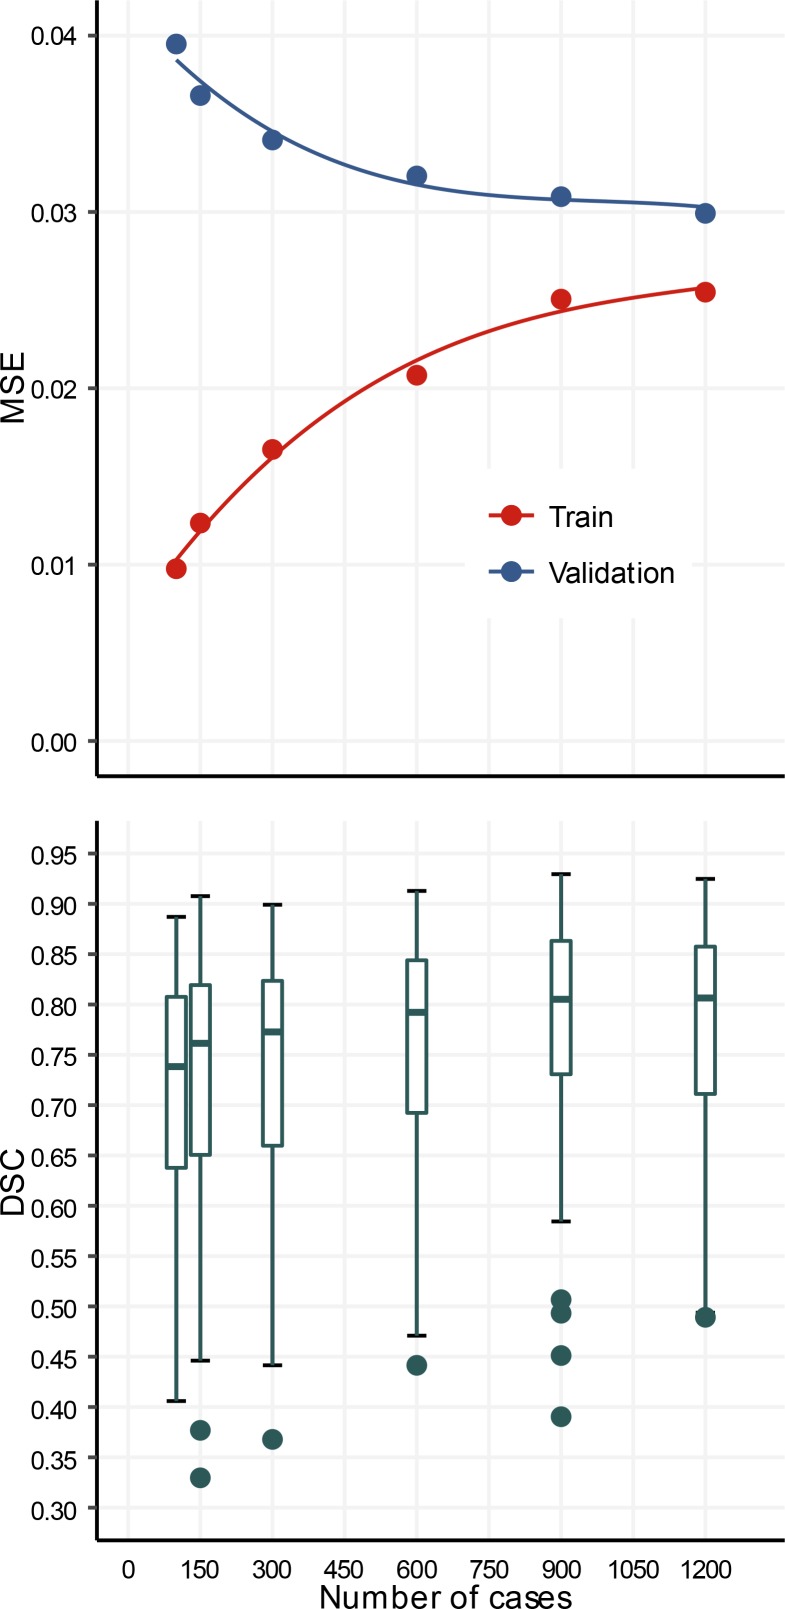
The performance of models trained end to end on training sets with 100, 150, 300, 600, 900, and 1,200 cases is shown in Figure 1. The mean squared error on the validation set decreased monotonically from 0.039 to 0.030 and increased monotonically from 0.01 to 0.025 on the training set. The median (interquartile range) DSC obtained on the validation set throughout training increased monotonically from 0.73 (0.17) to 0.81 (0.15). Statistical analysis demonstrated a significant improvement in the DSC values with increasing training set size (ANOVA, P < 0.0001).
Figure 1. OxNNet Training.
Learning curves of mean squared error (MSE) for both training (red) and validation (blue) data sets for different numbers of cases in training. Box plot of Dice similarity coefficients (DSC) for OxNNet using different numbers of cases in training (100–1,200).
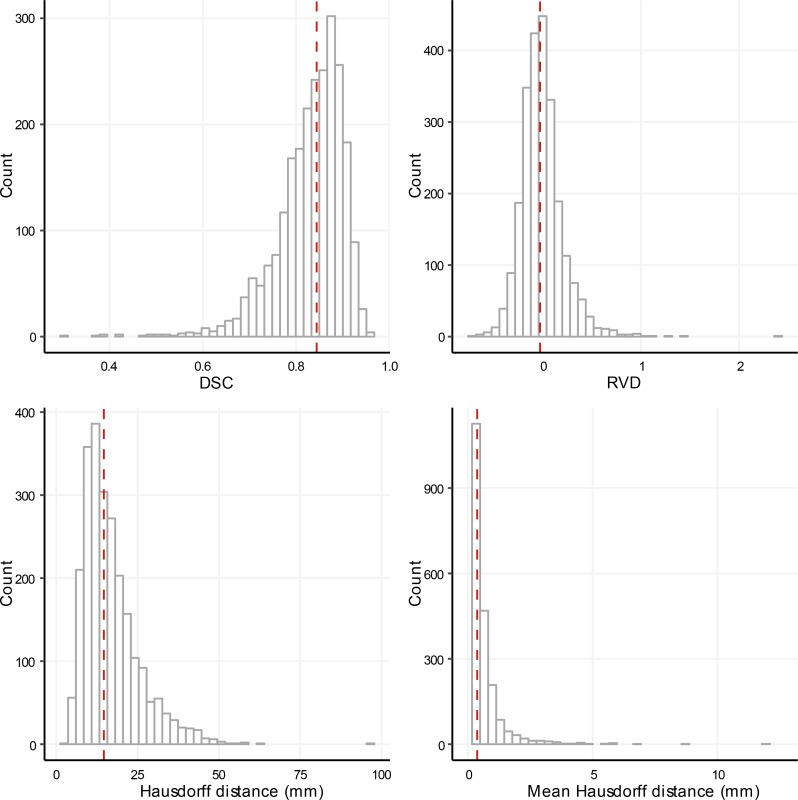
The distributions of the metrics used to evaluate the performance of the automated segmentation are shown in Figure 2. The median (interquartile range) of the DSC, relative volume difference (RVD), Hausdorff distance, and mean Hausdorff distance were 0.84 (0.09), –0.026 (0.23), 14.6 (9.9) mm and 0.37 (0.46) mm, respectively. The correlation coefficients for the 4 metrics (Table 1), demonstrated a closer correlation between the mean Hausdorff distance and the DSC compared with the Hausdorff distance and DSC or the absolute value of the RVD and DSC.
Figure 2. OxNNet Metrics.
Histograms showing the distribution of the Dice similarity coefficient (DSC), relative volume difference (RVD), and Hausdorff distance (actual and mean values) for the cross validated test sets of 2,393 cases. The median is shown by the red dashed line in each figure.
Table 1. Pearson’s correlation coefficient and 95% CIs for the metrics.
A visual comparison of the ground-truth (RW) segmentation and the OxNNet segmentation with postprocessing applied, as described above, is shown for a typical case (51st DSC centile in Figure 2) in Figure 3 and Supplemental Video 1 (supplemental material available online with this article; https://doi.org/10.1172/jci.insight.120178DS1), showing the rotation and different slicing through the 3D-US volume.
Figure 3. OxNNet compared to groundtruth.
Placental segmentations with 2D B-mode plane (left). RW segmentation (center; red). OxNNet prediction (right; blue). The values of the Dice similarity coefficient and Hausdorff distance metrics for this case were 0.838 and 12.6 mm, respectively.
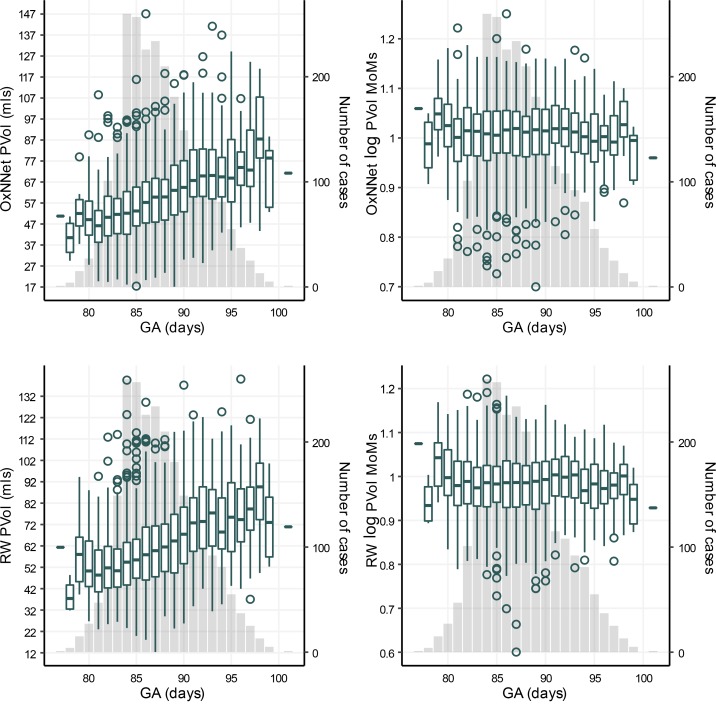
The median (minimum/maximum) values of PlVol for OxNNet and RW were 59 ml (17 ml/147 ml) and 60 ml (12/140), respectively. The PlVol (in ml) and log PlVol multiples of the median (MoMs) are shown in Figure 4. There were 157 cases of SGA in the cohort.
Figure 4. Placental volume and gestational age.
Box plots showing the distribution of actual placental volumes (PlVol) for OxNNet, the logarithm of the multiples of the medians (MoMs) for OxNNet, actual placental volumes (PlVol) for random walker, and the logarithm of MoMs for random walker versus the gestational age (GA). The number of cases for each GA (y axis on the right) is plotted as a column chart in the background.
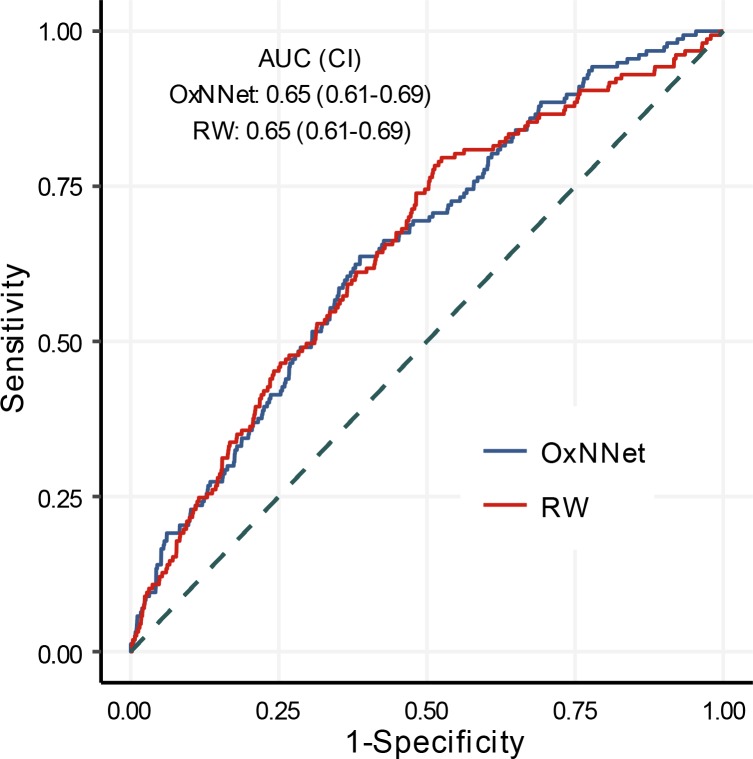
The receiver-operating characteristics (ROC) curves for the log PlVol (MoMs) calculated by the fully automated fCNN (OxNNet) and the RW technique to predict SGA are shown in Figure 5. The AUCs for both techniques were almost identical at 0.65 (95% CI, 0.61–0.69) for OxNNet and 0.65 (95% CI, 0.61–0.70) for the RW ground-truth.
Figure 5. Sensitivity and specificity.
Receiver-operating characteristics (ROC) curves of placental volume calculated by both the fully automated fCNN (OxNNet) and the random walker (RW) technique to predict small for gestational age (SGA: <10th percentile birth weight). AUC and 95% CIs are shown for each model.
Discussion
In summary, deep learning was used with an exceptionally large ground-truth data set to generate an automatic image analysis tool for segmenting the placenta using 3D-US. To the best of our knowledge, this study uses the largest 3D medical image data set to date for fCNN training. In a number of data science competitions, the best performing models have used similar model architectures with poorer performing models but employed data augmentation to artificially increase the training set (2), suggesting a link between performance and the data set size. The learning curves presented here demonstrate a key finding of the need for large training sets and/or data augmentation when undertaking end-to-end training. The mean squared error learning curves of this model architecture the training and validation curves converged toward 0.275 as the training set size is increased. This was reflected in the monotonic increase across training samples, where the DSC for 1,200 training cases was 0.81 and the DSC was 0.73 for 100 training samples. These results show that by using approximately an order of magnitude more training data (100 to 1,200) segmentation performance measured by DSC increased by 0.08.
Assessing whether OxNNet can appropriately segment the placenta from a 3D-US volume relies on the benchmark against which it is judged. We have gauged this in two ways; first, by how similar it is to the ground-truth data set and, second, how the estimated PlVols perform in the clinically relevant situation of predicting the babies who will be born small. The results are very promising for both. The median DSC of OxNNet was 0.84, a considerable improvement upon previously reported values of 0.64 (6) and 0.73 (5), demonstrating increased similarity between the PlVols estimated by OxNNet and those generated by the ground-truth RW algorithm. Previous work to segment the fetus in 3D-US obtained DSC values of 0.84 (3), and previous work to segment of the placenta in MRI images obtained a DSC of 0.71 (4). On assessment of clinical utility, the OxNNet PlVol estimates perform as well for the prediction of SGA as those generated by the previously validated RW technique and outperform the estimates generated in the original analysis of these data using the proprietorial VOCAL tool (AUC 0.60 [0.55–0.65]) (14).
In terms of similarity to the ground-truth, distributions of the metrics in Figure 2 show that 90% of cases had a DSC >0.74 and a Hausdorff distance <28 mm. Discrepancy between the ground-truth segmentation and the prediction by OxNNet must be due either to an error with OxNNet or with the ground-truth. The commonly regarded gold standard for segmentation of a target organ in a ultrasound volume is manual segmentation. This involves painstakingly drawing in the outline of the organ for every slice of the 3D image. This is highly operator dependant. The RW technique has been shown to be comparable to manual segmentation in all aspects of observer reliability (13) and is less time consuming but still remains dependant on the operator’s ability to identify the placenta and its boundaries. The major issue here is that ultrasound images in the first trimester can be very difficult to interpret, and, ultimately, the exact position of the interface between the placenta and the myometrium is often a difficult call, even in the hands of a highly experienced sonographer. Any system reliant on human judgement will be open to increased interobserver and intraobserver variability in these situations, and, therefore, despite considerable efforts to quality control the ground-truth data set, it is highly likely that errors in the segmentation have occurred. It is anticipated that an automatic system working from a voxel-level algorithm will be more reproducible when confronted by such difficult boundaries, but further investigation is needed to confirm this. Another limitation of this study is that the data were collected several years ago using an ultrasound system that has since been superseded by two newer generations. As B-mode quality has significantly improved, it is hoped that the image quality will be increased in future studies facilitating easier segmentation.
The RVD metrics demonstrated that OxNNet generally overestimates the volume of the placenta when compared with the ground-truth. Thin mislabeled regions spreading away from the placenta increase the Hausdorff distance without dramatically affecting the DSC values. In some cases, it was evident that OxNNet had labeled some of the myometrium as placental tissue. This may have been a result of inconsistent identification of the uteroplacental interface by the operator in the ground-truth data set, especially when there was difficulty deciding where this interface lay. However, by increasing the context of the fCNN, either by using a larger receptive field, employing a secondary recursive neural network (6), or using conditional random fields (15), the mislabeling error may reduce. Further work is required to investigate this.
The PlVol generated by OxNNet demonstrates that for a false positive rate of 10%, the estimated detection rate for SGA is 23% (16%–31%); this is an improvement on the previously published (14) detection rate of 18% (12%–27%) seen with the same data set but using the operator-dependant VOCAL system. This alone is not good enough to provide a clinically useful screening tool. However, similar to the improvement in the performance of the nuchal translucency for prediction of aneuploidies, the combination of PlVol with other independent risk factors increases its utility. In the previous study combining the PlVol with maternal characteristics and serum PAPP-A increased the SGA detection rate from 18% to 35% (14). How PlVol performs when combined with other serum markers for SGA, such as placental growth factor, or ultrasound markers of vascularity, such as fractional moving blood volume, remains to be seen; however, with this fully automated tool, large, multicentre studies recruiting many thousands of women can now be undertaken to investigate this. The results should demonstrate the relationship between first trimester PlVol and not only birth weight, but much less common adverse pregnancy outcomes, such as preeclampsia, placental abruption, and stillbirth. If clinical utility is proved, this real-time, operator-independent technique makes it possible to use PlVol on a large scale, potentially as part of a screening test.
Obtaining large annotated data sets is time consuming and labor intensive. By previous timing of the semiautomated RW method, annotation of the data set presented represents an estimated 168.1 hours of segmentation (mean initialization, 175 s; computation, 43.6 s; n = 2,768) by a single observer. This is usually a major stumbling block when researchers are trying to generate a ground-truth training set. However, using transfer learning, the limitation of small data sets can circumvent this by using pretrained networks. Previous work in this area has shown that fine-tuning of a pretrained model, based on Google’s Inception v3 architecture on medical data, achieved near human expert performance (16, 17). Transfer learning should allow the large data set and model presented in this work to benefit researchers in other imaging modalities. To enable application of this work to other imaging modalities or different target organs in 3D-US, our source code is freely available (18) and the pretrained models are available (see supplemental material). We hope that this will prove beneficial to this rapidly growing area of medical image analysis.
Methods
Clinical data set.
The 3D-US data were previously used in a study investigating the predictive value of PlVol, measured using the commercial VOCAL tool (General Electric Healthcare), for the detection of SGA (14). A 3D-US volume containing the placenta was recorded for 3,104 unselected singleton pregnancies at 11 + 0 to 13 + 6 weeks of gestation. These cases consisted of all the women presenting for their combined screening for aneuploidies at the Fetal Medicine Centre, London, United Kingdom, who gave their consent (19, 20). All the women went on to deliver a chromosomally normal baby at term. The 3D-US volume was acquired by transabdominal sonography using a GE Voluson 730 Expert system (GE Medical Systems) with a 3D RAB4/8L transducer (21). Of the original 3104 3D-US volumes, 336 had to be discarded, as they had been saved using wavelet compression, which results in significant loss of the underlying raw data, thereby preventing further analysis. Another 375 cases were excluded, as the volume had been collected with the gain set exceptionally high. This gain setting is inappropriate for imaging the placenta, as it removes the subtle variation in the echogenicity of tissues, resulting in a “stark,” black-and-white image appearance. It is used in clinical practice, as it makes the nuchal translucency more obvious.
The remaining 2,393 3D-US volumes were annotated using the RW algorithm, which has been described previously (13). To perform labeling, 3D B-mode data were converted from the prescan toroidal geometry GE Voluson format into a 3D Cartesian volume with isotropic 0.6-mm spacing (5). The segmentation was initialized or “seeded” by an operator (SN). These “seedings” were then examined for accuracy by a second independent operator (MM) and “reseeded” where mistakes were evident. Cases where there was uncertainty regarding the boundaries of the placenta were examined by a third operator (SLC). The “seedings” were then used to calculate the PlVol with the RW method. The final quality-control step for the ground-truth data set involved visually inspecting the segmentation of all the cases seen to be outliers in the distribution of PlVol values. This was performed by three operators (SLC, PL, and GNS). If an error was seen in the segmentation, the seeding was checked and the image was reseeded and resegmented where appropriate. The resulting 2,393 quality-controlled ground-truth segmentations were then used to train, validate, and test the models.
3D deep-learning segmentation method.
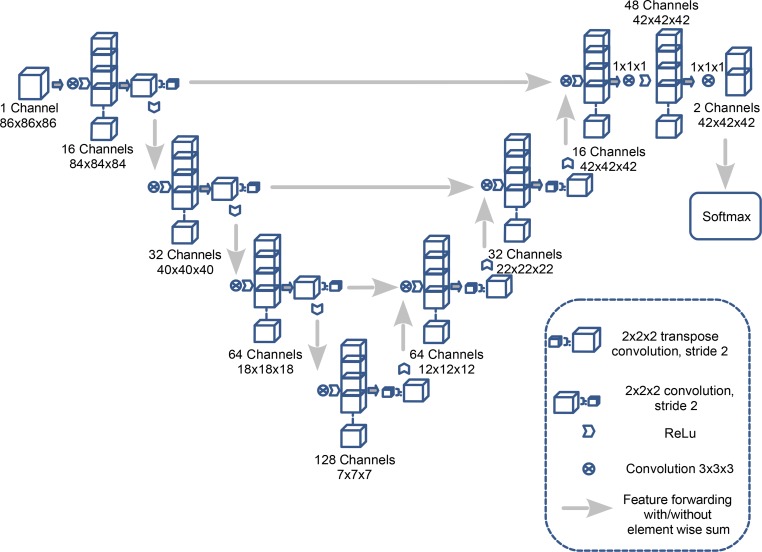
A fCNN, OxNNet, was created using the framework TensorFlow (version 1.3) using a 3D architecture inspired by a 2D U-net architecture described previously (22). The number of convolutional layers and channels used was customized and max pooling was replaced with strided convolutions (23) to accommodate the 12-Gb NVIDIA Titan X GPU (24) used for training. Figure 6 shows a full schematic of the architecture. Cross entropy was used as the loss function. The parameters — Adam optimizer learning rate, β1, β2, and ε — were set as 0.001, 0.9, 0.999, and 1 × 10⁻⁸, respectively. To reduce overfitting, dropout with probability 0.5 was applied to the final layer. A batch size of 30 was used while training the model.
Figure 6. The architecture of the OxNNet fully convolutional neural network.
The effect of training set size on the performance of the model was investigated by keeping the validation set fixed and using samples of 100, 150, 300, 600, 900, and 1,200 cases trained for 25,000 iterations throughout.
To evaluate the predictive value of PlVol segmentation, 2-fold cross-validation was performed, providing training, validation and test partitions of 1,097, 100, and 1,196 cases respectively. Each volume was normalized to have 0 mean intensity and unary variance. Masks of the ultrasound region were input to the fCNN to only consider the field of view. The fCNN was trained for 8 epochs and took 26 hours to run. Validation of the image segments was performed throughout training and a full validation of the whole image was carried out every epoch. Computation of a PlVol following training took on average 11 seconds.
Each predicted segmentation was postprocessed to remove disconnected parts of the segmentation less than 40% of the volume of the largest region. The segmentation was binary dilated and eroded using a 3D kernel of radius 3 voxels and a hole-filling filter applied. These methods removed small regions separated from the largest placental segmented regions, smoothed the boundary of the placenta, and filled any holes that were surrounded by placental tissue.
The main evaluation metric was the DSC. RVD, mean Hausdorff distance, and Hausdorff distance were also computed using the Insight Toolkit (ITK; version 4.10). The volumetric metrics for two segmentations, A and B, were defined as follows in Equations 1 and 2:
Equation 1

Equation 2

The Hausdorff distance and mean Hausdorff distance were the maximum and mean of the minimum distances, respectively, averaged between the surfaces of A and B and B and A.
Statistics.
The difference in the DSC values obtained with different data set sizes was assessed using 1-way ANOVA. The birth weight percentile for each neonate was taken from a reference range of birth weight for gestation at delivery in the population from which the data were acquired (10). A neonate was considered SGA if it was <10th percentile birth weight. The distribution of PlVol was made Gaussian by logarithmic transformation (normality was assessed using histograms and probability plots), and differences in gestational age were corrected for by expressing log PlVol as MoMs of the AGA group. The distribution of log PlVol expressed as MoMs were calculated for all cases for RW and OxNNet PlVols. Univariate logistic regression was used to build a predictive model to detect SGA by both techniques (RW and OxNNet). The performance of these models in detecting SGA was assessed by generating ROC curves. Ultrasound volumes were visualized using 3D Slicer (version 4.6) (25), R (version 3.3.2) (26) was used for data analysis, pROC (version 1.8) (27) was used for the ROC analysis, and ggplot2 (version 2.2) (28) was used for producing the graphs. Statistical significance was assumed at a P value of less than 0.05.
Study approval.
The study had full local ethical approval from King’s College Hospital Ethics Committee, London, England (ID: 02-03-033), and all participants provided written consent.
Author contributions
PL, GNS, and SLC are guarantors of the integrity of entire study. PL, GNS, KHN, WP, MM, SN, and SLC provided study concepts/study design. PL, GNS, KHN, WP, MM, SN, and SLC performed data acquisition or data analysis/interpretation. PL, GNS, KHN, WP, MM, SN, and SLC drafted or revised the manuscript for important intellectual content. PL, GNS, KHN, WP, MM, SN, and SLC approved the final version of the submitted manuscript. PL, GNS, and SLC performed literature research. WP performed clinical studies. PL, GNS, MM, SN, and SLC performed experimental studies. PL, GNS, and SLC performed statistical analysis.
Supplementary Material
Acknowledgments
The authors thank J. Alison Noble for her valuable input into the original placental imaging analysis that lead to the development of this work. We gratefully acknowledge the support of NVIDIA Corporation, with the donation of the Tesla GTX Titan X GPU used for this research. PL, SLC, and research reported in this publication were supported by the Eunice Kennedy Shriver National Institute of Child Health and Human Development Human Placenta Project of the National Institutes of Health under award UO1-HD087209. The content is solely the responsibility of the authors and does not necessarily represent the official views of the National Institutes of Health. GNS is supported by a philanthropic grant from the Leslie Stevens’ Fund, Sydney.
Version 1. 06/07/2018
Electronic publication
Footnotes
Conflict of interest: The authors have declared that no conflict of interest exists.
Reference information: JCI Insight. 2018;3(10):e120178. https://doi.org/10.1172/jci.insight.120178.
Contributor Information
Walter Plasencia, Email: walterplasencia@icloud.com.
Malid Molloholli, Email: malid.molloholli@fhft.nhs.uk.
Stavros Natsis, Email: stavrosnatsis79@gmail.com.
References
- 1. Krizhevsky A, Sutskever I, Hinton GE. ImageNet Classification with Deep Convolutional Neural Networks. Neural Information Processing Proceedings. https://papers.nips.cc/paper/4824-imagenet-classification-with-deep-convolutional-neural-networks Accessed April 25, 2018.
- 2.Litjens G, et al. A survey on deep learning in medical image analysis. Med Image Anal. 2017;42:60–88. doi: 10.1016/j.media.2017.07.005. [DOI] [PubMed] [Google Scholar]
- 3. Cerrolaza JJ, et al. Fetal Skull Segmentation in 3D Ultrasound via Structured Geodesic Random Forest. In: Cardoso G, et al, eds. Fetal, Infant and Ophthalmic Medical Image Analysis. Cham, Switzerland: Springer International Publishing; 2017:25–32. [Google Scholar]
- 4. Alansary A, et al. Fast Fully Automatic Segmentation of the Human Placenta from Motion Corrupted MRI. In: Ourselin S, Joskowicz L, Sabuncu M, Unal G, Wells W, eds. Medical Image Computing and Computer-Assisted Intervention – MICCAI 2016. Cham, Switzerland: Springer; 2016:589–597. [Google Scholar]
- 5. Looney P, et al. Automatic 3D ultrasound segmentation of the first trimester placenta using deep learning. IEEE Xplore. https://ieeexplore.ieee.org/abstract/document/7950519/ Accessed May 16, 2018.
- 6. Yang X, et al. Towards Automatic Semantic Segmentation in Volumetric Ultrasound. In: Descoteaux M, Maier-Hein L, Franz A, Jannin P, Collins D, Duchesne S, eds. Medical Image Computing and Computer Assisted Intervention − MICCAI 2017. Cham, Switzerland: Springer; 2017:711–719. [Google Scholar]
- 7.Hafner E, et al. Comparison between three-dimensional placental volume at 12 weeks and uterine artery impedance/notching at 22 weeks in screening for pregnancy-induced hypertension, pre-eclampsia and fetal growth restriction in a low-risk population. Ultrasound Obstet Gynecol. 2006;27(6):652–657. doi: 10.1002/uog.2641. [DOI] [PubMed] [Google Scholar]
- 8.Law LW, Leung TY, Sahota DS, Chan LW, Fung TY, Lau TK. Which ultrasound or biochemical markers are independent predictors of small-for-gestational age? Ultrasound Obstet Gynecol. 2009;34(3):283–287. doi: 10.1002/uog.6455. [DOI] [PubMed] [Google Scholar]
- 9.Metzenbauer M, et al. Three-dimensional ultrasound measurement of the placental volume in early pregnancy: method and correlation with biochemical placenta parameters. Placenta. 2001;22(6):602–605. doi: 10.1053/plac.2001.0684. [DOI] [PubMed] [Google Scholar]
- 10.Jones TB, Price RR, Gibbs SJ. Volumetric determination of placental and uterine growth relationships from B-mode ultrasound by serial area-volume determinations. Invest Radiol. 1981;16(2):101–106. doi: 10.1097/00004424-198103000-00005. [DOI] [PubMed] [Google Scholar]
- 11.Collins SL, Stevenson GN, Noble JA, Impey L. Rapid calculation of standardized placental volume at 11 to 13 weeks and the prediction of small for gestational age babies. Ultrasound Med Biol. 2013;39(2):253–260. doi: 10.1016/j.ultrasmedbio.2012.09.003. [DOI] [PubMed] [Google Scholar]
- 12.Farina A. Systematic review on first trimester three-dimensional placental volumetry predicting small for gestational age infants. Prenat Diagn. 2016;36(2):135–141. doi: 10.1002/pd.4754. [DOI] [PubMed] [Google Scholar]
- 13.Stevenson GN, Collins SL, Ding J, Impey L, Noble JA. 3-D ultrasound segmentation of the placenta using the random walker algorithm: reliability and agreement. Ultrasound Med Biol. 2015;41(12):3182–3193. doi: 10.1016/j.ultrasmedbio.2015.07.021. [DOI] [PubMed] [Google Scholar]
- 14.Plasencia W, Akolekar R, Dagklis T, Veduta A, Nicolaides KH. Placental volume at 11-13 weeks’ gestation in the prediction of birth weight percentile. Fetal Diagn Ther. 2011;30(1):23–28. doi: 10.1159/000324318. [DOI] [PubMed] [Google Scholar]
- 15.Kamnitsas K, et al. Efficient multi-scale 3D CNN with fully connected CRF for accurate brain lesion segmentation. Med Image Anal. 2017;36:61–78. doi: 10.1016/j.media.2016.10.004. [DOI] [PubMed] [Google Scholar]
- 16.Esteva A, et al. Dermatologist-level classification of skin cancer with deep neural networks. Nature. 2017;542(7639):115–118. doi: 10.1038/nature21056. [DOI] [PMC free article] [PubMed] [Google Scholar]
- 17.Gulshan V, et al. Development and validation of a deep learning algorithm for detection of diabetic retinopathy in retinal fundus photographs. JAMA. 2016;316(22):2402–2410. doi: 10.1001/jama.2016.17216. [DOI] [PubMed] [Google Scholar]
- 18. Looney P. OxNNet. Github. https://github.com/plooney/oxnnet/commit/fbb84cd4d100447a997455df87478aa7cc3b2498 Accessed May 16, 2018.
- 19.Kagan KO, Wright D, Baker A, Sahota D, Nicolaides KH. Screening for trisomy 21 by maternal age, fetal nuchal translucency thickness, free beta-human chorionic gonadotropin and pregnancy-associated plasma protein-A. Ultrasound Obstet Gynecol. 2008;31(6):618–624. doi: 10.1002/uog.5331. [DOI] [PubMed] [Google Scholar]
- 20.Snijders RJ, Noble P, Sebire N, Souka A, Nicolaides KH. UK multicentre project on assessment of risk of trisomy 21 by maternal age and fetal nuchal-translucency thickness at 10-14 weeks of gestation. Fetal Medicine Foundation First Trimester Screening Group. Lancet. 1998;352(9125):343–346. doi: 10.1016/S0140-6736(97)11280-6. [DOI] [PubMed] [Google Scholar]
- 21.Wegrzyn P, Faro C, Falcon O, Peralta CF, Nicolaides KH. Placental volume measured by three-dimensional ultrasound at 11 to 13 + 6 weeks of gestation: relation to chromosomal defects. Ultrasound Obstet Gynecol. 2005;26(1):28–32. doi: 10.1002/uog.1923. [DOI] [PubMed] [Google Scholar]
- 22. Ronneberger O, Fischer P, Brox T. U-Net: Convolutional Networks for Biomedical Image Segmentation. In: Navab N, Hornegger J, Wells W, Frangi A, eds. Medical Image Computing and Computer-Assisted Intervention – MICCAI 2015. Cham, Switzerland; Springer, Cham; 2015:234–241. [Google Scholar]
- 23. Milletari F, Navab N, Ahmadi SA. V-Net: Fully Convolutional Neural Networks for Volumetric Medical Image Segmentation. Poster presented at: 3D Vision (3DV), 2016 Fourth International Conference; October 25–28, 2016; Standford, CA. [Google Scholar]
- 24. Abadi M, et al. Tensorflow: Large-scale machine learning on heterogeneous distributed systems. Cornell University Library. https://arxiv.org/abs/1603.04467 Published March 14, 2016. Updated March 16, 2016. Accessed April 24, 2018.
- 25.Fedorov A, et al. 3D Slicer as an image computing platform for the Quantitative Imaging Network. Magn Reson Imaging. 2012;30(9):1323–1341. doi: 10.1016/j.mri.2012.05.001. [DOI] [PMC free article] [PubMed] [Google Scholar]
- 26. R Core Team. R: A language and environment for statistical computing. R Foundation for Statistical Computing, Vienna, Austria. http://www.R-project.org/ Accessed April 25, 2018.
- 27.Robin X, et al. pROC: an open-source package for R and S+ to analyze and compare ROC curves. BMC Bioinformatics. 2011;12:77. doi: 10.1186/1471-2105-12-77. [DOI] [PMC free article] [PubMed] [Google Scholar]
- 28. Wickham H. ggplot2: Elegant Graphics for Data Analysis. New York, NY: Springer; 2016. [Google Scholar]
Associated Data
This section collects any data citations, data availability statements, or supplementary materials included in this article.


