Abstract
BACKGROUND. Immune checkpoint inhibitors provide significant clinical benefit to a subset of patients, but novel prognostic markers are needed to predict which patients will respond. This study was initiated to determine if features of patient T cell repertoires could provide insights into the mechanisms of immunotherapy, while also predicting outcomes.
METHODS. We examined T cell receptor (TCR) repertoires in peripheral blood of 25 metastatic pancreatic cancer patients treated with ipilimumab with or without GVAX (a pancreatic cancer vaccine), as well as peripheral blood and tumor biopsies from 32 patients treated with GVAX and mesothelin-expressing Listeria monocytogenes with or without nivolumab. Statistics from these repertoires were then tested for their association with clinical response and treatment group.
RESULTS. We demonstrate that, first, the majority of patients receiving these treatments experience a net diversification of their peripheral TCR repertoires. Second, patients receiving ipilimumab experienced larger changes in their repertoires, especially in combination with GVAX. Finally, both a low baseline clonality and a high number of expanded clones following treatment were associated with significantly longer survival in patients who received ipilimumab but not in patients receiving nivolumab.
CONCLUSIONS. We show that these therapies have measurably different effects on the peripheral repertoire, consistent with their mechanisms of action, and demonstrate the potential for TCR repertoire profiling to serve as a biomarker of clinical response in pancreatic cancer patients receiving immunotherapy. In addition, our results suggest testing sequential administration of anti–CTLA-4 and anti–PD-1 antibodies to achieve optimal therapeutic benefit.
TRIAL REGISTRATION. Samples used in this study were collected from the NCT00836407 and NCT02243371 clinical trials.
FUNDING. Research supported by a Stand Up To Cancer Lustgarten Foundation Pancreatic Cancer Convergence Dream Team Translational Research grant (SU2C-AACR-DT14-14). Stand Up To Cancer is a program of the Entertainment Industry Foundation administered by the American Association for Cancer Research (AACR). Additional clinical trial funding was provided by AACR-Pancreatic Cancer Action Network Research Acceleration Network grant (14-90-25-LE), NCI SPORE in GI Cancer (CA062924), Quick-Trials for Novel Cancer Therapies: Exploratory Grants (R21CA126058-01A2), and the US Food and Drug Administration (R01FD004819). Research collaboration and financial support were provided by Adaptive Biotechnologies.
Keywords: Immunology, Oncology
Keywords: Cancer immunotherapy, T-cell receptor
TCR repertoire profiling may serve as a potential biomarker of clinical response in pancreatic cancer patients receiving immunotherapy.
Introduction
Cancer immunotherapy has succeeded in providing unprecedented clinical benefit to a subset of patients with many cancer types, including melanoma (1) and non–small cell lung cancer (2), while failing in others. Current US Food and Drug Administration–approved (FDA-approved) approaches involve blocking the function of 2 important molecules for T cell suppression, CTLA-4 and PD-1. In the majority of advanced cancer patients, however, these approaches fail to work as monotherapies, and high relapse rates exist following successful treatments (3).
In particular, single-agent immunotherapy has failed to significantly reduce the mortality rate of pancreatic ductal adenocarcinoma (PDA), in part due to its low mutation rate (4), low infiltration of quality T cells, and unique immunosuppressive microenvironment (5). To overcome these obstacles and induce an antitumor T cell response, recent trials have combined GVAX (an allogeneic whole cell vaccine, composed of 2 cell lines genetically modified to secrete granulocyte macrophage CSF) with immune checkpoint inhibitors ipilimumab (6) (targeting CTLA-4) or nivolumab (7) (targeting PD-1), as well as CRS-207, a strain of Listeria monocytogenes expressing the cancer antigen mesothelin (8).
CTLA-4 is expressed on CD4+ and CD8+ T cells, and it inhibits T cell activation by competitively inhibiting the CD28 costimulatory receptor. Inhibition of CTLA-4 allows peripheral T cells to more easily be activated by antigen presenting cells (APCs). PD-1, while also expressed by T cells, acts in a temporally and spatially distinct manner. When bound to its tumor-expressed ligand (PD-L1 or PD-L2), PD-1 prevents CD8+ T cells from engaging with the target cell. Inhibition of this pathway allows preexisting and properly localized antitumor T cells to engage and destroy their target cells. Understanding the mechanisms by which some patients respond to these therapies while others do not is critical to improving the efficacy of cancer immunotherapy. Additionally, the development of biomarkers for clinical response to these therapies will also be imperative for efforts to improve treatment efficacy.
The development of high-throughput T cell receptor Vβ sequencing (HTTCS) has allowed the identification and temporal monitoring of clones with high sensitivity (9). Immunotherapy trials in melanoma patients showed that inhibition of CTLA-4 leads to a broadening of the T cell receptor (TCR) repertoire; however, this expansion was also correlated with increased toxicity (10). TCR repertoire studies of patients treated with anti–PD-1 have focused primarily on the tumor repertoire, rather than the peripheral repertoire, due to the mechanism of action of anti–PD-1. Clinical responders have been shown to have a greater number of expanded clones, as well as increased repertoire clonality among tumor-infiltrating lymphocytes (11).
In the current study, we analyze the peripheral TCR repertoires of 25 patients treated with ipilimumab with or without GVAX, and of 32 patients treated with GVAX and CRS-207 with or without nivolumab. In the latter trial, we also examine pre- and posttreatment tumor biopsies of a subset of 9 patients. The results demonstrate that HTTCS can identify changes in the repertoire associated with each treatment arm and help identify likely responders using pretreatment blood samples.
Results
Differing effects of CTLA-4 and PD-1 blockade on the peripheral TCR repertoires of PDA patients.
Preclinical data suggest that the CTLA-4 and PD-1 pathways play different roles in controlling T cell activation. Until recently, few studies were available to evaluate differences in how these pathways function in patients. We recently completed 2 clinical trials in which metastatic PDA patients were treated with either ipilimumab (anti–CTLA-4) or nivolumab (anti–PD-1), both in combination with a PDA vaccine. In both studies, enhanced T cell responses and, to a lesser extent, clinical responses were observed (6). To elucidate potential mechanisms by which each agent may be potentiating the activity of vaccine-induced T cells, we utilized an emerging TCR sequencing approach.
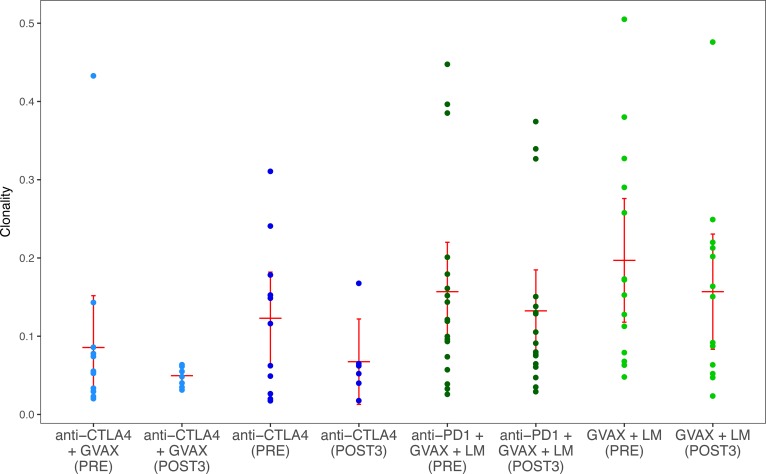
In order to characterize the effects of the individual immunotherapy treatments on the TCR repertoire, we first compared the clonality of repertoires isolated from patients in each arm before and after treatment. At baseline, patients on the anti–PD-1 trial had more clonal repertoires than patients on the anti–CTLA-4 trial (P < 0.01), making cross-study comparisons difficult. No significant differences were observed between pre- and posttreatment clonality in any arm, and clonality appeared unchanged between arms of each study (Figure 1).
Figure 1. Sample clonality of all patients separated by arm and time point.
Anti–CTLA-4 study patients are shown in blue; anti–PD-1 study patients are shown in green. Red bars represent the mean and 95% confidence interval.
In order to assess the change in repertoire clonality experienced by each patient and normalize across studies, we next examined the fold change in clonality. Thirty-one of the 45 patients (68.9%) with posttreatment time points available experienced a diversification of the repertoire following treatment (indicated by a reduction in clonality); however, no significant changes were observed between treatment arms in either study or between the 2 studies (Supplemental Figure 1; supplemental material available online with this article; https://doi.org/10.1172/jci.insight.122092DS1).
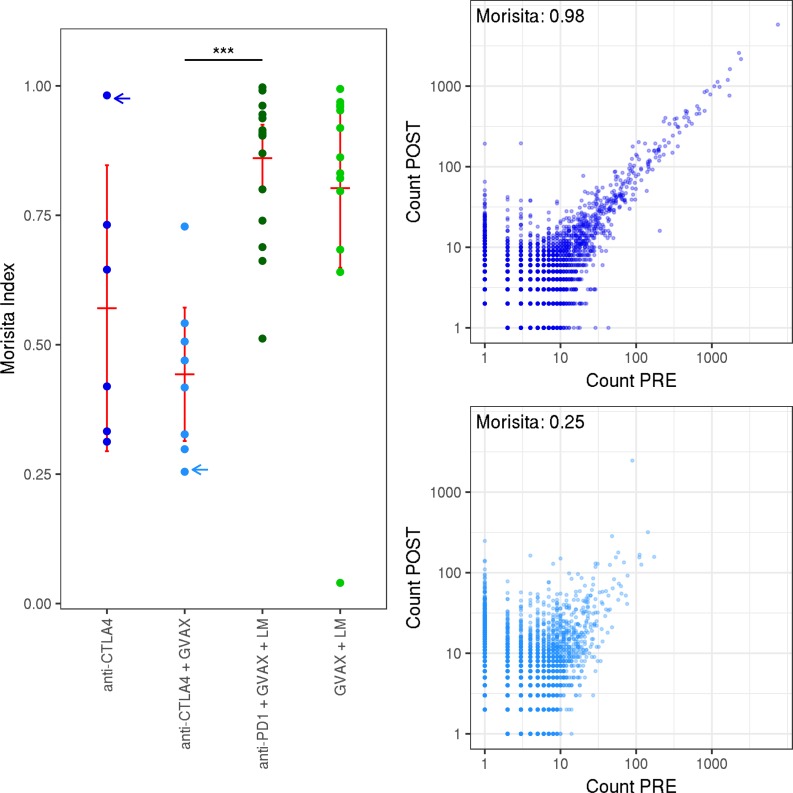
To better understand the TCR repertoire dynamics associated with each treatment, we utilized the Morisita distance, a robust metric of similarity between pre- and posttreatment repertoires. Among vaccine-treated patients, those receiving anti–CTLA-4 had significantly lower similarity than those who received anti–PD-1, indicating a larger change in the repertoire (P < 5 × 10⁻⁵). Patients receiving anti–CTLA-4 with vaccine experienced the largest changes (Figure 2).
Figure 2. Overlap between pre- and posttreatment samples.
Left: the Morisita distance between pre- and posttreatment; 3 samples for each patient. Patients are separated by treatment arm. Right: scatter plots showing the abundance of each clone before and after treatment, from 2 representative patients with low (bottom) and high (top) Morisita index. Blue arrows indicate which repertoires are shown to the right. Red bars represent mean and 95% CI. A Wilcoxon signed-rank test was used to assess significance. ***P < 0.00005.
TCR repertoire features correlate with overall survival.
Due to the stringency of RECIST and the immune-related response criteria (irRC) in the pancreatic cancer population, we were unable to define a sufficient number of patients as responders to initiate a statistical analysis of the correlation between TCR repertoire features and radiographic responses. We chose, instead, to use a survival cutoff of 6 months to define long-term survivors (LTS; >6 month overall survival) and short-term survivors (STS; <6 month overall survival). This method allowed reasonable group sizes when all patients in each study were grouped as either LTS or STS (anti–CTLA-4 study, n = 10 [LTS] and n = 15 [STS]; anti–PD-1 study, n = 19 [LTS] and n = 13 [STS]).
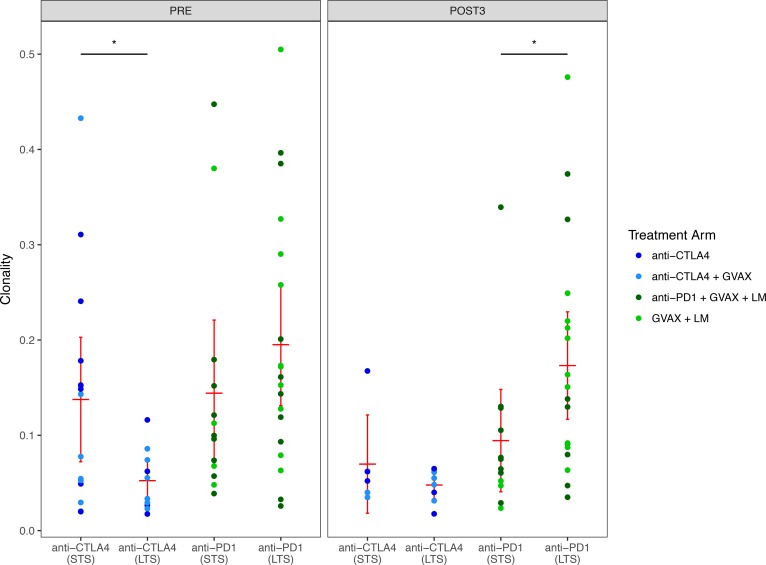
We first analyzed the clonality of each patient before and after treatment. LTS had significantly lower baseline clonality than STS in the anti–CTLA-4 study (P < 0.05, Figure 3). LTS in the anti–PD-1 study had similar baseline clonalities; however, significantly higher clonalities were observed in LTS following 3 cycles of treatment (P < 0.05, Figure 3).
Figure 3. The sample clonality of patients separated by study and response.
The left panel shows pretreatment samples; the right panel shows posttreatment samples. Red bars represent mean and 95% CI. A Wilcoxon signed-rank test was used to assess significance. *P < 0.05.
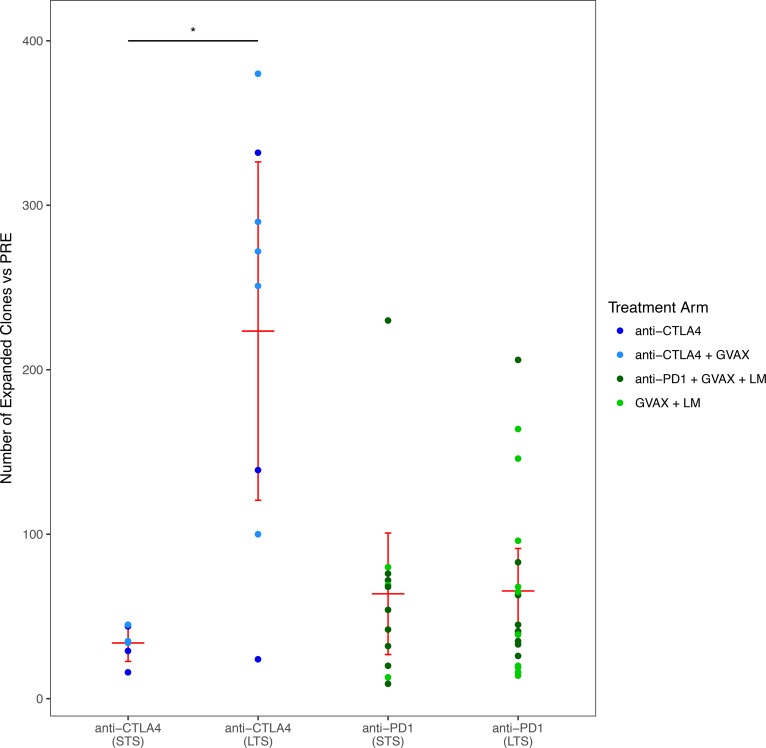
To address clone level changes in the TCR repertoire that may be missed by analysis of repertoire clonality, we next counted the number of clones that significantly expanded after treatment. Anti–CTLA-4 LTS exhibited significantly more expanded clones when compared with STS (P < 0.05). This was not observable in patients treated in the anti–PD-1 study (Figure 4). The absolute number of TCRs analyzed, as well as the number of unique clones identified (richness), did not differ significantly between LTS and STS. However, to be sure that these factors did not influence the number of expanded clones identified, we examined the number of expanded clones relative to the number of total TCR sequences. The results of this normalized analysis confirmed the observations made using the absolute number of expanded clones (data not shown).
Figure 4. Number of expanded clones in patients separated by study and response.
The number of clones significantly expanded from baseline to posttreatment in all patients, separated by clinical response and study. Red bars represent mean and 95% CI. A Wilcoxon signed-rank test was used to assess significance. *P < 0.05.
Because PD-1 blockade affects T cells already localized to the tumor, we analyzed the tumor repertoires of the subset of anti–PD-1 patients for which pre- and posttreatment biopsies were available (n = 12). We observed no significant difference associated with clinical response (n = 8 LTS) or treatment arm (n = 9 in the PD-1 arm) in either the clonality or richness of the repertoires (data not shown).
TCR repertoire metrics predict clinical response.
To investigate whether changes in TCR metrics can serve as prognostic markers in patients treated with anti–CTLA-4 therapy, we stratified patients using baseline clonality and number of expanded clones. We used a cutoff of 0.1 to stratify repertoires as diverse (clonality <0.1) or clonal (>0.1) and a cutoff of 100 to stratify patients by number of expanded clones, high (>100) or low (<100).
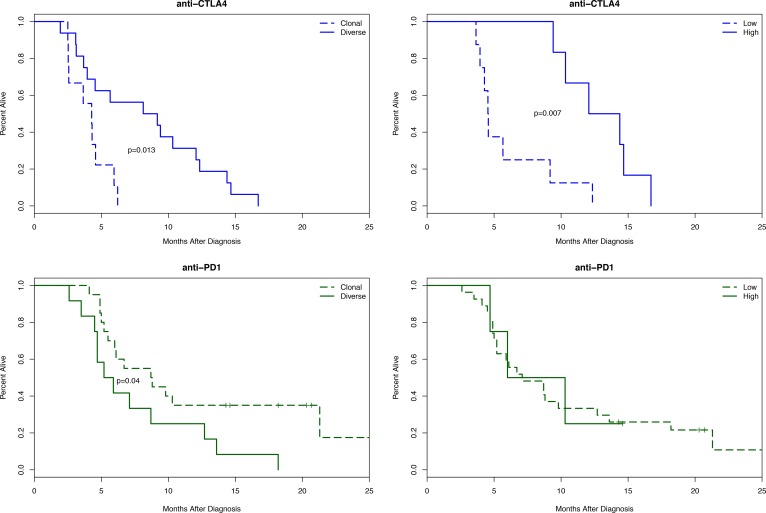
The results demonstrated that patients receiving anti–CTLA-4 who had diverse baseline TCR repertoires (n = 16) survived twice as long as patients with clonal repertoires (n = 9), with median survivals of 8.66 and 4.28 months, respectively (P < 0.05). Patients on this study with more than 100 clones expanded after treatment (n = 6) survived nearly 3 times longer than patients with fewer clones expanded (n = 8), with median survivals of 13.23 and 4.55 months, respectively (P < 0.01, Figure 5). The same stratification strategy was unsuccessful when applied to patients on the anti–PD-1 study.
Figure 5. Kaplan-Meier survival curves for patients on the anti–CTLA-4 study (top, in blue) or the anti–PD-1 study (bottom, green).
In the left column, patients are separated by clonality status (<0.1, diverse; >0.1, clonal). In the right column, patients are separated by high (>100) or low (<100) number of expanded clones. A likelihood ratio test was used to assess significance.
Patients with diverse baseline TCR repertoires (n = 12) had a slightly lower median survival to patients with clonal repertoires (n = 20): 5.55 and 8.75 months, respectively (P < 0.05). Likewise, patients with more expanded clones following treatment (n = 4) had similar median survival to patients with fewer (n = 27), at 8.15 and 7.10 months, respectively.
To address the possibility that the TCR repertoire metrics were simply a reflection of lymphocyte abundance, we stratified patients using their baseline absolute lymphocyte count (ALC). In the anti–CTLA-4 study, no difference was observed between patients with ALC >1,000 (n = 16; median survival, 5.10 months) and patients with ALC <1,000 (n = 9; median survival, 4.57). Patients on the anti–PD-1 study with ALC >1,000 (n = 24; median survival, 8.70 months) had a slight but not significant survival advantage compared with patients with ALC <1,000 (n = 8; median survival, 4.95 months; Supplemental Figure 2).
Discussion
Immune checkpoint inhibitors that block 2 specific T cell regulatory pathways, PD-1 and CTLA-4, can cause significant responses in some patients with advanced cancers. These responses are often very durable, lasting years in patients who had few or no other treatment options. However, these agents only work well in some patients, while most patients fail to respond. As the field develops increasing numbers of checkpoint agents and combinations that have potential efficacy, as well as potentially serious side effects, biomarkers will be needed to identify patients most likely to respond.
Using TCR repertoire analysis conducted on specimens from 2 immunotherapy trials, we show that a subpopulation of LTS to anti–CTLA-4 therapy can be identified before treatment begins using repertoire clonality. Measuring the number of T cell clones that expand following the first 3 treatments further improves this prediction. Additionally, we demonstrate that the repertoire change induced by anti–CTLA-4 therapy is large enough to be measured using HTTCS, while the magnitude of change induced by anti–PD-1 therapy in the periphery is much smaller. These findings suggest that features of the TCR repertoire can be used as biomarkers to predict clinical responses to immunotherapy in PDA patients. Because checkpoint inhibitors act on the immune compartment rather than tumor cells directly, it is likely that the same features of the TCR repertoire that predict response in PDA patients should be generalizable to most patients who are eligible for anti–CTLA-4 treatment.
Previous work by Robert et al. (12) demonstrated different effects of PD-1 and CTLA-4 inhibition on the peripheral TCR repertoire of melanoma patients, and our results extend these findings to PDA patients. Because PD-1 inhibition occurs on previously primed tumor-infiltrating lymphocytes, more modest effects on the peripheral repertoire are expected in this context.
Unlike studies in melanoma (11), we observed no difference in the repertoire of tumor-infiltrating lymphocytes between anti–PD-1 LTS and STS. The relatively small number of patients with tumor sections available from this trial, combined with comparatively low T cell infiltration in PDA tumors, complicated this analysis. Repertoire profiles from an expanded PDA cohort may still confirm the findings made in anti–PD-1–treated melanoma patients. We did show that peripheral repertoires in LTS were more clonal after treatment than those of STS, consistent with clonal expansion of tumor-infiltrating and vaccine-induced antigen-specific T cells.
Our results demonstrate a clear association between repertoire diversity and overall survival in patients receiving ipilimumab. The large effect of this and other CTLA-4 inhibitors on the peripheral repertoire has been described previously (10, 13, 14) in melanoma and prostate cancer; however, the association of TCR repertoire metrics with clinical outcomes in these studies yielded mixed results. In one trial of a nonimmunotherapy intervention in breast cancer, low TCR diversity was associated with poor survival (15), indicating that — in some therapeutic contexts — these methods may find use outside of immunotherapy.
Finally, this analysis demonstrated that in PDA tumors, classically considered to be immunologically suppressed, large shifts in the T cell repertoire can be measured and used to predict clinical outcomes. Additional prospective studies are required to validate clonality and clone expansion as predictors of clinical outcome in anti–CTLA-4 studies and in the context of other immunotherapies. This study also provides the rationale to consider anti–CTLA-4 as an initial therapy for T cell priming and anti–PD-1 as a requirement for T cell expansion and maintenance. Many new combination therapies are in development, and TCR repertoire analysis should be studied as a biomarker of response and used to further elucidate the mechanisms of successful treatment.
Methods
Clinical trials.
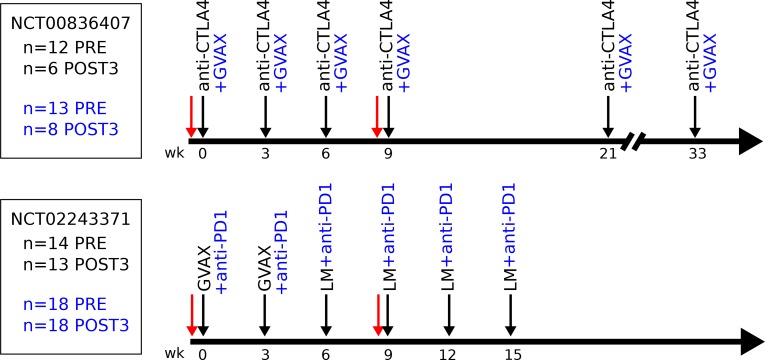
Details of the NCT00836407 clinical trial have been described previously (6). Briefly, patients eligible for enrollment had metastatic or locally advanced, histologically proven PDA that was previously treated with gemcitabine-based chemotherapy. Patients who had received prior therapy with anti–CTLA-4 were excluded. Once enrolled, patients were randomized and received 10 mg/kg ipilimumab (Bristol-Myers Squibb) only (arm 1, n = 12 patients) or 10 mg/kg ipilimumab and GVAX (arm 2, n = 13) every 3 weeks for 4 cycles, followed by maintenance dosing (Figure 6).
Figure 6. Timeline of the NCT00836407 (top) and NCT02243371 (bottom) clinical trials.
Black arrows indicate treatments. Red arrows indicate blood draws used in this study. Black text indicates treatments received by patients in both arms; blue text represents only patients in the combination arm. Numbers at left indicate the number of samples analyzed for each time point, arm, and study. LM, Listeria monocytogenes.
Patients enrolled in the NCT02243371 clinical trial (16) received cyclophosphamide and 2 doses of GVAX, followed by 4 doses of CRS-207, a strain of Listeria monocytogenes targeting mesothelin expressing tumors (arm 2, n = 14). Patients in arm 1 of this study were also administered 3 mg/kg nivolumab (Bristol-Myers Squibb) with all treatments (n = 18, Figure 6).
For the present analysis of both studies, baseline samples collected before the initial treatment (PRE), as well as after the third cycle (POST3), were used for analysis. Both studies enrolled patients with advanced disease, and not all patients survived to the third cycle of treatment. In total, POST3 samples were analyzed from 14 patients on the anti–CTLA-4 study (n = 6 [arm 1], n = 8 [arm 2]) and 31 patients on the anti–PD-1 study (n = 18 [arm 1], n = 13 [arm 2])
Sample preparation.
Samples were processed as previously described (17). Briefly, blood was collected in 60 ml heparin-coated syringes (Becton Dickinson). Peripheral blood mononuclear cells (PBMC) were isolated by Ficoll (GE Healthcare) separation, washed in media, frozen in 10% DMSO (Sigma-Aldrich), and stored in liquid nitrogen until testing. For each patient, PBMC samples were thawed and frozen as a cell pellet, assuring that the same number of cells was sent for each time point. Samples were sequenced using the immunoSeq assay (9) (Adaptive Biotechnologies) at the deep sequencing level.
Tumor biopsies were formalin fixed and paraffin embedded at the time of biopsy. H&E-stained slides were examined to verify tumor purity. Ten tissue sections (10 μm) were cut and sequenced using the immunoSeq assay at the survey sequencing depth. Any sample with fewer than 100 estimated T cells present was discarded for this analysis.
TCR repertoire analysis.
Sample clonality is based on the normalized Shannon Entropy (18), and is computed as
(Equation 1),
where pi is the proportion of the ith clone, in a population with n clones. For paired pre- and posttreatment samples, the normalized change in clonality was calculated as the base 2 logarithm of the ratio of the posttreatment clonality to the pretreatment clonality.
The Morisita distance was calculated as
(Equation 2)
where Dx represents the Simpson’s Diversity Index of sample x, nx represents the Richness of sample x, and xi represents the abundance of the ith clone in sample x (and the same for sample y). The Simpsons Index is calculated as
(Equation 3),
where pi is the proportion of the ith clone in a population with n clones.
Statistics.
A Fisher Exact test was used to identify significantly expanded clones between pre- and posttreatment samples as previously described (19). All metrics were compared across sample groups using a nonparametric Wilcoxon signed-rank test. Graphs comparing metrics across groups show the mean and 95% CI for the mean, assuming a normal distribution. The functions and scripts used to process the data are available in the tcrSeqR package for the R programming language (https://github.com/ahopki14/tcrSeqR).
Survival curves are displayed using the Kaplan-Meier method. To assess significance, Cox proportional hazard models were fit using either pretreatment repertoire clonality (diverse or clonal) or number of expanded clones (high or low). A likelihood ratio test was used to compute the P value.
Study approval.
Human studies were approved by the Johns Hopkins IRB, and all subjects provided informed consent prior to participation.
Author contributions
The clinical trials were designed and performed by DTL, DAL and EMJ. Clinical data was collected and managed by JND and DTL. Experimental design was performed by ACH, ERL, MY, EMJ, ECY, JAR and HSR. Data analysis and writing were performed by ACH and ERL.
Supplementary Material
Acknowledgments
Elizabeth Jaffee is The Dana and Albert “Cubby” Broccoli Professor of Oncology at Johns Hopkins.
Version 1. 07/12/2018
Electronic publication
Footnotes
ERL’s present address is: WindMIL Therapeutics, Baltimore, Maryland, USA.
Conflict of interest: EMJ receives research funding from Bristol-Myers Squibb and Aduro Biotech, is on the advisory board for Genocea Biosciences, and has the potential to receive royalties from Aduro Biotech. DTL receives research funding from Bristol-Myers Squibb, Merck, and Aduro Biotech; is on advisory boards for Bristol-Myers Squibb and Merck; and received a speaker honorarium from Merck. MY receives research grants from Bristol-Myers Squibb, Merck, and Exelixis. HSR has consultancy, equity, ownership, multiple patents (RU Patent No. 2539032; US Patent No. 9181590, and more), and royalties with Adaptive Biotechnologies. ECY and JAR have employment and equity with Adaptive Biotechnologies.
Reference information: JCI Insight. 2018;3(13):e122092. https://doi.org/10.1172/jci.insight.122092.
References
- 1.Robert C, et al. Pembrolizumab versus Ipilimumab in Advanced Melanoma. N Engl J Med. 2015;372(26):2521–2532. doi: 10.1056/NEJMoa1503093. [DOI] [PubMed] [Google Scholar]
- 2.Rizvi NA, et al. Activity and safety of nivolumab, an anti-PD-1 immune checkpoint inhibitor, for patients with advanced, refractory squamous non-small-cell lung cancer (CheckMate 063): a phase 2, single-arm trial. Lancet Oncol. 2015;16(3):257–265. doi: 10.1016/S1470-2045(15)70054-9. [DOI] [PMC free article] [PubMed] [Google Scholar]
- 3.Sharma P, Hu-Lieskovan S, Wargo JA, Ribas A. Primary, Adaptive, and Acquired Resistance to Cancer Immunotherapy. Cell. 2017;168(4):707–723. doi: 10.1016/j.cell.2017.01.017. [DOI] [PMC free article] [PubMed] [Google Scholar]
- 4.Jones S, et al. Core signaling pathways in human pancreatic cancers revealed by global genomic analyses. Science. 2008;321(5897):1801–1806. doi: 10.1126/science.1164368. [DOI] [PMC free article] [PubMed] [Google Scholar]
- 5.Clark CE, Beatty GL, Vonderheide RH. Immunosurveillance of pancreatic adenocarcinoma: insights from genetically engineered mouse models of cancer. Cancer Lett. 2009;279(1):1–7. doi: 10.1016/j.canlet.2008.09.037. [DOI] [PubMed] [Google Scholar]
- 6.Le DT, et al. Evaluation of ipilimumab in combination with allogeneic pancreatic tumor cells transfected with a GM-CSF gene in previously treated pancreatic cancer. J Immunother. 2013;36(7):382–389. doi: 10.1097/CJI.0b013e31829fb7a2. [DOI] [PMC free article] [PubMed] [Google Scholar]
- 7.Soares KC, et al. PD-1/PD-L1 blockade together with vaccine therapy facilitates effector T-cell infiltration into pancreatic tumors. J Immunother. 2015;38(1):1–11. doi: 10.1097/CJI.0000000000000062. [DOI] [PMC free article] [PubMed] [Google Scholar]
- 8.Le DT, et al. Safety and survival with GVAX pancreas prime and Listeria Monocytogenes-expressing mesothelin (CRS-207) boost vaccines for metastatic pancreatic cancer. J Clin Oncol. 2015;33(12):1325–1333. doi: 10.1200/JCO.2014.57.4244. [DOI] [PMC free article] [PubMed] [Google Scholar]
- 9.Robins HS, et al. Comprehensive assessment of T-cell receptor beta-chain diversity in alphabeta T cells. Blood. 2009;114(19):4099–4107. doi: 10.1182/blood-2009-04-217604. [DOI] [PMC free article] [PubMed] [Google Scholar]
- 10.Robert L, et al. CTLA4 blockade broadens the peripheral T-cell receptor repertoire. Clin Cancer Res. 2014;20(9):2424–2432. doi: 10.1158/1078-0432.CCR-13-2648. [DOI] [PMC free article] [PubMed] [Google Scholar]
- 11.Tumeh PC, et al. PD-1 blockade induces responses by inhibiting adaptive immune resistance. Nature. 2014;515(7528):568–571. doi: 10.1038/nature13954. [DOI] [PMC free article] [PubMed] [Google Scholar]
- 12.Robert L, et al. Distinct immunological mechanisms of CTLA-4 and PD-1 blockade revealed by analyzing TCR usage in blood lymphocytes. Oncoimmunology. 2014;3:e29244. doi: 10.4161/onci.29244. [DOI] [PMC free article] [PubMed] [Google Scholar]
- 13.Cha E, et al. Improved survival with T cell clonotype stability after anti-CTLA-4 treatment in cancer patients. Sci Transl Med. 2014;6(238):238ra70. doi: 10.1126/scitranslmed.3008211. [DOI] [PMC free article] [PubMed] [Google Scholar]
- 14.Postow MA, et al. Peripheral T cell receptor diversity is associated with clinical outcomes following ipilimumab treatment in metastatic melanoma. J Immunother Cancer. 2015;3:23. doi: 10.1186/s40425-015-0070-4. [DOI] [PMC free article] [PubMed] [Google Scholar]
- 15.Manuel M, et al. Lymphopenia combined with low TCR diversity (divpenia) predicts poor overall survival in metastatic breast cancer patients. Oncoimmunology. 2012;1(4):432–440. doi: 10.4161/onci.19545. [DOI] [PMC free article] [PubMed] [Google Scholar]
- 16.Le DT, et al. Randomized Phase II Study of the Safety, Efficacy, and Immune Response of GVAX Pancreas Vaccine (with Cyclophosphamide) and CRS-207 with or without Nivolumab in Patients with Previously Treated Metastatic Pancreatic Adenocarcinoma (STELLAR) J Clin Oncol. 2015;33(15_suppl):TPS4148 [Google Scholar]
- 17.Le DT, Jaffee EM. Harnessing immune responses in the tumor microenvironment: all signals needed. Clin Cancer Res. 2013;19(22):6061–6063. doi: 10.1158/1078-0432.CCR-13-2424. [DOI] [PMC free article] [PubMed] [Google Scholar]
- 18.CE Shannon A Mathematical Theory of Communication. Bell Syst Tech J. 1948;27:379–423. doi: 10.1002/j.1538-7305.1948.tb01338.x. [DOI] [Google Scholar]
- 19.DeWitt WS, et al. Dynamics of the cytotoxic T cell response to a model of acute viral infection. J Virol. 2015;89(8):4517–4526. doi: 10.1128/JVI.03474-14. [DOI] [PMC free article] [PubMed] [Google Scholar]
Associated Data
This section collects any data citations, data availability statements, or supplementary materials included in this article.


