Abstract
Numerous studies of relatively few patients have linked T cell receptor (TCR) genes to psoriasis but have yielded dramatically conflicting results. To resolve these discrepancies, we have chosen to mine RNA-Seq datasets for patterns of TCR gene segment usage in psoriasis. A meta-analysis of 3 existing and 1 unpublished datasets revealed a statistically significant link between the relative expression of TRAJ23 and psoriasis and the psoriasis-associated cytokine IL-17A. TRGV5, a TCR-γ segment, was also associated with psoriasis but correlated instead with IL-36A, other IL-36 family members, and IL-17C (not IL-17A). In contrast, TRAJ39 was strongly associated with healthy skin. T cell diversity measurements and analysis of CDR3 sequences were also conducted, revealing no psoriasis-associated public CDR3 sequences. Finally, in comparison with the expression of TCR-αβ genes, the expression of TCR-γδ genes was relatively low but mildly elevated in psoriatic skin. These results have implications for the development of targeted therapies for psoriasis and other autoimmune diseases. Also, the techniques employed in this study have applications in other fields, such as cancer immunology and infectious disease.
Keywords: Dermatology, Genetics
Keywords: T cells
A meta-analysis of three existing and one newly acquired datasets revealed a statistically significant link between the relative expression of TRAJ23 and psoriasis and the psoriasis-associated cytokine IL17A.
Introduction
Since the demonstrated efficacy of cyclosporine in psoriasis (1), αβ T cells have been thought to be central to psoriasis pathophysiology, and recent clinical evidence points to the Th17 and Tc17 subtypes as the driver of disease (2, 3), as is evident by the success of IL-17/IL-23–targeted therapies (4–9). However, many groups are pursuing other sources of IL-17 as important mediators of the psoriatic phenotype. For example, some investigators have posited that, in psoriasis, γδ T cells are expanded disproportionately more than αβ T cells and that the former is the dominant source of IL-17 (10–12). Among the γδ T cells studied, a special emphasis has been placed on skin-homing γ9δ2 T cells (13). Similarly, a variety of different T cell receptor–αβ (TCR-αβ) gene segments have also been proposed as being disproportionately overrepresented in psoriasis (14–16). These highly conflicting results may be due to the exceedingly small sample sizes used in these prior studies, which for the most part lacked summary statistics to evaluate the significance of the psoriasis-associated TCR gene usage. Here, we have applied a new approach to mine the human skin transcriptome for evidence on how the αβ and γδ T cell responses differ from one another and to identify psoriasis-associated patterns of TCR gene usage. Unlike prior studies, our results are validated in 4 independently collected datasets.
TCRs are encoded by productive rearrangements of the αβ or γδ TCR genes. For the β and δ chains, the genetic recombination events involve variable (V), diversity (D), joining (J), and constant (C) region exons. To prevent aberrant expression, TCR genes are rearranged in a specific sequence such that an αβ T cell cannot coexpress a γδ receptor. This is ensured by the splicing out of the δ locus (TRG) in αβ T cells, making it possible for only an unpaired γ chain (often nonproductive) to be transcribed in αβ T cells. For this reason, T cell receptor δ locus (TRD) correlations are more informative when searching for connections between γδ T cells and immunogenes of interest.
Traditionally, T cell repertoire analysis is conducted using a dedicated PCR amplification of the TCR complementarity determining region 3 (CDR3). The CDR3 region is the most diverse region of the TCR and the most important region in antigen recognition. It is encoded at the V(D)J junction within functionally rearranged TCR-β and -δ genes. This technique has been used to characterize psoriatic T cell responses (14–16) — albeit yielding conflicting results, possibly owing to their small sample sizes. Another issue is that many of the prior studies used genomic DNA (gDNA) as a starting template (17–25). Genomic-based TCR repertoire analysis methods cannot accurately detect nontraditionally rearranged TCR genes and suffer from primers binding to nonrearranged TCR genes, which act as an inhibitory sink (26), reducing the sensitivity of gDNA-based methods.
TCR mining of RNA sequencing (RNA-Seq) datasets is an alternative approach to characterize T cell repertoires but requires the use of an appropriate bioinformatics alignment pipeline (27). Herein, we developed and validated a pipeline to estimate the overall and relative expression of TCR V/J/C segments. Our method has the advantage over traditional TCR repertoire analysis in that it allows investigators to conduct correlative studies between TCR genes and other genes of interest; this is because it detects all TCR-mapping reads in an RNA-Seq dataset. In contrast, bioinformatics tools focused solely on analysis of the TCR CDR3 region cannot accurately estimate TCR gene segment usage, and CDR3 mapping only yields a small handful of reads per RNA-Seq dataset, making correlative studies difficult. Also, traditional RNA-Seq analysis pipelines are not aware of TCR rearrangements and may not take into account reads within the CDR3 region, considering them low-quality mapping reads.
Here, we mined RNA-Seq datasets (both published and unpublished) for TCR sequences within the transcriptomes of lesional (135 samples), paired lesional/nonlesional (75 patients), and healthy control (133 samples) biopsy specimens. One atopic dermatitis sample set (21 patients) was also used as an additional control. This allowed us to not only identify potentially novel psoriasis-associated TCR gene segments, but also correlate the transcription of individual αβ and γδ gene segments with genes of known importance to the pathophysiology of psoriasis. Four independently acquired RNA-Seq sample sets allowed for rigorous statistical validation of our results. Finally, meta-analyses were conducted to assess these findings across the multiple datasets. This study sheds insight into how the infiltrating αβ T cell response differs from the γδ T cell response in patients with psoriasis. This same strategy can be applied to other autoimmune and cancer datasets and, thus, carries wide applications.
Results
Validation of methods used to analyze TCR reads from RNA-Seq datasets.
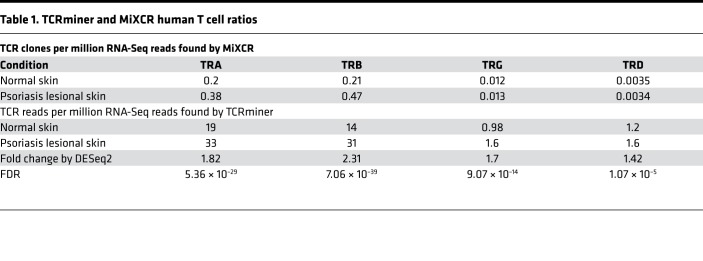
Prior to analyzing the psoriasis datasets, we first validated our bioinformatics methods using an in silico–constructed TCR RNA-Seq dataset. To provide an accurate estimation of TCR expression level, we mapped RNA-Seq reads against individual TCR segment sequences obtained from the IMGT database (28) using bwa-mem software (29). For simplicity, we call this method of TCR analysis TCRminer. RNA-Seq datasets of human skin keratinocytes and dermal fibroblasts were used as negative controls to determine TCR FDRs, which were at least 10 times less compared with the level we observed in the skin (Table 1 and Supplemental Table 1; supplemental material available online with this article; https://doi.org/10.1172/jci.insight.120682DS1). MiXCR, a program dedicated to identifying intact CDR3 sequences, was also evaluated. When presented with intact TCR sequences, both TCRminer and MiXCR performed well at correctly and uniquely mapping reads to their corresponding α, β, γ, δ gene segments, with the exception that both methods had difficulty in uniquely mapping TRG J regions to a single gene segment (Supplemental Table 2). The extensive DNA sequence homology between the different TRG J regions made uniquely mapping TRG J–region reads difficult. However, when starting with in silico–generated simulated next-generation sequencing (NGS) TCR reads, TCRminer was better at estimating TCR gene segment expression and usage (Supplemental Figure 1). Similarly, TCRminer was highly effective, recovering nearly all (99.3%–99.7%) of the in silico–generated α, β, γ, δ TCR–related reads (Supplemental Figure 2 and Supplemental Table 3).
Table 1. TCRminer and MiXCR human T cell ratios.
Differences in gene expression of TCR-αβ and -γδ genes between mouse and human.
Because many studies on γδ T cells in psoriasis have utilized animal models, we first analyzed RNA-Seq data from normal healthy skin samples of murine and human origin. Results are presented as numbers of uniquely mapped TCR reads per million RNA-Seq reads. While the ratio of α, β, δ, and γ CDR3 reads were relatively similar in mouse skin (Table 2), the relative abundance of uniquely mapped γ and δ CDR3 reads (an indirect measure of γδ T cells) was only a small fraction of their α and β counterparts in human skin (0.06 and 0.017, respectively) (Table 1). Thus, in comparison with αβ T cells, γδ T cells are relatively rare in human skin — a finding supported by other investigators (30, 31).
Table 2. TCRminer and MiXCR mouse T cell ratios.
TCR-α, -β, -γ, and -δ gene expression in psoriatic skin.
It has been suggested that, in comparison with αβ T cells, the γδ T cell population becomes disproportionally expanded in psoriatic skin (10). To evaluate this at the level of the skin transcriptome, we calculated the relative abundances of αβ- or γδ-related reads. This revealed that, while the overall frequency of reads mapping to TCR-γ and -δ genes increased modestly in the setting of psoriasis, this increase was less than that observed for reads mapping to TCR-α and -β genes (Table 1). When compared with normal skin, TCR-β reads increased 2.31-fold in psoriatic skin, while TCR-δ reads increased 1.42-fold (Table 1). Thus, within the skin transcriptome, there is no evidence to support a differential expansion of γδ over αβ T cells in human psoriasis (10), although there is a modest overall increase in γδ TCR gene expression (FDR = 1 × 10⁻⁵) (Table 1).
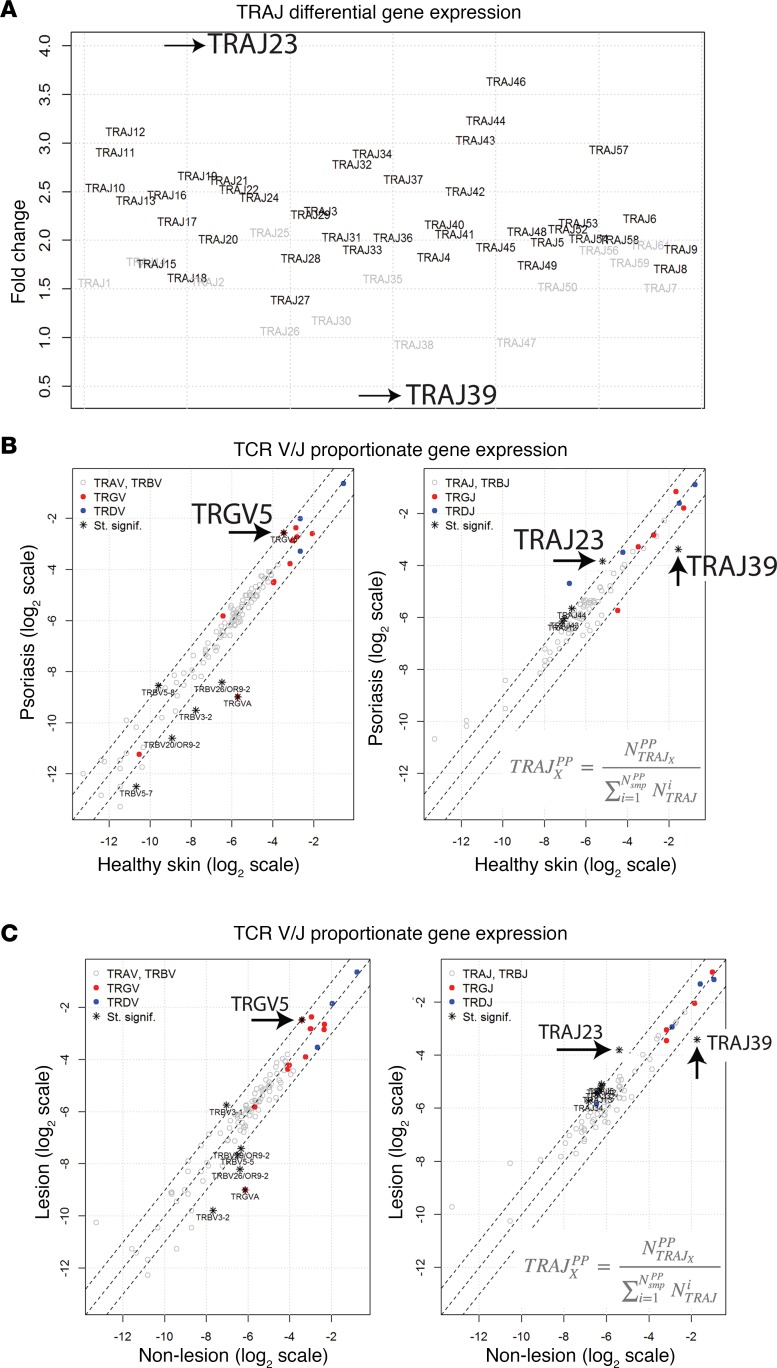
Distribution of TCR gene usage in psoriatic skin. To determine if psoriasis is associated with a perturbation in TCR gene usage, we next compared the TCRs in psoriatic plaques to those used by skin-resident T cells in healthy controls. This analysis was first conducted on a discovery dataset (29), which was the largest of the psoriasis RNA-Seq datasets we analyzed. The goal of this analysis was to identify differentially expressed TCR genes and to identify psoriasis-associated changes in proportionate TCR gene frequencies (frequency of one TCR gene segment relative to all other TCR gene segments of the same type). To identify differentially expressed TCR gene segments, TCRminer was used to identify reads that aligned to TCR, and DESeq2 was used for differential analysis. Since psoriasis is associated with an infiltrate of αβ and γδ T cells, it is not surprising that most TCR gene segments were found to be increased in psoriatic skin compared with control healthy skin (Figure 1A). However, one surprising finding was that gene expression of TRAJ39 clearly stood out; rather than being increased, it was dramatically decreased in psoriatic skin (Figure 1A). Also, of the upregulated genes, TRAJ23 had the greatest fold change (~4-fold) (Figure 1A).
Figure 1. Patterns of TCR V/J gene usage in the setting of psoriasis.
Tsoi et al. dataset details are listed in Table 6 (32). (A) Differential gene expression by DESeq2 (Fold Change on y axis) of TCR TRA gene segments in psoriasis versus healthy controls. TRAJ gene segments are separated on the x axis. Differentially expressed genes (FDR < 0.05) are depicted in bold. (B) To estimate the variation in variable (V) and joining (J) segment usage, all reads mapping to each gene segment were pooled separately for both healthy and psoriatic individuals. The proportions for each TCR gene segment were then calculated (e.g., ratio of TRAJ39 counts to all TRAJ counts). Fisher’s exact test for count data was used to estimate statistically significant differences in the TCR segment usage between healthy and psoriatic samples. Gene segments with FDR < 0.05 and an odds ratio <0.5 or >2 are designated with an asterisk on the graph. Gene segments with statistically significant changes in their proportionate gene expression are listed in Supplemental Table 4. (C) Unpaired analysis of proportionate expression of TCR genes in psoriasis plaques versus nonlesional skin. All reads mapping to each gene segment were pooled separately for both lesional and nonlesional samples. The proportions for each TCR gene segment were calculated as described above. Fisher’s exact test for count data was used to estimate statistically significant differences in the TCR segment usage between lesional and nonlesional skin samples. Gene segments with FDR < 0.05 and an odds ratio <0.5 or >2 are designated with an asterisk on the graph. Gene segments with statistically significant changes in their proportionate gene expression are listed in Supplemental Table 5. Wilcoxon signed rank test for paired samples was used to estimate statistically significant differences.
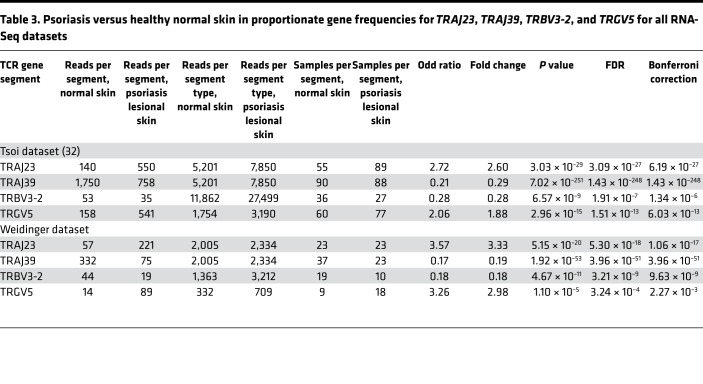
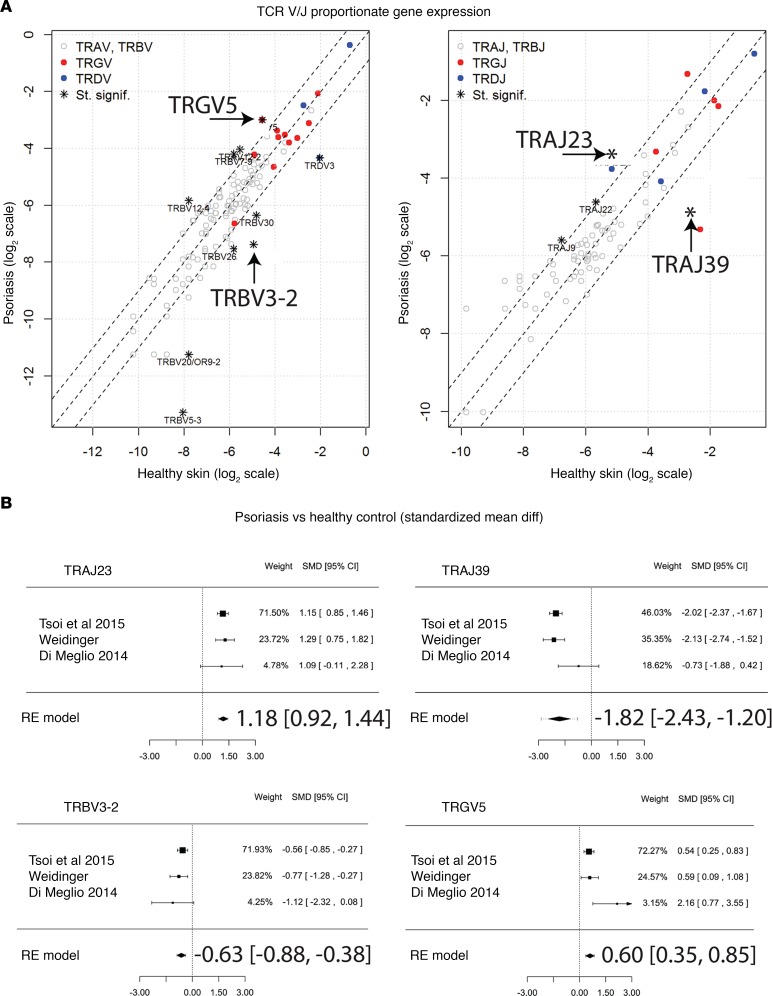
As a method to adjust for the psoriasis-associated increase in skin-infiltrating T cells, we next determined the proportionate frequencies of each TCR gene segment in psoriatic skin compared with healthy control skin. This method allowed us to determine if the relative usage of a particular TCR gene segment, compared with other segments of the same type, changed in the setting of psoriasis. Although the individual TCR gene segments had a wide range of proportionate frequencies (i.e., some TCR gene segments are more frequently used than others), their usage was similar in psoriasis and healthy control skin, with a few notable exceptions (Figure 1B, Table 3, and Supplemental Table 4). TRAJ23 stood out as having the highest increase in proportional gene expression in psoriatic skin (FC = 2.60, FDR = 3.09 × 10⁻²⁷) (Figure 1B, Table 3, and Supplemental Table 4). This result implies that cells within a psoriatic plaque are presumably more likely to use this gene segment compared with cells in healthy normal skin. In contrast, the proportional gene expression of TRAJ39 and TRBV3-2 were reduced in psoriatic plaques (FC = 0.29, FDR = 1.43 × 10–248 and FC = 0.28, FDR = 1.91 × 10⁻⁷, respectively) (Figure 1B, Table 3, and Supplemental Table 4).
Table 3. Psoriasis versus healthy normal skin in proportionate gene frequencies for TRAJ23, TRAJ39, TRBV3-2, and TRGV5 for all RNA-Seq datasets.
With regards to γδ TCR gene segments, only TRGV5 was statistically significantly elevated in the setting of psoriasis (FC = 1.88, FDR = 2.96 × 10⁻¹⁵) (Figure 1B, Table 3, and Supplemental Table 4). There were other TCR gene segments whose proportionate usage either increased or decreased in psoriasis, but in comparison with TRAJ23 and TRAJ39, none were as significant (Figure 1B and Supplemental Table 4). Table 3 lists fold changes (psoriasis versus healthy normal skin) in proportionate gene frequencies for TRAJ23, TRAJ39, TRBV3-2, and TRGV5 for all RNA-Seq datasets.
Importantly, the upregulation of TRAJ23 is specific for psoriasis, as it was not observed in a control atopic dermatitis RNA-Seq dataset (FC = 1.04, FDR = 1.0). Also, there was no change in the proportionate gene frequencies of the TRVG9 and TRVD2 (Figure 1B and Supplemental Table 4), which is relevant, as C-C chemokine receptor–6+ (CCR6+) Vγ9Vδ2 T cells were previously reported to be involved in psoriasis pathophysiology (13).
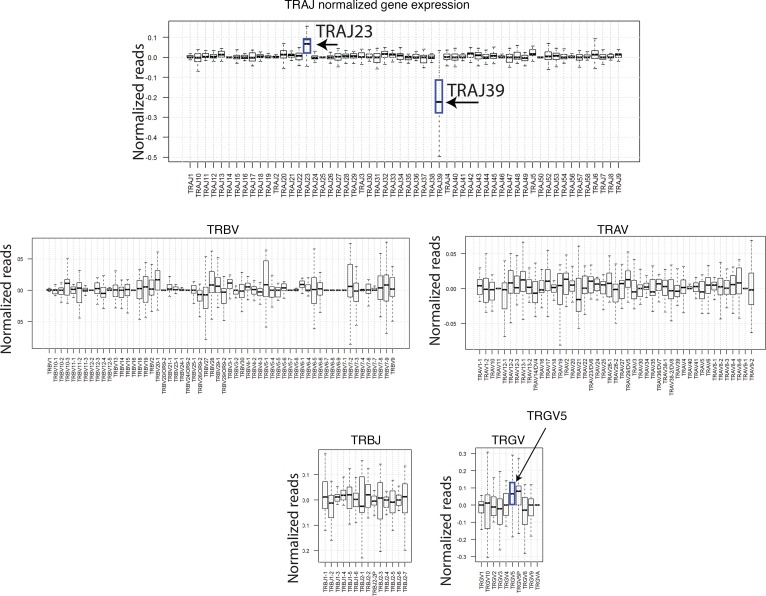
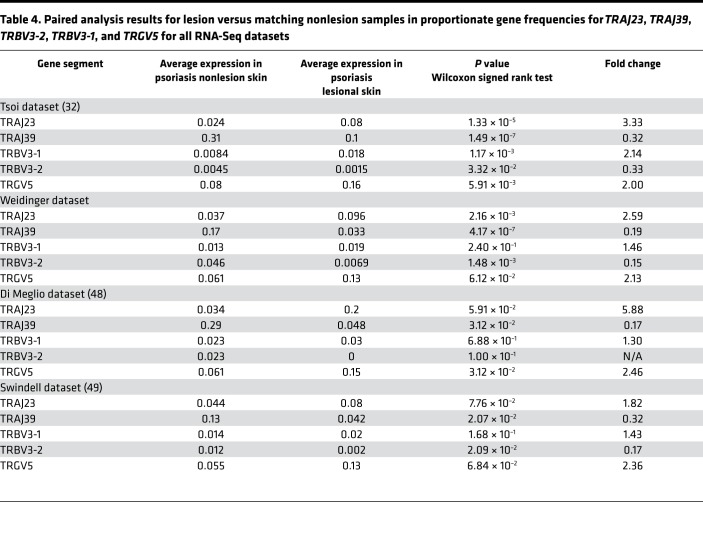
Because there is interpersonal variation in the frequencies of TCR gene segments, which would presumably interfere with our ability to detect differences in TCR usage, we also conducted a paired analysis to identify psoriasis-associated TCR gene segments in which each patient’s nonlesional skin specimen served as a paired control. Like the unpaired analysis (lesional versus nonlesional) (Figure 1C and Supplemental Table 5), the paired analysis also identified statistically significant and meaningful variations in the proportional gene usage of TRAJ23, TRAJ39, TRBV3-2, and TRGV5 (Figure 2 and Table 4), which verified our discovery dataset analysis. Apart from this validation, paired analysis also identified TRBV3-1 as having an increased proportionate usage in psoriasis (Table 4). A few other gene-usage alterations were also detected in the unpaired analysis (lesional versus nonlesional) (Figure 1C and Supplemental Table 5), although none as meaningful as the ones identified in our discovery set (paired analysis results for TRAJ23, TRAJ39, TRBV3-1, TRBV3-2, and TRGV5 for all of the RNA-Seq datasets are shown in Table 4). Graphing normalized reads for each TCR gene segment highlights the differential expression of TRAJ23 and TRAJ39 identified by paired analysis (Figure 2).
Figure 2. Paired analysis of TRAJ, TRBV, TRAV, TRBJ, and TRGV gene segment expression for lesional and nonlesional psoriasis skin.
The proportions for each TCR gene segment were calculated as described above for each skin sample. The difference between lesional and matching nonlesional samples were then calculated for each patient (from dataset in ref. 32). Median and variations are represented as box plots. Wilcoxon signed rank test for paired samples was used to estimate statistically significant differences. Gene segments TRAJ23, TRAJ39, and TRGV5 (P = 1.33 × 10⁻⁵, P = 1.49 × 10⁻⁷, and P = 5.91 × 10⁻³, respectively) are designated with an arrow on the graph.
Table 4. Paired analysis results for lesion versus matching nonlesion samples in proportionate gene frequencies for TRAJ23, TRAJ39, TRBV3-2, TRBV3-1, and TRGV5 for all RNA-Seq datasets.
Meta-analysis confirmation of TCR gene usage.
We next analyzed an independently acquired psoriasis RNA-Seq dataset (S. Weidinger, unpublished data), which yielded similar results to that of the discovery dataset — specifically, increases in proportionate TCR gene usages for TRAJ23 and TRAGV5 (FC = 3.33, FDR = 5.30 × 10⁻¹⁸, and FC = 2.98, FDR = 3.24 × 10⁻⁴, respectively) and decreases in TRAJ39 and TRBV3-2 (FC = 0.17, FDR = 3.96 × 10–51, and FC = 0.18, FDR = 3.21 × 10⁻⁹, respectively) when compared with their proportionate TCR gene usage in normal healthy skin (Figure 3A and Supplemental Table 6). Paired analysis (lesional versus nonlesional) also revealed these same alterations in the proportionate TCR gene usages of TRAJ23, TRAJ39, and TRBV3-2 (Table 4). Although the purpose of acquiring the Weidinger dataset was to validate discovery dataset findings, comparison of psoriasis versus normal healthy skin in this dataset identified alterations in the proportionate gene usage of TRBV7-9 and TRBV30 (FC = 3.09, FDR = 1.31 × 10⁻⁷ and FC = 0.34, FDR 2.82 × 10⁻⁵, respectively) (Figure 3A and Supplemental Table 6). Additionally, alterations in TRBV4-1 usage were detected after paired analysis of psoriasis lesional skin versus matched nonlesional controls (FC = 6.35, FDR = 2.51 × 10⁻²). Suffice it to say, as sequencing technology improves, it is likely that new discoveries will emerge from RNA-Seq psoriasis datasets. However, for the purpose of the current study, we used the original Tsoi dataset (29, 32) as our discovery set, as it had the largest sample size, composed of 99 psoriatic, 90 control, and 27 lesion/nonlesional paired specimens.
Figure 3. Meta-analysis of RNA-Seq datasets to confirm psoriasis associations with overexpression of TRAJ23 and decreased expression of TRAJ39.
(A) Using an independently acquired second sample set (Weidinger dataset details are listed in Table 6) as a validation sample set the proportionate TCR gene segment usage was determined for separately pooled psoriasis and healthy samples. Fisher’s exact test for count data was used to estimate statistically significant differences in the TCR segment usage between healthy and psoriatic samples. Gene segments with FDR < 0.05 and an odds ratio <0.5 or >2 are designated with an asterisk on the graph. Gene segments with statistically significant changes in their proportionate gene expression are listed in Supplemental Table 6. Gene segments statistically significantly elevated in the first (Tsoi et al. dataset details [32] are listed in Table 6) dataset are designated with an arrow on the graph. (B) Meta-analysis of RNA-Seq datasets comparing psoriasis versus healthy skin. Forest plots of the standardized mean difference of proportionate TCR gene segment expression in psoriasis lesional skin versus healthy controls. Each black box is representative of the study weight for each data set, and horizontal lines are 95% CI. Diamonds represent standardized mean differences for results of all studies combined. Extremes of diamonds give 95% CI.
To validate the main findings of the discovery dataset across all datasets, the standardized mean difference (SMD) was calculated for each TCR gene segment whose proportional expression was found to be significantly different (psoriasis versus controls or lesion versus nonlesion). The SMD was then used to conduct a meta-analysis incorporating all datasets.
Importantly, SMD should not be confused with FC, as the SMD is the ratio of the mean to the SD of the difference between 2 groups. SMD was calculated so that a meta-analysis could be conducted for individual TCR gene segments to determine if their proportionate gene expression was significantly up- or downregulated, which would be supported by an SMD 95% CI that does not cross 0.
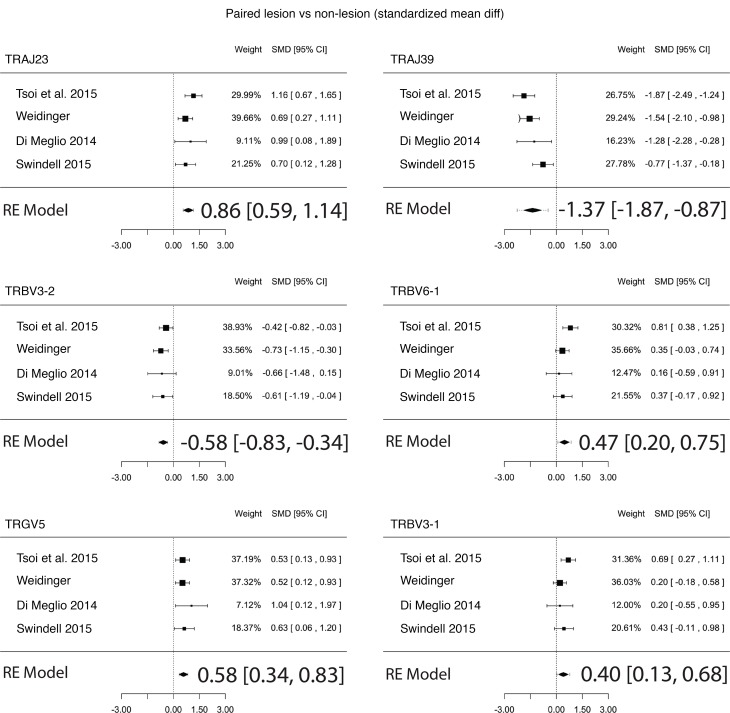
The final regression model across all RNA-Seq paired datasets estimated the SMD for proportionate upregulation of TRAJ23 and TRGV5 to be 0.86 (0.59, 1.14; P = 8.4 × 10⁻¹⁰) and 0.58 (0.34, 0.83; P = 3.3 × 10⁻⁶), respectively and the SMD for the proportionate downregulation of TRAJ39 and TRBV3-2 to be –1.37 (–1.87, –0.87; P = 7.4 × 10⁻⁸) and –0.58 (–0.83, –0.34; P = 3.4 × 10⁻⁶), respectively (Figure 4). For psoriasis versus healthy control the SMD for proportionate upregulation of TRAJ23 and TRGV5 was 1.18 (0.92, 1.44; P = 2.1 × 10⁻¹⁸) and 0.60 (0.35, 0.85; P = 3.7 × 10⁻⁶), respectively, while SMD for the proportionate downregulation of TRAJ39 and TRBV3-2 was –1.82 (–2.43, –1.20; P = 8.8 × 10⁻⁹) and –0.63 (–0.88, –0.38; P = 5.3 × 10⁻⁷), respectively (Figure 3B).
Figure 4. Meta-analysis of TCR proportionate gene expression using 4 different RNA-Seq datasets in psoriasis lesional skin versus matching nonlesional skin.
Forest plots of the standardized mean difference of proportionate TCR gene segment expression in psoriasis lesional skin versus matching nonlesional skin. Each black box is representative of the study weight for each data set, and horizontal lines are 95% CI. Diamonds represent standardized mean differences for results of all studies combined. Extremes of diamonds give 95% CI.
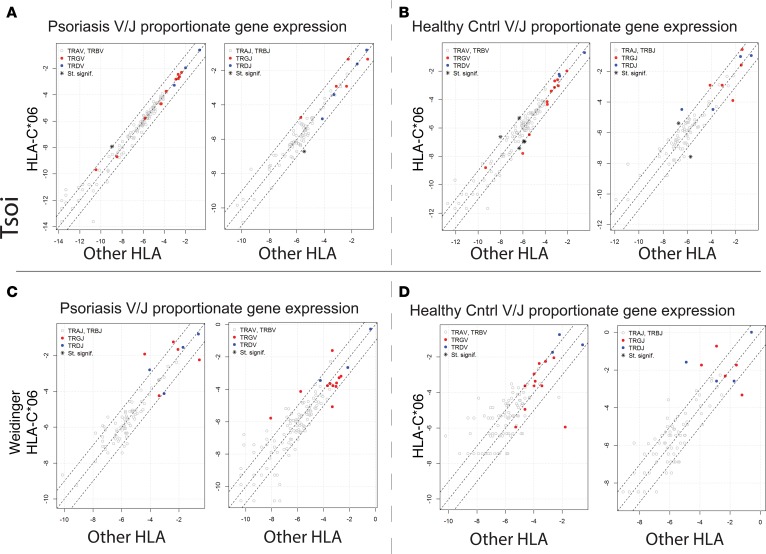
Association of HLA-C*06 with V-J TCR gene usage. The main function of MHC class I and II is to present peptide antigens to T cells (33). Thus, overexpression of a particular TCR gene segment in psoriatic plaques may also represent its reactivity against a yet-to-be-identified psoriatic antigen in the context of a psoriasis-associated MHC. Thus, we investigated the link between TCR gene segment usage and MHC by separating patients and controls by the presence or absence of HLA-C*06, an MHC class I molecule strongly associated with psoriasis (Figure 5, A and B; presumably, the antigen-binding specificity of HLA-C*06 predisposes individuals to developing psoriasis). Specifically, we searched for a TCR gene usage signature that associated with HLA-C*06 positivity in the discovery dataset. To predict the HLA haplotype of our psoriatic patients and controls, we used HLAminer (34) to mine RNA-Seq datasets for HLA. This prediction method appropriately identified the known association between psoriasis and HLA-C*06 (Table 5). We next determined if HLA-C*06–positive psoriasis samples had significant variation in their proportionate usage of TCR gene segments. After correcting for multiple testing, our analysis failed to identify a statistically significant positive association between HLA-C*06 and TCR V and J segment gene usage (Figure 5A and Supplemental Table 7). There was a potential negative association between HLA-C*06 and the relatively rare TRAJ40 (FC = 0.41, FDR = 6.62 × 10⁻⁴, Figure 5A and Supplemental Table 7). Comparing the skin transcriptome of healthy HLA-C*06 individuals to non–HLA-C*06 individuals identified a few additional HLA-C*06 associations, but none were highly significant (Figure 5B and Supplemental Table 8). These analyses were then repeated with the Weidinger dataset, again failing to reveal any significant TCR gene segment associations with HLA-C*06 (Figure 5, C and D). Thus, neither TRAJ23 nor TRAJ39 associated with HLA-C*06.
Figure 5. Lack of HLA-C*06–specific TCR gene expression signature.
(A) For psoriatic samples (Tsoi et al. dataset details [32] listed in Table 6), all the reads mapping to each TCR gene segment across HLA-C*06–positive versus all other HLA types in psoriatic individuals were pooled. The proportions for each TCR gene segment were calculated as described above. Fisher’s Exact test for count data was used to estimate statistically significant differences in the TCR segment usage. Gene segments with FDR < 0.05 and an odds ratio <0.5 or >2, are designated with an asterisk on the graph. Gene segments with statistically significant changes in their proportionate gene expression are listed in Supplemental Table 7. (B) For healthy individuals (Tsoi et al. dataset details [32] listed in Table 6), all reads mapping to each TCR gene segment across HLA-C*06–positive and all other HLA types were pooled separately. Fisher’s exact test for count data was used to estimate statistically significant differences in the TCR segment usage. Gene segments with FDR < 0.05 and an odds ratio <0.5 or >2 are designated with an asterisk on the graph. Gene segments with statistically significant changes in their proportionate gene expression are listed in Supplemental Table 8. (C and D) Analysis was repeated using the validation (Weidinger dataset details listed in Table 6) dataset for psoriasis HLA-C*06 versus all other HLA in C and for healthy control HLA-C*06 versus all other HLA in D.
Table 5. HLA typing results using HLAminer for 2-digit resolution on RNA-Seq data from healthy and psoriatic individuals in Tsoi dataset.
Reconstructing β and δ chain CDR3 sequences to identify shared T cells and analysis of TCR diversity in psoriatic plaques.
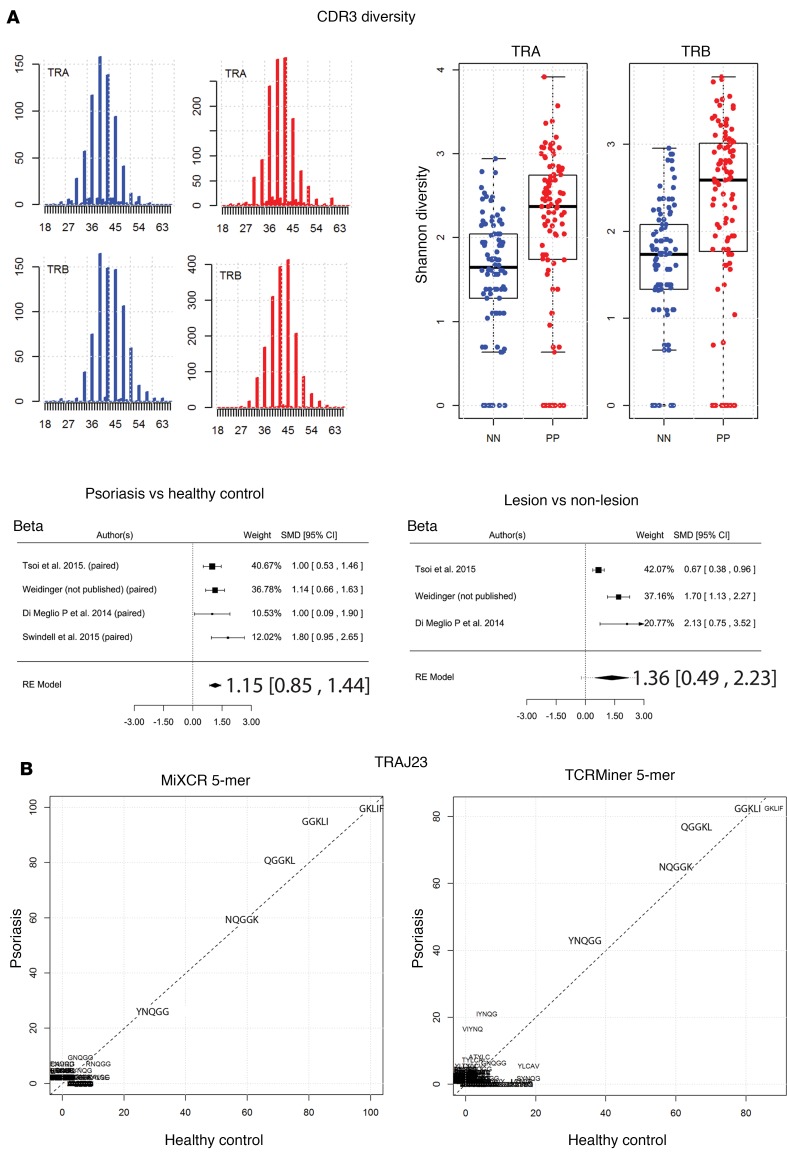
Because antigen recognition is based on interactions between TCR CDR3 and a peptide-bound MHC complex, we used MiXCR to mine all psoriasis RNA-Seq datasets for unique or similar CDR3 amino acid sequences that were differentially expressed in psoriatic plaques when compared with normal healthy skin and nonlesional psoriasis skin (Supplemental Table 9). Figure 6A depicts the Gaussian-like distribution of the mined CDR3 sequences (Figure 6A), demonstrating that a strongly dominant public expansion was not present. Unlike the α and β chain analyses, the frequency of reads covering the entire CDR3-encoding portion of TCR-δ was too low to reliably estimate distribution of CDR3 lengths. As expected, most of the TCR-α, β, and δ, but not TCR-γ, CDR3 sequences recombined in frame, which is similar to results obtained from the peripheral blood of healthy donors (35). The median lengths of the TCR-β and -α CDR3 sequences from both psoriatic and healthy skin were 42 and 39 nucleotides (nts), respectively (Figure 6A). For all TCR chains (α, β, γ, δ), very few clonal CDR3 sequences could be found in more than 1 psoriasis patient, and there was no obvious overrepresentation of a specific CDR3 motif in clones detected in more than 1 individual. The sequences of individual T cell clones that were discovered in multiple psoriatic plaques or control biopsies are presented in Supplemental Table 9 (all datasets combined).
Figure 6. Increased αβ TCR repertoire diversity in psoriasis.
(A) In silico CDR3 spectratyping (distribution of clonotype frequency by CDR3 length) for the β and α chains. TCR CDR3 sequences were extracted from RNA-Seq datasets using MiXCR software, and reads for healthy (blue bars) and psoriatic individuals (red bars) were pooled. CDR3 sequence length is plotted along the x axis. The abundance of the TCR sequences is plotted on the y axis. The Shannon diversity index was then calculated for healthy (blue dots) and psoriatic (red dots) CDR3 sequences, and Wilcoxon rank sum test was used to estimate statistically significant differences in diversity; tabulated results are provided in Supplemental Table 10. Finally, a meta-analysis across all RNA-Seq datasets was used to verify the finding that psoriasis is associated with increased TCR CDR3 diversity. Forest plots of the standardized mean difference of TRB CDR3 diversity (psoriasis versus healthy control and psoriasis lesion versus nonlesional skin) are shown. Each black box is representative of the study weight for each data set, and horizontal lines are 95% CI. Diamonds represent standardized mean differences for results of all studies combined. Extremes of diamonds give 95% CI. (B) Full and partial CDR3 sequences from reads containing TRAJ23 were extracted using MiXCR or TCRminer. Amino acid sequences were analyzed using R package tcR. Common TRAJ23-encoded 5-mer sequences are presented. Both MiXCR and TCRminer yielded similar sequences, which did not differ significantly between psoriasis and healthy controls.
The diversity of TCR CDR3 sequences was also evaluated by calculating Shannon diversity index for the α and β repertoires in psoriasis and healthy controls. This revealed an increase in CDR3 αβ diversity in psoriatic skin (1.6 versus 2.1, P = 1.41 × 10⁻⁷ and 1.6 versus 2.2, P = 3.7 × 10⁻⁸, respectively) (Figure 6A and Supplemental Table 10). A meta-analysis of all sample sets (psoriasis versus healthy and lesion version nonlesion) validated this finding (Figure 6A). Thus, psoriasis is associated with increased CDR3 αβ diversity. Similarly, TRA and TRB V/J gene segment usage as determined by TCRminer was also more diverse in the setting of psoriasis (3.5 versus 3.8, P = 1.14 × 10⁻¹⁴ and 3.2 versus 3.4, P = 2.57 × 10⁻⁸, respectively) but diversity changes in TRG and TRD did not reach statistical significance (Figure 7 and Supplemental Table 11). Meta-analysis confirmed the psoriasis-associated increase in TCR V/J diversity, and the final model also detected a small statistically significant increase in TRG and TRD gene segment–usage diversity (Figure 7). Thus, although psoriasis is associated with an increased proportionate usage of TRAJ23 andTRGV5 and a concomitant decrease in TRBV3-2 and TRAJ39, our overarching finding is that the psoriatic T cell repertoire remains quite diverse, likely owing to the infiltration of polyclonal T cells.
Figure 7. Analysis of TCR V/J diversity in psoriasis.
V/J sequences were extracted from RNA-Seq datasets using TCRminer. Shannon diversity index was calculated for healthy (blue dots) and psoriatic (red dots) CDR3 sequences, and the Wilcoxon rank sum test was used to estimate statistically significant differences in diversity. Increased diversity of V/J gene segment usage were noted for TRA and TRB. Diversity of TRG and TRD did not change significantly. Results of statistical analysis are presented in Supplemental Table 11. Meta-analysis of all RNA-Seq datasets was used to confirm the observed psoriasis-associated increase in TRA and TRB diversity. Forest plots of the standardized mean difference of TRB CDR3 diversity (psoriasis versus healthy control and psoriasis lesion versus nonlesional skin) are shown. Each black box is representative of the study weight for each data set, and horizontal lines are 95% CI. Diamonds represent standardized mean differences for results of all studies combined. Extremes of diamonds give 95% CI.
We next compared the CDR3 junctional region of all TRAJ23-containing reads with appropriate 5′ adjoining sequences to search for overrepresented sequences within psoriasis plaques. For this analysis, we included reads from all RNA-Seq datasets containing partial or full-length CDR3 sequences, identified by TCRminer. Amino acid analysis of the CDR3 region was performed using R package tcR (36). The percent of reads containing the same 2-mer, 3-mer, 4-mer, and 5-mer sequences was calculated. This analysis revealed a variety of amino acid combinations that were commonly used by TRAJ23-bearing T cells; however, the frequencies of these were only slightly different between psoriasis and control skin. Common CDR3 amino acid combinations utilized by TRAJ23-bearing T cells included YNQGG, NQGGK, QGGKL, GGKLI, and GKLIF (Figure 6B). This same analysis was then performed on complete CDR3 sequences identified by MiXCR, and the exact same sequences were identified (Figure 6B).
γδ and αβ TCR gene associations with cell surface markers and T cell transcription factors.
To characterize how the αβ and γδ T cell infiltrates in psoriatic plaques differ from one another, we utilized Spearman’s rank-order correlation coefficient to measure the relationship between reads mapping to the α, β, γ, and δ TCR genes and molecular markers of immunologic significance. To verify that this type of analysis could indeed yield meaningful relationships, we first calculated the correlation between TCR-α and -γ genes and their corresponding TCR-β and -δ counterparts, which — as expected — revealed strong correlations (r = 0.69, P = 2.5 × 10⁻¹⁵, and r = 0.5, P = 1.6 × 10⁻⁷, respectively) (Supplemental Figure 3A).
For simplicity and accuracy, we present only TCR-β and -δ chain correlations for the remainder of the manuscript. Of note, αβ T cells do not express rearranged δ genes, but they can express γ genes. For this reason, the β and δ genes are the most relevant when conducting comparison studies with other immunogenes (for α and γ chain correlations, see Supplemental Tables 5 and 6).
As would be expected from skin-infiltrating lymphocytes, CCR6 gene expression correlated with TRB (r = 0.5, P = 3.1 × 10⁻⁷) and TRD (r = 0.32, P = 0.0015) (Supplemental Figure 3B). Also, in normal skin, CD4 correlated with TRB but not TRD (r = 0.53, P = 1.1 × 10⁻⁷, versus r = -0.04, P = 0.68) (Supplemental Figure 3C), a finding that is consistent with the fact that γδ T cells only rarely express CD4, a marker for the helper subset of αβ T cells. Likewise, CD8A correlated with TRB (r = 0.64, P = 2 × 10–16) but did not correlate meaningfully with TRD (r = –0.18, P = 0.088) (Supplemental Figure 3C). We next focused on TRD and TRB correlations with transcription factors important for Th1 (TBX21 [T-bet]), Th2 (GATA3), Th17 (RORC), and regulatory (FOXP3) responses. This revealed that TBX21 correlated with TRB and, to a lesser extent, TRD in psoriatic skin (r = 0.51, P = 1.6 × 10⁻⁷, and r = 0.28, P = 0.0047) (Supplemental Figure 3D.) In contrast, GATA3 did not correlate with TRB and correlated negatively with TRD (Supplemental Figure 3D). Although psoriasis is considered to be a Th17 disease, neither TRB nor TRD correlated with RORC, possibly owing to RORC expression in cell types other than IL-17–secreting T cells. Finally, FOXP3 positively correlated with TRB (Supplemental Figure 3D), which matches its increased gene expression in psoriasis skin. Additional correlations with other T cell markers and cytokines are presented in Supplemental Tables 12 and 13 and Supplemental Figure 3E.
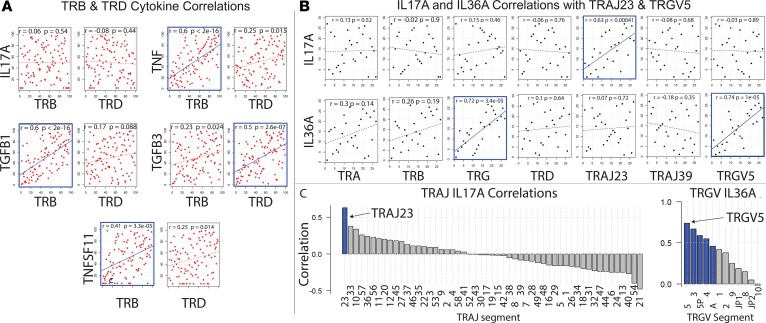
Association of TCR gene expression with psoriasis-relevant cytokines. We next sought to identify associations between TCR genes and genes encoding T cell–secreted cytokines such as TNF and IL-17A, which are thought to play dominant roles in psoriasis pathophysiology (37), as is evident by the clinical responses to anti-TNF– or anti–IL-17A–based therapies (2, 38). In terms of cytokines and their receptors, analysis of the discovery dataset revealed that TRB correlated well in psoriatic skin with the psoriasis-associated cytokines TNF, TNFSF11 (RANKL), and TGFB1 (r = 0.6, P = 2 × 10–16; r = 0.41, P = 3.3 × 10⁻⁵; and r = 0.6, P = 2 × 10–16, respectively; Figure 8A and Supplemental Table 13). In contrast, TRD correlated strongly with TGFB3 in psoriatic skin (r = 0.5, P = 2.6 × 10⁻⁷) (Figure 8A). A comprehensive list of correlations for the discovery dataset is presented in Supplemental Table 13. While there are many scenarios that can explain a positive TRB correlation with psoriasis-associated genes such as TNF, the most obvious possibility is that αβ effector T cells secrete TNF and other molecules important for the psoriasis phenotype. To explore this possibility further, we conducted the reverse experiment and searched for all genes that correlate with TNF. Using this set (identified as having a Spearman correlation with FDR < 0.05, discovery dataset) we next conducted KEGG pathway analysis (www.kegg.jp), which yielded the TCR signaling pathway map04660 (Homo sapiens hsa04660) as a major pathway associated with TNF (P = 1.45 × 10⁻⁹, q = 9.02 × 10⁻⁸).
Figure 8. TCR gene correlations with psoriasis-associated cytokines.
(A) Correlation of gene expression of TRB within psoriatic plaques with psoriasis-associated cytokines in the discovery RNA-Seq dataset (Tsoi et al. dataset details [32] listed in Table 6). Spearman correlation coefficients and P values are displayed on each plot. P values for Spearman’s test were calculated using the asymptotic t approximation. Significant correlations are outlined in blue. (B) Paired correlation analysis (psoriasis lesion versus matching nonlesion samples) in discovery RNA-Seq dataset. Differences in gene expression were calculated (normalized gene expression of nonlesion samples were subtracted from normalized gene expression of matching lesion samples). Then, the Spearman correlation coefficient was calculated for the difference in gene expression. Correlation coefficients and P values are displayed on each plot. P values for Spearman’s test were calculated using the asymptotic t approximation. Significant correlations (P < 0.05) are outlined in blue. (C) Waterfall plots depicting IL-17A correlations for all TRAJ and TRGV gene segments in discovery RNA-Seq dataset. Differences in gene expression were calculated (normalized gene expression of nonlesion samples were subtracted from their corresponding values of matching lesion samples). Then, Spearman correlation coefficients for differences in gene expression were calculated. Spearman correlation coefficients are depicted on the y axis. TRAJ or TRGV gene segments are separated on the x axis. P values for Spearman’s test were calculated using the asymptotic t approximation. Significant correlations (P < 0.05) are highlighted in blue.
Importantly, neither TRB nor TRD correlated with IL-17A (Figure 8A). However, this does not rule out T cells (either αβ or γδ) as a major source of this cytokine. One possibility is that other cells, in addition to T cells, secrete IL-17A, making it difficult to detect IL-17A correlations with TRB genes. Another possibility is that only a small fraction of the T cells (either αβ or γδ) secrete IL-17A. In support of the latter possibility, prior groups have demonstrated that T cells bearing certain γδ rearrangements can be skewed toward a Th17 immune response (39). Thus, we attempted to identify significant correlations between IL-17A expression and the expression of the different TCR variable gene segments; however, none of the correlations identified reached statistical significance (Supplemental Table 14), including those for TRGV5, TRBV3-1, and TRBV3-2.
In contrast, TRAJ23 (lesional versus nonlesional) correlated strongly with IL-17A (r = 0.63, P = 0.00041, Figure 8, B and C), and although TRGV5 did not correlate with IL-17A, it did strongly correlate with IL-36A (r = 0.74, P = 1 × 10⁻⁵, Figure 8, B and C), other IL-36 family members, and IL-17C (r = 0.57, P = 0.002) (Supplemental Table 15).
TRAJ23 correlates with IL-17A across all datasets. To estimate TCR gene correlations across all RNA-Seq datasets, we next conducted meta-analyses of Spearman correlations. For paired samples (lesion versus nonlesion), TRAJ23 correlated with IL-17A, (0.45 [0.22, 0.69; P = 1.3 × 10⁻⁴]) and TRGV5 correlated with IL-36A (0.46 [0.19, 0.72 P = 8.8 × 10⁻⁴]) (Figure 9) and IL-17C (0.44 [0.20, 0.67 P = 2.3 × 10⁻⁴]) (Supplemental Figure 4). Similar results were also obtained for unpaired sample sets (Figure 9). Finally, TRAJ39 and TRBV3-1 did not positively correlate with IL-17A or IL-36A (Supplemental Figure 4).
Figure 9. Meta-Analysis of IL-17A and IL-36A correlations across all psoriasis RNA-Seq datasets.
Graphs show unpaired analysis (within psoriatic plaques) and paired analysis (psoriasis lesion versus matching nonlesion samples). Results demonstrate that, in every dataset, TRAJ23 correlates with IL-17A, yielding a final model with a 95% CI that does not cross 0. Similarly, TRGV5 correlates with IL-36A across all datasets. In unpaired analysis, Spearman correlation coefficients for gene expressions within psoriatic plaques were calculated. For paired analysis, differences in gene expressions were calculated; normalized gene expression of nonlesion samples were subtracted from their corresponding normalized gene expression within the matching lesional sample. Then, Spearman correlation coefficients for differences in gene expressions were calculated. Forest plots of correlation coefficients are shown. Each black box is representative of the study weight for each data set, and horizontal lines are 95% CI. Diamonds represent standardized mean differences for results of all studies combined. Extremes of diamonds give 95% CI.
Discussion
Investigators are employing numerous approaches to characterize the immune response in the setting of psoriasis. Each of these has its own limitations. For example, strategies to purify immune cell populations from the skin prior to gene expression analysis are problematic because the purification methods (especially those involving positive selection or flow cytometry) are known to alter gene expression. Furthermore, immune cells within the skin will undoubtedly have different purification yields; T cells are especially difficult to analyze because, once purified, they require additional nonphysiologic in vitro stimulation with lectins or anti-CD3/anti-CD28 antibodies to identify their cytokine secretion profiles. How closely the garnered information from these studies will relate to in vivo cellular function remains unclear. Even with single cell analysis coming of age, it is unlikely that our understanding of psoriasis will improve dramatically. Although each technique will yield important discoveries, none can perfectly decipher the in vivo pathogenic immune response.
With these limitations in mind, we have taken to TCR mining from RNA-Seq datasets to perform correlative studies. The main advantage of this technology is that it is not subject to experimentally induced changes in gene expression. It is also powerful in that it can identify relationships between the αβ and γδ genes and genes of immunologic significance. Its main disadvantage, however, is that it cannot discriminate between direct or indirect correlations between these genes. Regardless, this technique is superior in many ways to traditional repertoire analysis, which cannot be employed for comparative studies.
Thus, we view our study as an important complement to work currently being conducted by other investigators. The power of our approach is highlighted by the identified correlation between TNF and T cell receptor β locus (TRB). Although statistically significantly elevated in the setting of psoriasis, the 1.65-fold increased expression of TNF in psoriatic plaques is under that which is usually considered meaningful for RNA-Seq analysis. The same was true for CCR6, which was not elevated in psoriasis plaques versus normal skin (fold change = 1.04) but did correlate well with TRB (r = 0.5, P = 3.1 × 10⁻⁷). These results clearly demonstrate that the thousands of genes that are meaningfully (greater than 2-fold) elevated in the setting of psoriasis are not a complete list of all important psoriasis-associated genes. In contrast to classical RNA-Seq differential expression analysis, our correlative studies between psoriasis-associated TCR gene segments and the rest of the psoriasis transcriptome yield a much smaller list of putatively important psoriasis genes, including some potentially novel ones. In addition, this method also allows TCR genes to be compared with one another, which revealed that there was no evidence for a preferential expansion of γδ over αβ T cells, as has been suggested by others (10).
Another interesting finding of our study is that the genes that are associated with αβ T cells differ from those associated with γδ T cells, with the latter being most strongly associated with IL-36A and other IL-36 family members. In contrast, in the discovery set, there were strong correlations between αβ TCR-encoding genes and the expression of psoriasis-associated cytokines TGFB1, RANKL, and TNF (Figure 8A and Supplemental Table 13). However, there were no significant correlations observed between TRA, TRB, TRG, TRD and IL-17A (Figure 8A). Prior to these findings, γδ T cells had been viewed by many as a major source of IL-17A in psoriasis. This hypothesis is not supported by our data. Given that the overall number of γδ T cell reads was exceedingly low in psoriatic skin, it is difficult to imagine how such a rare population of cells that do not correlate with IL-17A could be the major source of this cytokine. Rather, our results suggest that a small fraction of cells, possibly αβ T cells, express IL-17A. This hypothesis is supported by published flow cytometry data (40) demonstrating a low frequency of IL-17A–secreting αβ T cells in psoriasis.
The most striking finding of our study is the association of TRAJ23 and TRAJ39 with psoriatic and healthy skin, respectively, and the observation that the expression of TRAJ23 — but not TRAJ — correlates with IL-17A across all datasets (Figure 8A and Figure 9). A clear TCR gene segment usage signature and associated cytokine gene expression profile restructures our understanding of psoriasis. However, it does not rule out the possibility that, in addition to T cells, other immune cells are a source of IL-17A, which we did not explore but which is being studied by other groups (41–43).
Finally, although we were unable to demonstrate a meaningful relationship between γδ T cells and the psoriasis phenotype, we have not discounted these cells entirely. It is possible that γδ T cells, possibly the Vγ5 subset, expand in response to IL-36A, a cytokine that has been linked to severe psoriasis phenotypes (44). In addition, the low number of γδ reads could have hindered our ability to identify important correlations. However, in contrast to the overwhelming body of evidence in support of γδ T cells in the pathophysiology of psoriasis, our study supports a more minor role. This is in accord with a recent mouse study, which used a gene transfer model of IL-17 to demonstrate that a psoriasis-like phenotype can occur in the absence of γδ T cells (45) and another study that examined IL-17 production by targeted T cell repertoire analysis and IHC (46).
Taken together, our results favor TCR mining and correlative studies as a means to augment the other valuable approaches currently used to study psoriasis pathophysiology. Importantly, with a larger RNA-Seq dataset composed of longer and deeper strand-specific reads, we will be able to resolve even more information about the psoriatic pathogenic T cell repertoire. Specifically, we will be able to better explore the potential relationship between psoriasis susceptibility and TCR alleles, which was not explored here; dramatically improve our correlative studies; explore the connections between specific CDR3 gene segment usage and individual and nonclassical HLA molecules (47); identify more public clones shared among different psoriasis patients; and study the role of alternative splicing in the psoriasis phenotype.
Finally, the methods employed in our study can be broadly applied to characterize other immune-mediated diseases, immune responses to pathogens, or cancer-infiltrating immune responses or to monitor cancer patients receiving immunotherapy.
Methods
Human RNA-Seq.
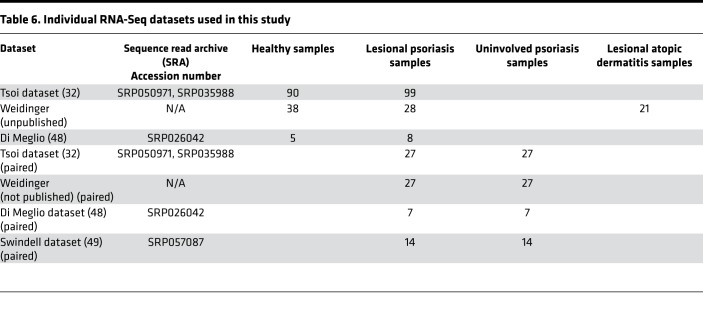
Individual RNA-Seq datasets used in this study are listed in Table 6. RNA-Seq FASTQ files of human normal and psoriasis lesional skin were downloaded from the NCBI Sequence Read Archive (SRA, http://www.ncbi.nlm.nih.gov/Traces/sra) or from S. Weidinger, who acquired the unpublished datasets for the purpose of this study. We combined 2 experimental datasets (accession numbers SRP035988 and SRP050971) published by the same research group. This included 99 lesional psoriatic and 90 normal skin biopsies from subjects of European descent enrolled in the Southeast Michigan area. Importantly, biopsy specimens obtained for this study originated from psoriasis patients who underwent a wash-out period to clear their system of all immunosuppressive medications. Lesional biopsy specimens were obtained from erythematous scaly plaques and nonlesional control specimens (n = 27) were obtained from matching uninvolved body sites. We used this large dataset as our primary discovery dataset. Information about samples and sequencing procedures can be found in the corresponding publications (29, 48, 49).
Table 6. Individual RNA-Seq datasets used in this study.
Murine skin RNA-Seq.
RNA-Seq FASTQ files of mouse normal skin were downloaded from the NCBI Sequence Read Archive (accession number SRP040121). We used data from the control group, which was composed of 27 uninfected mice. Information about samples can be found in ref. 50.
Human skin cells RNA-Seq.
For negative control, we used RNA-Seq data of human skin fibroblasts and keratinocytes downloaded from the European Nucleotide Archive (ENA; http://www.ebi.ac.uk/ena) (ENCSR510QZW, ENCSR000CPK) and SRA (SRP010678). RNA-Seq reads were truncated to 80 nucleotides to have negative control reads of similar length to the RNA-Seq reads of our psoriasis discovery dataset (29).
Simulated RNA-Seq data.
For positive control, we generate an RNA-Seq dataset by simulating a TCR transcriptome. First, 1,000 individual transcriptomes were assembled per TCR chain separately in silico to create simulated α, β, γ and δ TCR repertoires. This was accomplished by combining TCR segment sequences obtained from the IMGT database. CDR3 regions were generated randomly by applying insertion/deletion events with frequencies of those usually observed in the human TCR repertoire. Then, 100,000 simulated RNA-Seq reads were generated from the TCR transcripts by R package Polyester (51). The length of simulated reads was set to 80 nucleotides to yield lengths that match our psoriasis RNA-Seq discovery dataset used herein (29).
Extraction of TCR sequences from RNA-Seq data.
We used MiXCR software for direct extraction of TCR CDR3 sequences from RNA-Seq datasets. Analyses were performed with “-p rna-seq” option, as recommended for analysis of RNA-Seq data (52). For a more accurate estimation of TCR expression level, we mapped RNA-Seq reads against individual TCR segment sequences obtained from the IMGT database (28) using bwa-mem software (29): TCRminer. TCRminer scripts developed in R (53) parse the alignment files, and provide an aggregate count of the number of reads per TCR segment and TCR chain. Unlike MiXCR, TCRminer takes into account all reads related to TCR, including reads outside of the CDR3 region and partial CDR3 reads. It significantly increases both the number of accounted TCR reads and accuracy of TCR expression estimation.
Alignment.
We used STAR (version 2.5.2) to perform alignment of the human skin biopsy RNA-Seq datasets to UCSC hg19 reference genome and to estimate read counts for each identified gene. R package DESeq2 (54) (version 1.6.3) was used for read count normalization and differential expression analysis.
TCR gene proportion analysis.
To estimate psoriasis-associated alterations in TCR gene proportions, we count and summarize each TCR gene from all samples into 2 groups: normal and psoriasis samples. TCR gene data was then organized into 2 × 2 contingency tables, which represent tested gene counts and all TCR gene counts per each group. Fisher exact test was performed for each table, and fold change was calculated.
Correlations.
Correlation analyses of gene expressions were performed on read counts of each identified gene divided by normalization factors calculated by the DESeq2 package. In addition to this analysis, to reduce interpersonal variation of psoriasis gene expression, for datasets including patient-matched lesion and nonlesion samples, we performed one more calculation in which we subtracted gene expression of nonlesional skin from lesional skin. Spearman’s rank correlation coefficients were calculated in R (53) (version 3.1.2.) using the cor.test function, which was also used to estimate P values of the correlations by algorithm AS 89.
HLA predictions.
To predict HLA alleles from the RNA-Seq reads, we used HLAminer (34) (version 1.2). HLA typing was performed at the 2-digit level.
Pathway analysis.
The gene list enrichment analysis tool (55) was used to analyze associated genes with the KEGG pathway database.
Meta-analysis.
Meta-analysis performed using R package metafor (56). A weighted random-effects model was used to estimate a summary effect size. A restricted maximum-likelihood estimator was selected to estimate between-study variance. Weighted estimation with inverse-variance weights was used to fit the model.
TCR gene segment proportional expression was log-transformed, and the SMD was calculated as a measure of effect size for meta-analysis of V/J segment usage. Prior to calculating, SMD data was preprocessed using log-transformation. Spearman correlation coefficient was used as an effect size of V/J segment correlation with other genes.
Statistics.
Statistical analysis was performed using R software (53). Two-tailed P values less than 0.05 were considered statistically significant in all tests. P values were adjusted for multiple testing using the Benjamini-Hochberg method. Wilcoxon signed rank test was used to estimate statistically significant differences for paired samples. Fisher’s exact test was used to test statistically significant differences in TCR gene proportions in normal and psoriasis groups. In RNA-Seq analyses, fold changes were compared between groups using the Wald test, implemented within the DESeq2 (54) package. Correlation analysis was performed using the Spearman correlation coefficients calculated in R (53) (version 3.1.2.) using the cor.test function, which was also used to estimate 2-sided P values of the correlations by algorithm AS 89. Meta-analyses were performed using R package metafor (56). A weighted random-effects model was used to estimate a summary effect size. A restricted maximum-likelihood estimator was selected to estimate between-study variance. Weighted estimation with inverse-variance weights was used to fit the model.
Study approval.
Studies were approved by the local ethics board at the University Hospital Schleswig-Holstein. Subjects provided informed consent prior to their participation in this study.
Author contributions
AAM, AIM, and EM conceived of the research and designed research studies. AAM, AIM, JTE, LCT, SW, GL, and JEG acquired data. AAM, AIM, EM, and CM analyzed data. AAM wrote the TCRminer script. AAM, AIM, CM, JTE, LCT, SPR, SW, EAW, IEA, GL, JEG, MS, and EM discussed and critically reviewed results, as well as made critical revisions and suggestions. The manuscript was written through contributions of AAM, AIM, CM, JTE, LCT, SPR, SW, EAW, IEA, GL, JEG, MS, and EM. CM and EAW provided technical support, as well as manuscript and figure preparation. All authors have given approval of the final version of the manuscript.
Supplementary Material
Acknowledgments
EM is supported by an early career from the Burroughs Wellcome Fund. This project was supported by NIH 1DP2OD008752 and by P30CA093373.
Version 1. 07/12/2018
Electronic publication
Version 2. 08/22/2018
Author name misspelling corrected.
Footnotes
Conflict of interest: The authors have declared that no conflict of interest exists.
Reference information: JCI Insight. 2018;3(13):e120682. https://doi.org/10.1172/jci.insight.120682.
Contributor Information
Chelsea Ma, Email: chcma@ucdavis.edu.
Stephan Weidinger, Email: sweidinger@dermatology.uni-kiel.de.
Guillaume Luxardi, Email: gluxardi@ucdavis.edu.
Michiko Shimoda, Email: mshimoda@ucdavis.edu.
Emanual Maverakis, Email: emaverakis@ucdavis.edu.
References
- 1.Ellis CN, et al. Cyclosporine for plaque-type psoriasis. Results of a multidose, double-blind trial. N Engl J Med. 1991;324(5):277–284. doi: 10.1056/NEJM199101313240501. [DOI] [PubMed] [Google Scholar]
- 2.Thaçi D, et al. Secukinumab is superior to ustekinumab in clearing skin of subjects with moderate to severe plaque psoriasis: CLEAR, a randomized controlled trial. J Am Acad Dermatol. 2015;73(3):400–409. doi: 10.1016/j.jaad.2015.05.013. [DOI] [PubMed] [Google Scholar]
- 3.Cheuk S, et al. Epidermal Th22 and Tc17 cells form a localized disease memory in clinically healed psoriasis. J Immunol. 2014;192(7):3111–3120. doi: 10.4049/jimmunol.1302313. [DOI] [PMC free article] [PubMed] [Google Scholar]
- 4.Langley RG, et al. Secukinumab in plaque psoriasis--results of two phase 3 trials. N Engl J Med. 2014;371(4):326–338. doi: 10.1056/NEJMoa1314258. [DOI] [PubMed] [Google Scholar]
- 5.McInnes IB, et al. Secukinumab, a human anti-interleukin-17A monoclonal antibody, in patients with psoriatic arthritis (FUTURE 2): a randomised, double-blind, placebo-controlled, phase 3 trial. Lancet. 2015;386(9999):1137–1146. doi: 10.1016/S0140-6736(15)61134-5. [DOI] [PubMed] [Google Scholar]
- 6.Papp KA, et al. Brodalumab, an anti-interleukin-17-receptor antibody for psoriasis. N Engl J Med. 2012;366(13):1181–1189. doi: 10.1056/NEJMoa1109017. [DOI] [PubMed] [Google Scholar]
- 7.Gordon KB, et al. Phase 3 Trials of Ixekizumab in Moderate-to-Severe Plaque Psoriasis. N Engl J Med. 2016;375(4):345–356. doi: 10.1056/NEJMoa1512711. [DOI] [PubMed] [Google Scholar]
- 8.Wang EA, Suzuki E, Maverakis E, Adamopoulos IE. Targeting IL-17 in psoriatic arthritis. Eur J Rheumatol. 2017;4(4):272–277. doi: 10.5152/eurjrheum.2017.17037. [DOI] [PMC free article] [PubMed] [Google Scholar]
- 9.Sivamani RK, et al. Biologic therapies in the treatment of psoriasis: a comprehensive evidence-based basic science and clinical review and a practical guide to tuberculosis monitoring. Clin Rev Allergy Immunol. 2013;44(2):121–140. doi: 10.1007/s12016-012-8301-7. [DOI] [PubMed] [Google Scholar]
- 10.Cai Y, et al. Pivotal role of dermal IL-17-producing γδ T cells in skin inflammation. Immunity. 2011;35(4):596–610. doi: 10.1016/j.immuni.2011.08.001. [DOI] [PMC free article] [PubMed] [Google Scholar]
- 11.Yoshiki R, et al. IL-23 from Langerhans cells is required for the development of imiquimod-induced psoriasis-like dermatitis by induction of IL-17A-producing γδ T cells. J Invest Dermatol. 2014;134(7):1912–1921. doi: 10.1038/jid.2014.98. [DOI] [PubMed] [Google Scholar]
- 12.Hartwig T, Pantelyushin S, Croxford AL, Kulig P, Becher B. Dermal IL-17-producing γδ T cells establish long-lived memory in the skin. Eur J Immunol. 2015;45(11):3022–3033. doi: 10.1002/eji.201545883. [DOI] [PubMed] [Google Scholar]
- 13.Laggner U, et al. Identification of a novel proinflammatory human skin-homing Vγ9Vδ2 T cell subset with a potential role in psoriasis. J Immunol. 2011;187(5):2783–2793. doi: 10.4049/jimmunol.1100804. [DOI] [PMC free article] [PubMed] [Google Scholar]
- 14.Chang YT, et al. A study of PSORS1C1 gene polymorphisms in Chinese patients with psoriasis. Br J Dermatol. 2005;153(1):90–96. doi: 10.1111/j.1365-2133.2005.06570.x. [DOI] [PubMed] [Google Scholar]
- 15.Menssen A, et al. Evidence for an antigen-specific cellular immune response in skin lesions of patients with psoriasis vulgaris. J Immunol. 1995;155(8):4078–4083. [PubMed] [Google Scholar]
- 16.Vollmer S, Menssen A, Prinz JC. Dominant lesional T cell receptor rearrangements persist in relapsing psoriasis but are absent from nonlesional skin: evidence for a stable antigen-specific pathogenic T cell response in psoriasis vulgaris. J Invest Dermatol. 2001;117(5):1296–1301. doi: 10.1046/j.0022-202x.2001.01494.x. [DOI] [PubMed] [Google Scholar]
- 17.Warren RL, et al. Exhaustive T-cell repertoire sequencing of human peripheral blood samples reveals signatures of antigen selection and a directly measured repertoire size of at least 1 million clonotypes. Genome Res. 2011;21(5):790–797. doi: 10.1101/gr.115428.110. [DOI] [PMC free article] [PubMed] [Google Scholar]
- 18.Robins HS, et al. Comprehensive assessment of T-cell receptor beta-chain diversity in alphabeta T cells. Blood. 2009;114(19):4099–4107. doi: 10.1182/blood-2009-04-217604. [DOI] [PMC free article] [PubMed] [Google Scholar]
- 19.Rosenberg SA, Restifo NP, Yang JC, Morgan RA, Dudley ME. Adoptive cell transfer: a clinical path to effective cancer immunotherapy. Nat Rev Cancer. 2008;8(4):299–308. doi: 10.1038/nrc2355. [DOI] [PMC free article] [PubMed] [Google Scholar]
- 20.Sharma P, Wagner K, Wolchok JD, Allison JP. Novel cancer immunotherapy agents with survival benefit: recent successes and next steps. Nat Rev Cancer. 2011;11(11):805–812. doi: 10.1038/nrc3153. [DOI] [PMC free article] [PubMed] [Google Scholar]
- 21.Pardoll DM. The blockade of immune checkpoints in cancer immunotherapy. Nat Rev Cancer. 2012;12(4):252–264. doi: 10.1038/nrc3239. [DOI] [PMC free article] [PubMed] [Google Scholar]
- 22.Maverakis E, Beech JT, Wilson SS, Quinn A, Pedersen B, Sercarz EE. T cell receptor complementarity determining region 3 length analysis reveals the absence of a characteristic public T cell repertoire in neonatal tolerance. The response in the “tolerant” mouse within the residual repertoire is quantitatively similar but qualitatively different. J Exp Med. 2000;191(4):695–702. doi: 10.1084/jem.191.4.695. [DOI] [PMC free article] [PubMed] [Google Scholar]
- 23.Ria F, van den Elzen P, Madakamutil LT, Miller JE, Maverakis E, Sercarz EE. Molecular characterization of the T cell repertoire using immunoscope analysis and its possible implementation in clinical practice. Curr Mol Med. 2001;1(3):297–304. doi: 10.2174/1566524013363690. [DOI] [PubMed] [Google Scholar]
- 24.Menezes JS, et al. A public T cell clonotype within a heterogeneous autoreactive repertoire is dominant in driving EAE. J Clin Invest. 2007;117(8):2176–2185. doi: 10.1172/JCI28277. [DOI] [PMC free article] [PubMed] [Google Scholar]
- 25.Marusina AI, et al. CD4+ virtual memory: Antigen-inexperienced T cells reside in the naïve, regulatory, and memory T cell compartments at similar frequencies, implications for autoimmunity. J Autoimmun. 2017;77:76–88. doi: 10.1016/j.jaut.2016.11.001. [DOI] [PMC free article] [PubMed] [Google Scholar]
- 26.Woodsworth DJ, Castellarin M, Holt RA. Sequence analysis of T-cell repertoires in health and disease. Genome Med. 2013;5(10):98. doi: 10.1186/gm502. [DOI] [PMC free article] [PubMed] [Google Scholar]
- 27.Brown SD, Raeburn LA, Holt RA. Profiling tissue-resident T cell repertoires by RNA sequencing. Genome Med. 2015;7:125. doi: 10.1186/s13073-015-0248-x. [DOI] [PMC free article] [PubMed] [Google Scholar]
- 28.Giudicelli V, et al. IMGT/LIGM-DB, the IMGT comprehensive database of immunoglobulin and T cell receptor nucleotide sequences. Nucleic Acids Res. 2006;34(Database issue):D781–D784. doi: 10.1093/nar/gkj088. [DOI] [PMC free article] [PubMed] [Google Scholar]
- 29.Li B, et al. Transcriptome analysis of psoriasis in a large case-control sample: RNA-seq provides insights into disease mechanisms. J Invest Dermatol. 2014;134(7):1828–1838. doi: 10.1038/jid.2014.28. [DOI] [PMC free article] [PubMed] [Google Scholar]
- 30.Elbe A, Foster CA, Stingl G. T-cell receptor alpha beta and gamma delta T cells in rat and human skin--are they equivalent? Semin Immunol. 1996;8(6):341–349. doi: 10.1006/smim.1996.0045. [DOI] [PubMed] [Google Scholar]
- 31.Bos JD, et al. T-cell receptor gamma delta bearing cells in normal human skin. J Invest Dermatol. 1990;94(1):37–42. doi: 10.1111/1523-1747.ep12873333. [DOI] [PubMed] [Google Scholar]
- 32.Tsoi LC, et al. Analysis of long non-coding RNAs highlights tissue-specific expression patterns and epigenetic profiles in normal and psoriatic skin. Genome Biol. 2015;16:24. doi: 10.1186/s13059-014-0570-4. [DOI] [PMC free article] [PubMed] [Google Scholar]
- 33.Sercarz EE, Maverakis E. Mhc-guided processing: binding of large antigen fragments. Nat Rev Immunol. 2003;3(8):621–629. doi: 10.1038/nri1149. [DOI] [PubMed] [Google Scholar]
- 34.Warren RL, et al. Derivation of HLA types from shotgun sequence datasets. Genome Med. 2012;4(12):95. doi: 10.1186/gm396. [DOI] [PMC free article] [PubMed] [Google Scholar]
- 35.Freeman JD, Warren RL, Webb JR, Nelson BH, Holt RA. Profiling the T-cell receptor beta-chain repertoire by massively parallel sequencing. Genome Res. 2009;19(10):1817–1824. doi: 10.1101/gr.092924.109. [DOI] [PMC free article] [PubMed] [Google Scholar]
- 36.Nazarov VI, et al. tcR: an R package for T cell receptor repertoire advanced data analysis. BMC Bioinformatics. 2015;16:175. doi: 10.1186/s12859-015-0613-1. [DOI] [PMC free article] [PubMed] [Google Scholar]
- 37.Adamopoulos IE, et al. IL-17A gene transfer induces bone loss and epidermal hyperplasia associated with psoriatic arthritis. Ann Rheum Dis. 2015;74(6):1284–1292. doi: 10.1136/annrheumdis-2013-204782. [DOI] [PMC free article] [PubMed] [Google Scholar]
- 38.Chaudhari U, Romano P, Mulcahy LD, Dooley LT, Baker DG, Gottlieb AB. Efficacy and safety of infliximab monotherapy for plaque-type psoriasis: a randomised trial. Lancet. 2001;357(9271):1842–1847. doi: 10.1016/S0140-6736(00)04954-0. [DOI] [PubMed] [Google Scholar]
- 39.Cai Y, Fleming C, Yan J. New insights of T cells in the pathogenesis of psoriasis. Cell Mol Immunol. 2012;9(4):302–309. doi: 10.1038/cmi.2012.15. [DOI] [PMC free article] [PubMed] [Google Scholar]
- 40.Lowes MA, et al. Psoriasis vulgaris lesions contain discrete populations of Th1 and Th17 T cells. J Invest Dermatol. 2008;128(5):1207–1211. doi: 10.1038/sj.jid.5701213. [DOI] [PubMed] [Google Scholar]
- 41.Lin AM, et al. Mast cells and neutrophils release IL-17 through extracellular trap formation in psoriasis. J Immunol. 2011;187(1):490–500. doi: 10.4049/jimmunol.1100123. [DOI] [PMC free article] [PubMed] [Google Scholar]
- 42.Villanova F, et al. Characterization of innate lymphoid cells in human skin and blood demonstrates increase of NKp44+ ILC3 in psoriasis. J Invest Dermatol. 2014;134(4):984–991. doi: 10.1038/jid.2013.477. [DOI] [PMC free article] [PubMed] [Google Scholar]
- 43.Cua DJ, Tato CM. Innate IL-17-producing cells: the sentinels of the immune system. Nat Rev Immunol. 2010;10(7):479–489. doi: 10.1038/nri2800. [DOI] [PubMed] [Google Scholar]
- 44.Johnston A, et al. IL-1 and IL-36 are dominant cytokines in generalized pustular psoriasis. J Allergy Clin Immunol. 2017;140(1):109–120. doi: 10.1016/j.jaci.2016.08.056. [DOI] [PMC free article] [PubMed] [Google Scholar]
- 45.Suzuki E, et al. T Cell-Independent Mechanisms Associated with Neutrophil Extracellular Trap Formation and Selective Autophagy in IL-17A-Mediated Epidermal Hyperplasia. J Immunol. 2016;197(11):4403–4412. doi: 10.4049/jimmunol.1600383. [DOI] [PMC free article] [PubMed] [Google Scholar]
- 46.Matos TR, et al. Clinically resolved psoriatic lesions contain psoriasis-specific IL-17-producing αβ T cell clones. J Clin Invest. 2017;127(11):4031–4041. doi: 10.1172/JCI93396. [DOI] [PMC free article] [PubMed] [Google Scholar]
- 47.Patel F, Marusina AI, Duong C, Adamopoulos IE, Maverakis E. NKG2C, HLA-E and their association with psoriasis. Exp Dermatol. 2013;22(12):797–799. doi: 10.1111/exd.12280. [DOI] [PMC free article] [PubMed] [Google Scholar]
- 48.Di Meglio P, et al. Activation of the aryl hydrocarbon receptor dampens the severity of inflammatory skin conditions. Immunity. 2014;40(6):989–1001. doi: 10.1016/j.immuni.2014.04.019. [DOI] [PMC free article] [PubMed] [Google Scholar]
- 49.Swindell WR, et al. Proteogenomic analysis of psoriasis reveals discordant and concordant changes in mRNA and protein abundance. Genome Med. 2015;7(1):86. doi: 10.1186/s13073-015-0208-5. [DOI] [PMC free article] [PubMed] [Google Scholar]
- 50.Brady RA, Bruno VM, Burns DL. RNA-Seq Analysis of the Host Response to Staphylococcus aureus Skin and Soft Tissue Infection in a Mouse Model. PLoS One. 2015;10(4):e0124877. doi: 10.1371/journal.pone.0124877. [DOI] [PMC free article] [PubMed] [Google Scholar]
- 51.Frazee AC, Jaffe AE, Langmead B, Leek JT. Polyester: simulating RNA-seq datasets with differential transcript expression. Bioinformatics. 2015;31(17):2778–2784. doi: 10.1093/bioinformatics/btv272. [DOI] [PMC free article] [PubMed] [Google Scholar]
- 52.Bolotin DA, et al. MiXCR: software for comprehensive adaptive immunity profiling. Nat Methods. 2015;12(5):380–381. doi: 10.1038/nmeth.3364. [DOI] [PubMed] [Google Scholar]
- 53. R Core Team. R: A language and environment for statistical computing. R Foundation for Statistical Computing, Vienna, Austria. http://www.R-project.org/ Accessed June 15, 2018.
- 54.Love MI, Huber W, Anders S. Moderated estimation of fold change and dispersion for RNA-seq data with DESeq2. Genome Biol. 2014;15(12):550. doi: 10.1186/s13059-014-0550-8. [DOI] [PMC free article] [PubMed] [Google Scholar]
- 55.Chen EY, et al. Enrichr: interactive and collaborative HTML5 gene list enrichment analysis tool. BMC Bioinformatics. 2013;14:128. doi: 10.1186/1471-2105-14-128. [DOI] [PMC free article] [PubMed] [Google Scholar]
- 56.Viechtbauer W. Conducting meta-analyses in R with the metafor package. J Stat Softw. 2010;36(3):1–48. [Google Scholar]
Associated Data
This section collects any data citations, data availability statements, or supplementary materials included in this article.


