

Abstract
One of the major hurdles to promoting informed decision making in health is the continued use of poor risk presentation formats. This article offers a guide to develop a Fact Box, a simple decision tool to present data about the benefits and harms of treatments that has been demonstrated to improve understanding of health risks, an important part of risk literacy. The article offers guidance about how to determine the evidence basis for a health topic, select outcomes to report, extract and present numbers or outcomes, and design the layout. The guide also addresses potential challenges for summarizing evidence and provides alternatives for addressing issues related to missing, insufficient, imprecise, or conflicting evidence and for dealing with issues related to statistical and clinical significance. The guide concludes with details on how to document the development of the Fact Box for the purpose of transparency and reproducibility. Fact Boxes are an efficient tool to promote risk literacy and should be available in every physician’s office.
Keywords: risk communication, informed decision making, evidence-based medicine
To make informed health decisions, individuals need balanced and transparent information about health risks. Unfortunately, many people are not adequately informed about the benefits and harms of treatments or preventive health behaviors, in part a result of poor statistical literacy and the use of confusing and misleading risk presentation formats.1 While there is an extensive literature on evidence-based risk communication strategies for improving risk comprehension,2 there is a need for guidance about how to translate medical evidence for physicians and patients, particularly when the evidence about health risks is not so clear (e.g., missing information). The present article complements literature on risk communication by providing a guide for reviewing, summarizing, and implementing evidence-based information about risks into a simple standardized decision tool that can be used by researchers, patients, and health professionals alike.
The Fact Box: A Simple Tool for Balanced and Transparent Risk Communication
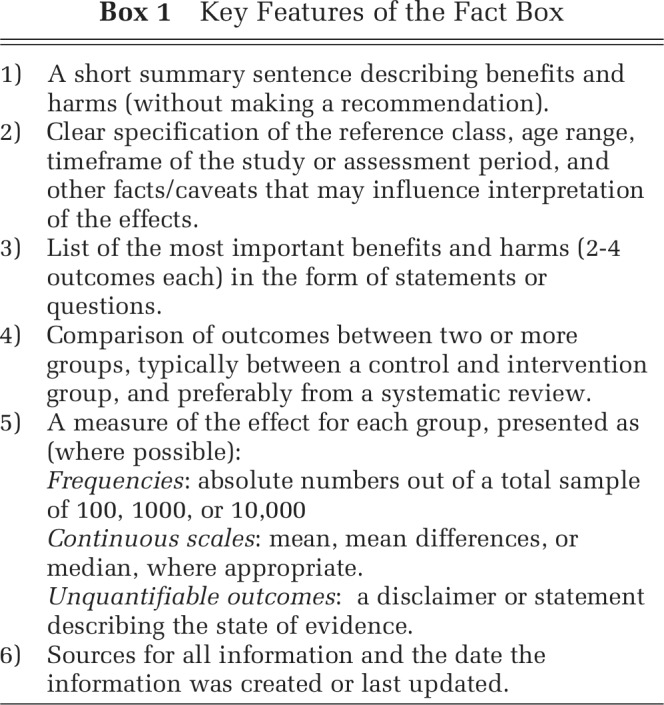
A Fact Box presents a simple tabular summary of the best available evidence about the benefits and harms of a medical procedure, treatment, or health behavior. As illustrated in Figure 1 in the Fact Box for Mammography screening, information about the benefits and harms are presented in an easily comparable, side-by-side tabular format that allows one to compare the risks across risk groups (e.g., screening v. no screening intervention). Information about health risks are summarized in absolute numbers, facilitating tradeoffs between treatment benefits and harms. Key features of the Fact Box are described in Box 1.
Figure 1.

Fact Box for the early detection of breast cancer by mammography.
Originally developed by Eddy4 in the form of a balance sheet and applied to illustrate the benefits and harms of colorectal cancer screening, the simple tabular format was adopted by a number of health organizations for evaluating and communicating the outcomes of health interventions (e.g., National Health and Medical Research Council,5 U.S. Preventive Services Task Force [“outcomes tables”],6,7 Cochrane Collaboration [Summary of Findings Tables]8,9). For use with lay audiences, the idea was subsequently adopted by Schwartz and others10,11 in the form of the Drugs Facts Box, and later extended to include cancer screening.12 The Fact Box has been demonstrated to improve comprehension of treatment benefits and harms and is easier to use when compared to direct-to-consumer advertisements.10,11,13 Since 2009, the Harding Center for Risk Literacy has helped the construction and dissemination of Fact Boxes focusing on health topics such as vaccinations, surgical procedures, nutritional supplements, and cancer screening tests. Recently, we have completed a study showing that Fact Boxes not only improve comprehension compared to direct-to-consumer advertisements, as shown by Schwartz and others10,11 and Sullivan and others,13 but also relative to the best available pamphlets from health organizations (McDowell and others, unpublished data).
It is in response to the challenges we faced when summarizing evidence for health topics more broadly that we offer a guide for how to design and present a Fact Box, with the focus on how to summarize evidence in a simple format and how to communicate this evidence not only to professional but also to lay audiences.8,9 In the sections that follow, we build on the initial design principles suggested by Eddy,4 and examined in Schwartz and other’s10,11 implementations of Drugs Fact Boxes, to offer clear instructions for translating medical evidence into a simple information tool. In particular, we include potential strategies or options for dealing with a range of challenges to summarizing evidence (e.g., presenting conflicting or insufficient evidence).
How to develop a Fact Box
Ideally, a Fact Box compares options that a patient would reasonably face during informed decision making, such as preference-sensitive decisions where the patient may need to make tradeoffs between benefits and harms. A Fact Box reports outcomes derived from a systematic review or, if not available, a single study. Systematic reviews and meta-analysis form the highest level of evidence quality, followed by randomized controlled trials and observational studies (see GRADE8 and Online Appendix 1 for guidelines). Additional sources can include clinical guidelines, technical reports, or data drawn from hospital audits of medical procedures. The most important consideration is that up-to-date, good-quality evidence is used and that all assumptions are reported transparently.
Transparent risk communications are equally beneficial for lay and professional audiences1; however, the Fact Box format could also be tailored to the specific needs of different medical professionals.14 Furthermore, experts and patients can be involved to help Fact Box designers to select decision- or patient-relevant outcomes, to simplify medical terminology, and to ensure that sufficient information is included to facilitate comprehension (see section “Selecting and Presenting Outcomes”). Pilot testing of the Fact Box with the target audience can help ensure that the content is relevant, easy to use, and improves comprehension of the health information.
Selecting and Presenting Outcomes
A Fact Box presents information in a tabular format, listing potential benefits and harms in the form of statements or questions on the left and comparing outcomes for groups in columns to the right. Typically, the Fact Box compares two treatment options or interventions (consistent with many other decision tools); however, it is feasible to compare two or more options within the one Fact Box if the effect of multiple comparisons does not overwhelm the reader. For example, a trial comparing two different interventions against standard care could be presented within the single Fact Box, or each intervention may be compared to standard care in two separate Fact Boxes depending on the evidence (e.g., if only one of the interventions is effective, two Fact Boxes may allow for a clearer comparison than only one). Alternatively, if outcomes are available for different risk groups (e.g., women aged 40–49 v. 50–59), they could be included within the same Fact Box (e.g., as separate columns or rows to facilitate comparisons of increasing or decreasing risk) or multiple Fact Boxes could be constructed and tailored to individual risk groups.
Given the focus on simplicity,4,10 the Fact Box highlights two to four of the most important benefits and harms. Where many outcomes are available, the following criteria may help prioritize outcomes:
Objective (e.g., results from medical tests or assessments) over more subjective outcomes (e.g., rating scales)
Absolute outcomes over rating scales
More severe over less severe outcomes
Common over uncommon outcomes
Outcomes based on better quality assessments
Outcomes based on a greater number of studies or participants
Patient-relevant outcomes or those based on expert recommendations
The aforementioned criteria serve as a guide for selecting outcomes and are not mutually exclusive. For example, common side-effects are often less severe, and there may be better quality data for subjective rating scales compared to objective assessments. The decision about which outcomes to include should be made in consideration of the health topic, available evidence, and expert or patient opinion. One potential process for determining priority is to consult patients and experts to guide the selection of the most important or decision-relevant outcomes, and then base selection on the types of outcome measures (e.g., objective v. subjective outcomes) and prioritize on the basis of the quality of the data. An alternative process would be to start with the quality of assessments for different types of outcomes and consult patients and experts as to the most decision-relevant outcomes to summarize once the evidence has guided the initial selection. However, while evidence quality may help guide the selection of which types of outcomes to report, outcomes that are deemed to be important and decision-relevant to a patient or expert should be included and the reason for the lack of or poor evidence summarized as described in the section “Challenges for Summarizing Evidence.”
To ensure transparency, sufficient detail about the science behind the numbers should be reported (see the section “Challenges for Summarizing Evidence”). Specifically, the Fact Box should contain information about the timeframe of the study or follow-up period and the reference group (e.g., age range, details of intervention received), and any medical terminology should be clarified. In particular, attention should be paid to the literacy level of the intended audience, and the description of outcomes should avoid technical jargon and complex medical terminology. For example, the Fact Box for acute otitis media (see Online Appendix 2) is presented using the lay terminology “Middle Ear Infection,” and “impaired hearing” is used to describe the outcome of the tympanometry exam to facilitate understanding for a nonexpert audience. Depending on the audience, different information or details may be needed (e.g., tympanometry exam may be the preferable terminology for expert audiences). However, transparent risk communication strategies are often just as beneficial for professionals as they are for the lay public.1
Extracting and Reporting Numbers
Numbers should be presented in a format that makes the reference class clear to enable the reader to evaluate the size of the effects and to understand to whom the effects occur. The most effective formats for presenting risk information are absolute numbers (e.g., the number of events experienced in each treatment group; see Figure 1 and Online Appendixes 2 and 3) and percentages.2,15. For example, absolute numbers highlight information about base rates and the size of an effect, unlike relative risk ratios that are misleading and poorly understood.16 An advantage of using absolute numbers is that they can easily be translated into visual formats (e.g., icon arrays; see Online Appendix 4) that can further improve the comprehension of risk information (e.g., by emphasizing part-to-whole relationships17,18). If frequency data are not reported, an attempt should be made to obtain these (see Table 1).
Table 1.
Approaches to Summarizing Risk Outcomes for Different Reporting Formats
| Reporting Format in Original Article | How to Summarize Outcomes in a Fact Box | Example Presentation |
|---|---|---|
| Frequency data | Use percentage or frequency formats: for example, “x out of 100.” Use smallest denominator (of base 10) to best represent the evidence while maintaining features of the data (e.g., risk reduction ratios in whole numbers). | Figure 1: Mammography screening, all outcomes |
| Keep denominator consistent (e.g., do not use “x in 100” for one outcome and “x out of 1,000” for another), or if multiple Fact Boxes are to be compared (e.g., different treatments for knee osteoarthritis), the denominator across Fact Boxes should also be consistent. | ||
| Report whole numbers, round if necessary. If a frequency is smaller than 1 but not 0, consider reporting as “less than 1” or “<1” or increasing the denominator for all outcomes (e.g., from <1 in 100 to 7 in 1,000). | ||
| Relative risks or odds ratios | If absolute numbers are also available, proceed as for
frequency data with the following exceptions:
a) Relative risk: If data are weighted according to sample size or study quality, calculate absolute numbers for control group and apply relative risk ratio to determine absolute number for intervention group. b) Odds ratio: Calculate the risk difference by first converting the control group risk to odds. Multiply by control group odds by the odds ratio, and then convert back to risks. Add/subtract the difference from the baseline risk. |
Online Appendix Figure 2 calculation for: “How many patients had pain 4 to 7 days after diagnosis?”Treatment effect:Relative Risk ratio (RR) = 0.79 |
| If absolute numbers are not reported: | Placebo risk: 11 out of 100 | |
| 1. Attempt to obtain absolute numbers from authors. | Treatment risk: 11 × RR (0.79) | |
| 2. Obtain base rate data for control group from another reputable source (e.g., representative baseline risk) and apply a) or b) calculation to the estimate as above. | = 9 out of 100 | |
| 3. Look for alternative sources that can be used to illustrate effects (e.g., select a good-quality randomized controlled trial from a meta-analysis and extract estimates from this study if magnitude of effect is in the same ballpark). | ||
| Number needed to treat (NNT) | NNT is not as easily understood as absolute risks, although
it is mathematically equivalent. a) For lay audiences, use alternative formats: |
To date, NNT has not been used to communicate risks in Fact Boxes |
| If absolute numbers are available, proceed as for frequency data. | ||
| If absolute numbers are not available, proceed as for relative risks | ||
| b) For professional audiences, NNT may be appropriate for reporting some outcomes. | ||
| Continuous outcomes |
Means or medians
Report aggregated data and reference scale anchors. If numbers are weighted according to sample size or study quality, incorporate weights into a calculation of the difference using the control group, and apply difference to intervention group. Medians may be more appropriate for non-symmetric distributions. Mean differences or change scores Attempt to obtain mean scores to summarize as above. If these cannot be obtained, report the outcome as “points improvement” or similar in reference to the type of scaled used. If rating scales are reported only with reference to verbal anchors rather than numbers, report the average scale anchor as the outcome. |
Online Appendix Figure 3: “How did patients rate their knee pain?”For example, “On a scale assessing pain (0 = worse to 100 = better), how many points did patients improve?” Online Appendix Figure 3: “How did patients rate their knee function?” |
In the best case, all outcomes should be reported according to the same metric or scale, as switching between formats (e.g., absolute numbers and mean scale ratings) can be confusing.19 Where multiple formats are necessary, the meaning of the reported numbers must be clearly labelled to reduce confusion. Table 1 presents common formats used to report intervention effects8,9 and provides examples for their implementation in Fact Boxes (e.g., Figures 1 and Online Appendixes 2 and 3). When it is not possible to extract the data (e.g., missing information), a disclaimer would be appropriate.
Challenges for Summarizing Evidence
A key challenge is uncertainty about an effect, due to a lack of data, conflicting data, or concerns about study quality. There are very few studies that examine how to communicate strength, applicability, and consistency of evidence or risk of bias.20 We offer potential strategies to address some of these issues.
Reporting No Difference Between Groups
When the evidence suggests no difference exists between two groups (e.g., for a lack of clinical or statistical significance; see Table 2), communicating small differences in absolute number may misleadingly suggest an effect. For example, 41 out of 100 children who do not take antibiotics for acute otitis media continue to have an abnormal hearing exam 4 to 6 weeks after diagnosis compared to 38 out of 100 children who take antibiotics. The available evidence suggests no difference between the two groups; however, parents may consider a difference of three children to be relevant. While a decision about whether a difference is meaningful should be left to the reader, the communication may be problematic in some circumstances. For example, the problem may be exacerbated with larger numbers (i.e., consider a difference of 30 in 1,000 children if results were presented out of 1,000) or when other outcomes reported within the Fact Box include the same numerical difference where the evidence suggests an effect (e.g., 4 in 100 children experience a ruptured eardrum without antibiotics compared to 1 in 100 who take antibiotics). Three alternative options for presenting outcomes are provided in Table 2. In the Fact Box for acute otitis media (Online Appendix 2), we addressed this issue by presenting the outcome as an aggregate of the two groups and stated that there was no difference between the groups (Option 1 was not possible because other outcomes would be affected by reducing the denominator).
Table 2.
Suggestions for How to Report Outcomes Given Uncertainty or Insufficient Information
| Option 1 | Option 2 | Option 3 | |
|---|---|---|---|
| Reporting no difference between groups | Reduce the denominator so that the outcomes round up or down to the same number (e.g., 41 v. 38 in 100 → 4 v. 4 in 10). This option is only possible if the differences for the remaining outcomes are unaffected. | Report the same number or range of numbers for both groups and include a qualifier (e.g., “about 40 in each group,” or “between 38 and 41 in each group”). Note: verbal qualifiers can be problematic or vary in interpretation.18 | Report an average of the numbers and state that there is no different between the groups (e.g., “no difference, around 40 in each group”). |
| Dealing with insufficient evidence | Seek representative data from an alternative source (e.g., national audit of outcomes on the medical procedure). Incorporate the additional source within the Fact Box and state any limitations to the evidence (e.g., footnote that the age-range differs from results reported in other sections). | If Option 1 is not possible, include the relevant outcome as a benefit or harm and where numbers are absent, provide a statement to suggest that there is currently insufficient data to make an estimate; that exact numbers are unknown; or an explanation as to why the numbers cannot be estimated. | |
| Dealing with conflicting information | Include the relevant benefit or harm within the Fact Box. In place of numbers, summarize the reasons why the results cannot be reported, for instance, owing to conflicting evidence. | Report the range of estimates across the studies (e.g., between 30 and 40 in 100 people experience an adverse event). This option may only be possible when the studies do not vary substantially in methodology or quality. | |
| Reporting (im)precision | If confidence intervals are provided, summarize the numbers with the given range (e.g., between 36 and 39 in 100 patients experienced an adverse event). | If confidence intervals are not provided, report numbers with an appropriate proposition or caveat (e.g., about 37 patients experienced an adverse event). | If the uncertainty is so high that an estimate cannot be quantified, report the benefit or harm and make a statement about the lack of precision in place of numbers. |
| Reporting confidence in estimates | Report numbers but include a disclaimer to state that the data is of low quality and future research may change confidence in the outcomes. | If study quality is so poor that outcomes cannot be communicated with confidence, include a statement that numbers cannot be reported owing to the poor quality of studies. | Communicate the strength of evidence, preferably according to a scale of 3 (e.g., poor, moderate, or high quality) for ease of interpretation.18 |
| Communicating clinical versus statistical significance | Report the numbers transparently, but include a disclaimer to state what would be considered a meaningful difference. | Aggregate the numbers and report that there is no meaningful difference between the groups (e.g., see section “Reporting No Difference Between Groups”). |
Reporting Unavailable, Missing, or Insufficient Evidence
Data may be insufficient or missing for a number of reasons, including lack of measurement, poor measurement quality, or an inability to measure the outcome. For example, adverse effects of treatments may not be available owing to poor or inadequate reporting. Rather than ignore these outcomes, a disclaimer or statement for the missing or insufficient data should be communicated to ensure that the potential outcomes are still considered alongside known risks and benefits. Dealing with unavailable, missing, or insufficient evidence can entail a number of steps. First, where outcomes cannot be drawn from a specific study or meta-analysis, it may be possible to obtain similar data from another source. For example, hemorrhage rates following tonsillectomy have been poorly reported in randomized controlled trials,21 yet they represent an important adverse event associated with treatment. Data on hemorrhage rates were not available in a meta-analysis on tonsillectomy but could be obtained for a similar age range and timeframe from an audit of tonsillectomy procedures in the United Kingdom and Ireland22 and incorporated into a Fact Box. Alternatively, it may be possible to extract the results from a good-quality randomized controlled trial within a meta-analysis. In some cases, it may not be possible to obtain any additional data. A disclaimer or statement is appropriate when additional data are unavailable. For instance, an issue associated with the use of antibiotics is the growing concern about antibiotic resistance,23 an outcome that is unquantifiable but has nevertheless been summarized in a statement in Fact Boxes on antibiotic treatments (see Online Appendix 2) owing to its broader implications for disease resistance at the population level. Presentation options are presented in Table 2, along with examples of their application in the Fact Boxes for acute otitis media (Online Appendix 2) and corticosteroid injections (Online Appendix 3).
Reporting on Conflicting Evidence
Conclusions from different meta-analyses or studies may conflict as to whether a treatment is considered effective. For example, when researching evidence on hyaluronan injections for treating knee osteoarthritis, conclusions from different meta-analyses and advice from professional practice recommendations conflicted as to whether the treatment was considered to be effective.24–26 Conflicts may result from differences in the included studies (e.g., study quality), owing to different measures to report outcomes, or to different formulations or treatment techniques compared (e.g., viscosupplementation). Similarly, meta-analyses often cannot integrate outcomes across studies owing to substantial heterogeneity or limited data. In such cases, to select a single meta-analysis or study for summarizing the evidence is not plausible, and the only transparent way to summarize outcomes is to communicate these conflicts. Specifically, a statement communicating the benefit or harm should be provided along with details of the source of and reason for the conflict in place of the numbers (see Table 2). It may be possible to report a range of the estimates reported across studies or meta-analyses if the studies do not vary substantially in their methodology or quality.
Communicating Confidence in Estimates: Imprecision and Study Quality
In the best case, risks can be presented with a point estimate indicating the best estimate of the size of an effect. However, owing to uncertainties inherent in the aggregation and estimation of effects, confidence in the point estimate can vary,27 and presenting a point estimate may be misleading. In such cases, risks are reported with a range or confidence interval to communicate that the true effect could lie anywhere between these numbers. However, many people find ranges or confidence intervals difficult to understand or ignore them altogether,19,28 and a verbal qualifier or disclaimer may be more appropriate, particularly when there is too much uncertainty surrounding an estimate to report an estimate of risk at all. The decision about whether or not to report confidence intervals will depend on whether they can be extracted from a review or study and in consideration of the intended audience. For expert audiences, confidence intervals may provide context for the certainty of an effect, whereas for lay populations, who often have difficulty understanding the meaning of confidence intervals, verbal qualifiers may be more appropriate. In such cases, consultation and user-testing with the intended audience will guide the selection of the most comprehensible presentation option. Options for communicating imprecision are presented in Table 2.
Similarly, confidence in estimates can be affected by uncertainty associated with the quality or strength of evidence2,27,29,30 (e.g., risk of bias in included studies, degree of imprecision, and publication bias).31 Many meta-analyses rate estimates in terms of evidence quality, and one may face the decision about whether or how to communicate numbers based on poor evidence. The Cochrane Collaboration rates study quality in accordance with the GRADE system and include ratings of confidence within their Summary of Findings tables8 in the form of evaluative symbols indicating whether there is very low, low, moderate, or high confidence in the data. While professional audiences may find these evaluative symbols helpful, lay audiences tend to have difficulty understanding these indicators and the meaning of study quality.19 Further empirical work is needed to determine the most appropriate format for presenting and communicating information about imprecision and study quality to lay audiences. However, given that issues of imprecision and poor study quality may arise when summarizing evidence for decision tools, suggestions for the communication of study quality are provided in Table 2.
Reporting Clinical or Statistical Significance
For many medical interventions, treatment effectiveness is determined not only by statistical significance but also by clinical significance, that is, a statistical significance between two treatments is considered in light of whether that difference is clinically meaningful (e.g., change in pain ratings should be greater than a 15-point difference on a 100-point pain scale). Statistical significance relates to the probability a result is found given the null hypothesis is true. By itself, it does not specify the size of the effect. By contrast, the effect size relates to the strength of the relationship. Effect size can be considered a measure of the clinical significance of a finding, although there are other methods for determining what is a clinically meaningful difference relating to a more practical assessment about how effective an intervention is (e.g., a predetermined value for change in pain ratings on a standardized scale).
While scientific reporting now encourages or requires the reporting of effect sizes alongside statistical significance, guidelines are needed to best understand how to report such information to the public. In Cochrane Systematic Reviews, treatment effectiveness is reported alongside caveats about what would be considered a clinically meaningful difference (e.g., the difference should equal a 30% improvement). While this helps place findings in context for the scientific community, methods for summarizing such data for patients is less clear. Table 2 presents two options for summarizing outcomes when clinical and statistical significance differ, although further empirical work is needed to determine whether a disclaimer that suggests what a meaningful difference would be helps or hinders the interpretation of an effect (Option 1) or whether aggregating or qualifying the effect is more comprehensible (Option 2). Again, consultation with the intended audience will help determine the most appropriate communication option (e.g., Option 1 may be more suitable for expert audiences who are more familiar with the concept of clinical significance).
Reproducibility
A fundamental feature of any risk communication tool is that the numbers reported can be reproduced and made available on request. As a minimum, a documentation record should contain
Reference to all sources
Details of calculations for each outcome, including reference to their sources (e.g., data tables)
Justifications for any decision on summarizing risk data (e.g., no difference summarized as the group average)
Any restrictions applied when extracting or summarizing data (e.g., only used high-quality studies)
Implementations
The Fact Box is a simple and transparent alternative to patient information pamphlets or health brochures, many of which continue to use misleading and nontransparent risk presentations.32 The Fact Box should be able to stand alone as a simple summary of the benefits and harms and not overwhelm the reader with detail. Nevertheless, it is useful to embed the Fact Box in explanatory text to provide context or additional explanation of medical terminology (e.g., see https://www.harding-center.mpg.de/en/health-information/fact-boxes), or used in consultation with a physician to facilitate discussion about health interventions. Alternatively, digital media can be used to provide additional layers of information (e.g., see http://www.aok.de).
The simple Fact Box format can be tailored for use with different audiences who may have different levels of literacy and numeracy. For example, people with low numeracy have difficulties with numbers and may benefit from visual presentations. Online Appendix 4 presents the evidence for prostate cancer screening in an icon array. Icon arrays can facilitate the visual comparison of icons and proportions and can increase understanding of statistical data, particularly for people low in numeracy.33 In a recent study, an icon array design similar to Online Appendix 4 was comparable to the Fact Box on measures of comprehension, risk perception, and decision intentions (McDowell and others, unpublished data).
Conclusions
The Fact Box presents a simple, transparent summary of the most important benefits and harms to help individuals evaluate the effects of health interventions. The advantage of the simple Fact Box format is being increasingly recognized in public health: the Harding Center for Risk Literacy (https://www.harding-center.mpg.de/en) has been collaborating with the Bertelsmann Foundation (https://faktencheck-gesundheit.de) and the AOK, a major German health insurance company (http://www.aok.de), to develop web-based Fact Boxes to inform the public about the benefits and harms of different health interventions. Drug Facts Boxes are also disseminated by Lisa Schwartz and Steven Woloshin through the social mission company Informulary. We hope that the present guide will further the efforts of other health organizations, health insurances, and public health groups to design and promote simple, transparent decision tools for risk communication.
Supplementary Material
Footnotes
GG has received financial support from the Bertelsmann Foundation and the AOK to develop fact boxes. Financial support for this study was provided entirely by the Harding Center for Risk Literacy, Max Planck Institute for Human Development. The funding agreement ensured the authors’ independence in designing the study, interpreting the data, writing, and publishing the report. The following authors are employed by the sponsor: Michelle McDowell, Felix Rebitschek, Gerd Gigerenzer, and Odette Wegwarth.
The online appendix for this article is available on the Medical Decision Making Policy & Practice Web site at http://journals.sagepub.com/doi/suppl/10.1177/2381468316665365.
References
- 1. Gigerenzer G, Gaissmaier W, Kurz-Milcke E, Schwartz LM, Woloshin S. Helping doctors and patients make sense of health statistics. Psychol Sci Public Interest. 2007;8(2):53–96. [DOI] [PubMed] [Google Scholar]
- 2. Trevena L, Zikmund-Fisher B, Edwards A, et al. Presenting quantitative information about decision outcomes: a risk communication primer for patient decision aid developers. BMC Med Inform Decis Mak. 2013;13(suppl 2):S7. [DOI] [PMC free article] [PubMed] [Google Scholar]
- 3. Gotzsche PC, Jorgensen KJ. Screening for breast cancer with mammography. Cochrane Database Syst Rev. 2013;(6):CD001877. [DOI] [PMC free article] [PubMed] [Google Scholar]
- 4. Eddy DM. Comparing benefits and harms: the balance sheet. JAMA. 1990;263(18):2493. [DOI] [PubMed] [Google Scholar]
- 5. National Health and Medical Research Council. How to use the evidence: assessment and application of scientific evidence. Endorsed February, 2000. Available from: http://www.nhmrc.gov.au/_files_nhmrc/publications/attachments/cp69.pdf
- 6. Harris RP, Helfand M, Woolf SH, et al. Current methods of the U.S. Preventive Services Task Force: a review of the process. Am J Prev Med. 2001;20(3, suppl 1):21–35. [DOI] [PubMed] [Google Scholar]
- 7. Sawaya GF, Guirguis-Blake J, LeFevre M, Harris R, Petitti D. Update on the methods of the U.S. Preventive Services Task Force: estimating certainty and magnitude of net benefit. Ann Intern Med. 2007;147(12):871–5. [DOI] [PubMed] [Google Scholar]
- 8. Guyatt G, Oxman AD, Akl EA, et al. GRADE guidelines: 1. Introduction—GRADE evidence profiles and summary of findings tables. J Clin Epidemiol. 2011;64(4):383–94. [DOI] [PubMed] [Google Scholar]
- 9. Guyatt GH, Oxman AD, Santesso N, et al. GRADE guidelines: 12. Preparing summary of findings tables-binary outcomes. J Clin Epidemiol. 2013;66(2):158–72. [DOI] [PubMed] [Google Scholar]
- 10. Schwartz LM, Woloshin S, Welch HG. The drug facts box: providing consumers with simple tabular data on drug benefit and harm. Med Decis Making. 2007;27(5):655–62. [DOI] [PubMed] [Google Scholar]
- 11. Schwartz LM, Woloshin S, Welch HG. Using a drug facts box to communicate drug benefits and harms: two randomized trials. Ann Intern Med. 2009;150:516–27. [DOI] [PubMed] [Google Scholar]
- 12. Woloshin S, Schwartz LM. Numbers needed to decide. J Natl Cancer Inst. 2009;101(17):1163–5. [DOI] [PubMed] [Google Scholar]
- 13. Sullivan HW, O’Donoghue AC, Aikin KJ. Communicating benefit and risk information in direct-to-consumer print advertisements: a randomized study. Ther Innov Regul Sci. 2015;49(4):493–502. [DOI] [PMC free article] [PubMed] [Google Scholar]
- 14. Schwartz LM, Woloshin S. The Drug Facts Box: improving the communication of prescription drug information. Proc Natl Acad Sci U S A. 2013;110(suppl 3):14069–74. [DOI] [PMC free article] [PubMed] [Google Scholar]
- 15. Woloshin S, Schwartz LM. Communicating data about the benefits and harms of treatment: a randomized trial. Ann Intern Med. 2011;155(2):87–96. [DOI] [PubMed] [Google Scholar]
- 16. Bodemer N, Meder B, Gigerenzer G. Communicating relative risk changes with baseline risk: presentation format and numeracy matter. Med Decis Making. 2014;34(5):615–26. [DOI] [PubMed] [Google Scholar]
- 17. Ancker JS, Senathirajah Y, Kukafka R, Starren JB. Design features of graphs in health risk communication: a systematic review. J Am Med Inform Assoc. 2006;13(6):608–18. [DOI] [PMC free article] [PubMed] [Google Scholar]
- 18. Garcia-Retamero R, Okan Y, Cokely ET. Using visual aids to improve communication of risks about health: a review. ScientificWorldJournal. 2012;2012:562637. [DOI] [PMC free article] [PubMed] [Google Scholar]
- 19. Glenton C, Santesso N, Rosenbaum S, et al. Presenting the results of Cochrane Systematic Reviews to a consumer audience: a qualitative study. Med Decis Making. 2010;30(5):566–77. [DOI] [PubMed] [Google Scholar]
- 20. McCormack L, Sheridan S, Lewis M, et al. Communication and Dissemination Strategies to Facilitate the Use of Health-Related Evidence. Rockville (MD): Agency for Healthcare Research and Quality; 2013. [DOI] [PMC free article] [PubMed] [Google Scholar]
- 21. Burton MJ, Glasziou PP. Tonsillectomy or adeno-tonsillectomy versus non-surgical treatment for chronic/recurrent acute tonsillitis. Cochrane Database Syst Rev. 2009;(1):CD001802. [DOI] [PubMed] [Google Scholar]
- 22. Brown P, Ryan R, Yung M, et al. National Prospective Tonsillectomy Audit. London: Royal College of Surgeons of England; 2005. Available from: http://www.rcseng.ac.uk/surgeons/research/surgical-research/docs/NationalProspectiveTonsillectomyAuditFinalReport2005.pdf/view [Google Scholar]
- 23. Centers for Disease Control and Prevention. Antibiotic/anti bmicrobial resistance. Updated June 22, 2015. Available from: http://www.cdc.gov/drugresistance/index.html
- 24. Bellamy N, Campbell J, Robinson V, Gee T, Bourne R, Wells G. Viscosupplementation for the treatment of osteoarthritis of the knee. Cochrane Database Syst Rev. 2006;(2):CD005321. [DOI] [PMC free article] [PubMed] [Google Scholar]
- 25. McAlindon TE, Bannuru RR, Sullivan MC, et al. OARSI guidelines for the non-surgical management of knee osteoarthritis. Osteoarthritis Cartilage. 2014;22(3):363–88. [DOI] [PubMed] [Google Scholar]
- 26. Rutjes AW, Juni P, da Costa BR, Trelle S, Nuesch E, Reichenbach S. Viscosupplementation for osteoarthritis of the knee: a systematic review and meta-analysis. Ann Intern Med. 2012;157(3):180–91. [DOI] [PubMed] [Google Scholar]
- 27. Han PK. Conceptual, methodological, and ethical problems in communicating uncertainty in clinical evidence. Med Care Res Rev. 2013;70(1 suppl):14s–36s. [DOI] [PMC free article] [PubMed] [Google Scholar]
- 28. Han PK, Klein WM, Lehman TC, Massett H, Lee SC, Freedman AN. Laypersons’ responses to the communication of uncertainty regarding cancer risk estimates. Med Decis Making. 2009;29(3):391–403. [DOI] [PMC free article] [PubMed] [Google Scholar]
- 29. Politi MC, Clark MA, Ombao H, Dizon D, Elwyn G. Communicating uncertainty can lead to less decision satisfaction: a necessary cost of involving patients in shared decision making? Health Expect. 2011;14(1):84–91. [DOI] [PMC free article] [PubMed] [Google Scholar]
- 30. Han PKJ, Klein WMP, Arora NK. Varieties of uncertainty in health care: a conceptual taxonomy. Med Decis Making. 2011;31(6):828–38. [DOI] [PMC free article] [PubMed] [Google Scholar]
- 31. Balshem H, Helfand M, Schünemann HJ, et al. GRADE guidelines: 3. Rating the quality of evidence. J Clin Epidemiol. 2011;64(4):401–6. [DOI] [PubMed] [Google Scholar]
- 32. Gigerenzer G. Breast cancer screening pamphlets mislead women. BMJ. 2014;348:g2636. [DOI] [PubMed] [Google Scholar]
- 33. Garcia-Retamero R, Cokely ET. Communicating health risks with visual aids. Curr Directions Psychol Sci. 2013;22(5):392–9. [Google Scholar]
Associated Data
This section collects any data citations, data availability statements, or supplementary materials included in this article.