

Abstract
T-REX (targetable reactive electrophiles and oxidants) enables electrophile targeting in living systems with high spatiotemporal precision and at single-protein-target resolution. T-REX allows functional consequences of individual electrophile signaling events to be directly linked to on-target modifications. T-REX is accomplished by expressing a HaloTagged protein of interest (POI) and introducing a Halo-targetable bioinert photocaged precursor to a reactive electrophilic signal (RES). Light exposure releases the unfettered RES on demand, enabling precision modification of the POI due to proximity. Using alkyne-functionalized 4-hydroxynonenal (HNE) as a representative RES, this protocol delineates optimized strategies to (1) execute T-REX in live human cells and C. elegans, (2) quantitate the POI’s RES-sensitivity by either azido-fluorescent-dye conjugation or (3) enrich using biotin-azide/streptavidin pulldown procedure in both model systems, and (4) identify the site of RES-labeling on the POI using proteomics. Built-in T-REX controls that allow users to directly confirm on-target/on-site specificity of RES-sensing are also described.
Keywords: Redox signaling, electrophile modifications, T-REX, C. elegans, 4-hydroxynonenal, HaloTag
INTRODUCTION
The study of redox signaling in living models is a rapidly expanding field (Long, Poganik, Ghosh, & Aye, 2017). Various powerful chemical biology toolsets comprising small-molecule- and protein-based fluorescent reporters and proteomics profiling methods have documented context-specific redox-sensor proteins and pathways, both in regulating physiology and supporting specific disease states (Bogdanova, Schultz, & Belousov; Brewer, Garcia, Onak, Carroll, & Chang, 2015; Jacobs & Marnett, 2010; Long, Poganik, et al., 2017; Weerapana et al., 2010). Despite these significant advances, we fall short in drawing a direct link between these modifications and function in the context of a living system. Recent studies that have begun to address this knowledge gap indicate that redox modification of a single protein elicits signaling, underscoring the importance of precision in interrogating these individual chemical signaling events and how they drive function (Fang et al., 2013; Lin, Haegele, Disare, Lin, & Aye, 2015; Long & Aye, 2016, 2017; Long, Lin, et al., 2017; Long, Parvez, et al., 2017; Long, Poganik, & Aye, 2016; Long, Poganik, et al., 2017; Long, Urul, et al., 2017; Parvez et al., 2015; Parvez et al., 2016). This manuscript describes a detailed protocol to accomplish T-REX (targetable reactive electrophiles and oxidants) in living human cells (Fang et al., 2013; Lin et al., 2015; Long, Lin, et al., 2017; Long, Parvez, et al., 2017; Parvez et al., 2015; Parvez et al., 2016; Zhao, Long, Wang, Zhang, & Aye, 2018) and a powerful model organism, C. elegans (Long, Urul, et al., 2017). With this protocol, the extent to which a protein is modified by reactive electrophilic species (RES) can be calculated and the RES-labeling site can be determined using proteomics. This protocol can be coupled to downstream assays, including various reporter assays (ARE luciferase and ARE GFP (Parvez et al., 2016)) and fluorescence resonance energy transfer (FRET (Long, Parvez, et al., 2017; Parvez et al., 2016)).
Lipid-derived electrophiles (LDEs, figure 1C) are known for their general reactivity and cytotoxic nature, especially under bolus conditions (Jacobs & Marnett, 2010; Schopfer, Cipollina, & Freeman, 2011). However, recent years have shown that nature deploys LDEs as small signaling mediators to regulate myriad non-enzyme catalyzed post-translational modification (PTM) events, which are essential for maintaining cellular homeostasis (Long & Aye, 2016; Schopfer et al., 2011). 4-hydroxynonenal (HNE, figure 1B) will be used as a representative LDE in this protocol. Emerging data indicate that LDEs can sub-stoichiometrically label specific cysteines on redox-sensor proteins, which in turn elicit phenotypically-dominant redox or other functional responses in a living cell or organism (Long & Aye, 2017). The ability to selectively perturb a specific protein of interest (POI) with a select reactive electrophilic signal (RES) in native settings at user-controlled time, locale, and POI/RES pair (Fang et al., 2013; Lin et al., 2015; Long & Aye, 2016, 2017; Long, Lin, et al., 2017; Long, Parvez, et al., 2017; Long et al., 2016; Long, Poganik, et al., 2017; Long, Urul, et al., 2017; Parvez et al., 2015; Parvez et al., 2016; Zhao et al., 2018) has altered the way that RES signaling pathways can be studied with surgical precision. The current conventional method to study RES biology in living models is bulk exposure of the organism to RES. The approach involves flooding the biological specimens with a RES of interest and attempts to parse specific consequences of a single POI–RES modification by combining this with classical genetic knockdowns and/or biochemical cysteine-mutagenesis strategies. Under these uncontrolled conditions, with no resolution in space and time, non-physiological proteins are typically modified. The covalent nature of the LDE adduction means that off-target effects accrue with time in an unpredictable manner for a given RES/context. Because these RES-modification events are largely non-enzymatic (Long & Aye, 2016), the gold-standard targeted-knockdown approaches in combination with bolus RES dosing are unable to address functional sufficiency of on-target redox modifications. The fact that many RES-sensor proteins house multiple functionally-redundant cysteines also limits the mutagenesis strategies in associating a specific RES-chemotype/sensor-target to a specific function in a signaling context. Given the heightened appreciation of covalent pharmaceuticals (Johnson, Weerapana, & Cravatt, 2010; Long & Aye, 2017), understanding the precise ramifications of specific POI–RES target engagement is increasingly important.
Figure 1. T-REX outline.
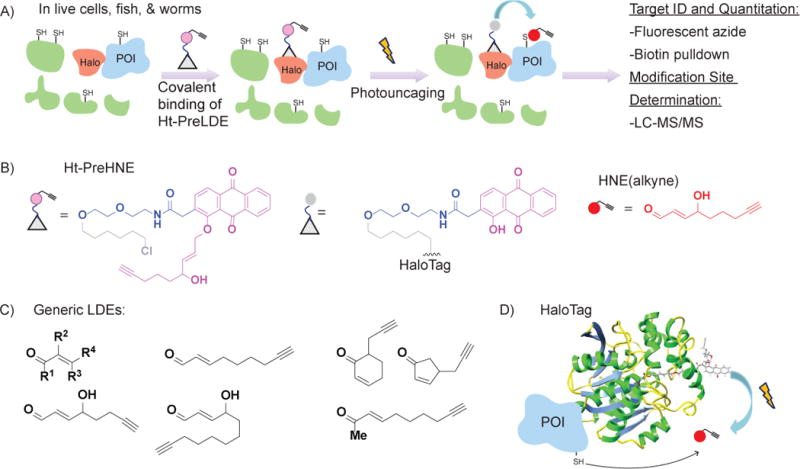
A) Outline of T-REX workflow. Upon light shining, reactive signal (HNE, red dot) is released and reacts with the POI due to proximity. Analyses include calculating targeting efficiency and modification site determination. B) Chemical structure of unbound Ht-PreHNE (left) and Ht-PreHNE bound to HaloTag after light shining (middle). The HNE(alkyne) released (right) upon light shining is shown as red circle. C) The generic LDE structure as well as several LDEs that have been used with T-REX are shown. D) An illustrative model of N-terminal HaloTagged POI with the photocaged-precursor, Ht-PreHNE, bound at Halo. Ribbon structure is adapted from PDB:1J7D. The conditions used for photouncaging of the LDE (red dot) are shown.
This protocol presents detailed procedures to perform live-cell-based and live-worm-based T-REX, an approach that allows for labeling of a single protein with spatiotemporal resolution. This protocol will allow for the calculation of targeting efficiency of the POI with a given RES. It is our hope that through this protocol, mainstream chemical biologists as well as model organism scientists with need and interest to interrogate complex redox pathways will begin to exploit this complementary tool that enables precision redox responses to be studied in living cells and animals.
Briefly, T-REX utilizes a HaloTag protein (Los et al., 2008) fused to the POI such that the resultant fusion protein houses a TEV-protease cleavable linker between the HaloTag and POI. The HaloTag covalently reacts with hexyl chloride, a functional group that is inert to other biomolecules in living systems (fish (Long, Parvez, et al., 2017; Zhao et al., 2018), worms (Long, Urul, et al., 2017), cells (Fang et al., 2013; Lin et al., 2015; Long, Lin, et al., 2017; Long, Parvez, et al., 2017; Long et al., 2016; Parvez et al., 2015; Parvez et al., 2016; Zhao et al., 2018)). T-REX small-molecule probes integrate a hexyl chloride-tethered photocaged RES, termed Ht-PreLDE (Lin et al., 2015; Long, Lin, et al., 2017) for Halo-targetable precursor to lipid derived electrophiles (figure 1B). When this bioinert and cell-permeable T-REX probe is introduced to live cells or worms expressing the POI, and excess probe rinsed away, the HaloTag brings the photocaged RES into proximity of the POI. Exposure of the cells or organisms briefly (5-8 min) to low-energy UV light rapidly releases the RES (t1/2 =1−2 min (Lin et al., 2015)). Because close to endogenous levels of RES is released (stoichiometric to HaloTag), the portion of RES not captured by the POI in the quasi-intramolecular reaction is averaged over the entire proteome, resulting in no significant perturbation to the living models. Nevertheless, various built-in T-REX controls (Long, Parvez, et al., 2017; Parvez et al., 2016) as we detail below allow users to account for any potential off-target consequences and ensure unbiased data/conclusions using T-REX. This method, illustrated in figure 1A, gives spatial and temporal control previously unattainable by bulk-RES-exposure methods.
Notably, contrasting the current paradigm involving excess RES administration from outside cells/animals, T-REX sets up a competition between off-rate (i.e., the rapidly-delivered RES diffusing away from the HaloTagged POI) and a rapid covalent binding between POI and RES. The conditions of T-REX constitute kcat/Km-type conditions. If successful labeling of POI is achieved under the electrophile-limited conditions enabled by T-REX settings, we ascribe these POIs as “kinetically-privileged” RES-sensors. This platform presents the only method to directly monitor functional responses of a low-occupancy (i.e., sub-stoichiometric) modification in a largely unperturbed cellular backdrop. Because of this kinetic and occupancy privilege, the results also inform the users about efficiency and specificity of individual RES-target POI engagement in vivo, while avoiding issues associated with low RES-uptake/metabolism/distribution and toxicity/promiscuity in the conventional bolus dosing methods.
Basic Protocols 1 and 2 give the steps necessary to perform T-REX in live cells and worms, respectively, with user-defined selection for RES chemotype, POI, time, and space. Basic Protocol 3 details how to quantify the targeting efficiency at which the POI is modified by use of an azido-fluorescent dye. Basic Protocols 4 and 5 give instruction to enrich labeled protein and calculate the enrichment of the POI in cells and worms. Basic Protocol 6 outlines a proteomics method for determining specific labeling sites following cell-based T-REX method.
STRATEGIC PLANNING
Choosing a POI
In essence, with T-REX set-up, any POI can be tested simultaneously for (1) sensitivity for a given RES and (2) responsivity (i.e., ability/sufficiency of low-occupancy RES-modification on that POI to elicit signaling response). Before beginning to make constructs or perform T-REX on a new POI, many factors should be considered. The given POI must be compatible with HaloTag, as described below in the “Making HaloTagged POI Constructs” section. In terms of selecting a POI to test, the POI would typically have been implicated or suspected of being a possible RES sensor. T-REX was originally developed with an aim to address the major technological gap in the field, namely, the ability to directly and precisely link individual RES modifications to function in the context of a cell. Thus, choice of a POI is unlimited and can be any protein which researchers hypothesize to be playing some role in redox-linked pathways. For instance, a POI could arise from one protein/pathway-focused genetic/biochemical studies wherein its potential redox-linked role may be able to explain some of the observed data. Alternatively, POIs can also arise from redox-focused studies, such as proteomics-based target capture experiments following whole-cell treatment with a given RES or a covalent drug.
However, our recent work on T-REX POI screens show that many top-scoring enriched targets stemming from bolus HNE dosing and proteomics profiling experiments fail to feature privileged HNE-sensitivity under T-REX conditions when RES are presented in controlled settings in situ (basal concentration, short time, etc.) (Long, Parvez, et al., 2017). This finding motivated us to develop a more high-throughput and genome-scale approach, global reactive electrophiles and oxidants, (G-REX) (Zhao et al., 2018) to discover privileged sensors from controlled in situ RES delivery. From the “POI choice” point-of-view, G-REX—unlike T-REX screen—sidesteps the need to have a postulated sensor POI in mind.
As cysteine is known to be the most reactive amino acid towards RES (Doorn & Petersen, 2002; Higdon, Landar, Barnes, & Darley-Usmar, 2012), cysteine containing proteins are the most likely sensor candidates, so it is best to choose proteins containing cysteine. From the aspect of protein structure, the sensing cysteine is not necessarily on the surface (Hellberg et al., 2010). It could be buried inside the POI (Hellberg et al., 2010; Zhao et al., 2018) or in flexible loop regions of proteins, which may allow for more productive covalent bond formation (Long & Aye, 2017; Long, Parvez, et al., 2017). This aspect is an especially important consideration since conditions used for structural studies (X-ray crystallography, NMR, etc.) are not reflective of true in vivo scenarios (e.g., protein-protein association networks, redox state of cellular microenvironments, etc.). As such, conformation or dynamics of these RES-responsive POIs, including orientation of cysteine residues, are not always easily recapitulated in vitro. Given the ease of T-REX set-up in live cultured cells, it is recommended to first test RES-sensitivity and responsivity using T-REX in cells after verifying that the HaloTag doesn’t disrupt the function of the non-tagged POI (see “Making HaloTagged POI Constructs” for discussion).
Choosing a Model System
T-REX is compatible with E. coli, HEK-293T cells, COS-7 cells, HeLa cells, C. elegans (worms) over whole life span, and D. rerio (zebrafish) at embryonic stage. Although all successful T-REX probes reported thus far (Lin et al., 2015) are permeable, stable, non-toxic and compatible with Halo-POI transgenes expressed in these systems, the probes are limited to low-energy UV-light-driven photouncaging. Therefore, the model system must be (1) transparent to allow for the light-promoted uncaging of the probe and (2) genetically tractable to allow expression of the Halo-POI. C. elegans are transparent throughout their lifespan and D. rerio are transparent at the embryo stage, allowing for both uncaging of T-REX probes and use of fluorescent reporters for imaging studies of downstream responses. To express the Halo-POI fusion protein, E. coli can be transformed with plasmid DNA encoding Halo-POI under an inducible promoter (Parvez et al., 2016), mammalian cells can be transfected with plasmid DNA encoding Halo-POI for transient expression (Basic Protocol 1) (Fang et al., 2013; Long, Lin, et al., 2017; Long, Parvez, et al., 2017; Parvez et al., 2016; Zhao et al., 2018) or be engineered for stably-integrated expression of the fusion protein (Lin et al., 2015; Parvez et al., 2015), transgenic C. elegans lines can be generated to express the fusion protein after heat shock (Basic Protocol 2) (Long, Urul, et al., 2017), and D. rerio can be injected with mRNA encoding the Halo-POI at 1−4 cell stage to transiently express the fusion protein (Long, Parvez, et al., 2017; Zhao et al., 2018). A system that does not manifest these aspects of transparency and genetic tractability is not currently compatible with T-REX. Future development of two-photon T-REX probes promise to address the limitation concerning requirement of transparent animals.
Depending on downstream analysis/signaling system of interest, different model systems offer different advantages. C. elegans are a very powerful model system for studying stress and aging in a whole organism. HEK-293T, COS-7, and Hela cells, which are widely used in biology and medicinal studies, offer an easily accessible and comparable platform to screen POIs with T-REX (Long, Parvez, et al., 2017). HEK-293T cells are selected in this protocol because they grow quickly and have high transfection efficiencies compared to COS-7 and HeLa cells, making them relatively easy to use for T-REX screens. Although POI expression levels do not affect T-REX targeting and labeling efficiency (Long, Parvez, et al., 2017; Parvez et al., 2016), low POI levels can lead to difficulty in the detection of labeling in analysis assays, such as Cy5 fluorescence (Basic Protocol 3). It is recommended to perform pilot studies in a cell culture system prior to transitioning into a model organism due to the amount of time and labor needed to make a transgenic model organism.
Making HaloTagged POI constructs
For use in mammalian cells (Fang et al., 2013; Lin et al., 2015; Long, Lin, et al., 2017; Long, Parvez, et al., 2017; Parvez et al., 2015; Parvez et al., 2016; Zhao et al., 2018)
The commercial availability of functionally-validated Halo-fusion ORF library of 20,000 mouse and human genes offers ready access to mammalian expression plasmids encoding individual Halo-POI fusion of mice and human origin. However, before beginning to perform T-REX on a new Halo-POI, we recommend that users evaluate the functionality/activity of each fusion protein on a case-by-case basis to ensure that tagging does not interfere with native function of the POI. In other words, the Halo-POI fusion protein should behave similarly to the non-tagged POI. For instance, cellular localization and affinity to its native binding partner (Fang et al., 2013; Lin et al., 2015; Parvez et al., 2015; Parvez et al., 2016); cellular kinase activity (Long, Parvez, et al., 2017); and in vitro ubiquitination activity (Zhao et al., 2018) have been used to validate fusion protein functionality for Keap1, Akt, and Ube2V2 proteins as POI, respectively. In the case of Keap1, POI functionality has also been tested with HaloTag fusion at the N- or C-terminus of Keap1, both of which preserve Keap1 cellular localization and binding to its native binding partner in cells (Parvez et al., 2016). It is worth noting that T-REX targeting efficiency and residue specificity are not affected by tag orientation, consistent with the “encounter complex” model of T-REX following rapid release of a diffusible RES to POI’s microenvironment (Lin et al., 2015; Parvez et al., 2016).
Plasmid constructs encoding the HaloTagged POI with a TEV cleavable linker in between HaloTag and POI are used. The TEV cleavage sequence is ENLYFQ/G, with the cleavage occurring between Q and G. In this protocol, the pCS2+8 vector is used as an example, but we have successfully deployed various vectors, namely, pFN21a, pMIR, pCS2+, and pcDNA3. The promoter should also be considered when designing the plasmid. The vectors utilize a CMV IE94 promoter, which gives strong constitutive expression in mammalian cells. The level of POI expression will not bias the intrinsic RES-sensitivity of the POI as T-REX is a quasi-intra molecular type reaction, as evidenced by a lack of labeling in the split control system (figure 2) when T-REX is replicated in cells expressing HaloTag and POI as two independent proteins, vide infra. However, a low level of protein expression will limit the detection of the protein in the analysis stages. Also, for the convenience of western blot (WB) or immunofluorescence (IF) related assays, an epitope tag (FLAG or HA) should be inserted either at the N-terminal end following TEV cleavage site and before POI, or at the C-terminal end of the POI. The positioning of the tag in this way allows for the POI to be detectable by the epitope tag before and after TEV cleavage (see table 1). Figure 2A shows a representative plasmid construct using Keap1, an established RES-sensor protein, as an example POI, with N-terminal HaloTag and HA tag on C-terminus of Keap1.
Figure 2. Plasmids Construction and Design.
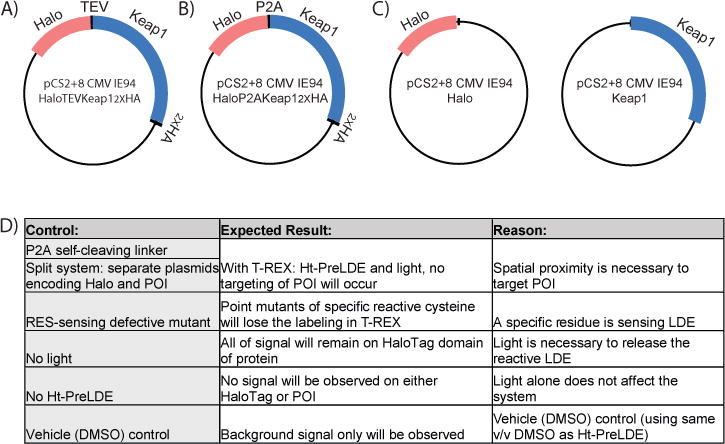
A) pCS2+8-HaloTevKeap1HA plasmid used for T-REX, includes an HA epitope tag on Keap1, allowing for enhanced detection during analysis. B) T-REX split control 1: pCS2+8-HaloP2AKeap1HA uses P2A, a self-cleaving linker, to produce HaloTag and Keap1 separately. C) T-REX split control 2: Two plasmids (pCS2+8-Halo and pCS2+8-Keap1), each expressing either HaloTag or POI, are cotransfected into the system, leading to separately expressed HaloTag and Keap1. D) Outline of various built-in controls of T-REX along with expected outcomes of each control.
Table 1. Preferred Antibodies and Dilutions.
Preferred antibodies with optimized dilutions for cell experiments (and worm experiments, if different, in parentheses). Blots are incubated for 2 hours at room temperature or overnight at 4 °C (may need to be optimized based on particular conditions). Mouse or rabbit perform similarly for anti-Halo; specific choice for mouse versus rabbit is made in consideration of other antibodies being used for a specific blot, to avoid cross reactivity. It is recommended to use the most sensitive antibody when doing biotin pulldown or if protein expression is low.
| Antibody | Catalog number; Supplier | WB Dilution |
|---|---|---|
| Mouse monoclonal anti-β-Actin | A4700; Sigma | 1:30,000 (1:5,000−1:10,000) |
| Mouse monoclonal anti-Halo | G921A; Promega | 1:2,000 (1:1,000) |
| Rabbit polyclonal anti-Halo | G9281; Promega | 1:2,000 (1:1,000) |
| Mouse monoclonal anti-Keap1 | Ab119403; Abcam | 1:1,000 |
| Rat monoclonal anti-HA HRP conjugated | 11867423001; Sigma | 1:1,000 |
| Mouse monoclonal anti-Flag M2 | F1804; Sigma | 1:3,000 |
| Rabbit polyclonal anti-DYKDDDDK (Flag) | PA1-984B; Fisher | 1:3,000 |
| Secondary antibody to mouse IgG, HRP linked | Ab6789; Abcam | 1:5,000 |
| Secondary antibody to rabbit IgG, HRP linked | 7074; Cell Signaling Technology | 1:5,000 |
For use in worms (Long, Urul, et al., 2017)
Transgenic lines must be generated to use C. elegans for T-REX. In this protocol, the transgenic lines utilize a heat shock promoter to allow for inducible expression giving high protein-expression levels of POI after a 1 hour treatment at 37 °C. The transgenic lines must produce a HaloTagged POI with a TEV cleavable linker, as in mammalian cells. For model organism work such as in C. elegans, lack of accessibility to good orthogonal antibodies to the transgene (POI) may limit the choice of POI. However, this can be overcome by judicious placement of an epitope tag (e.g., HA or FLAG) within the Halo-POI construct (Long, Urul, et al., 2017). The placement of the epitope tag should be considered in the same manner as the mammalian plasmid generation. Standard microinjection protocols (described in detail in Basic Protocol 2 and figure 3) can be used to generate transgenic lines.
Figure 3. Generation of transgenic worm lines.
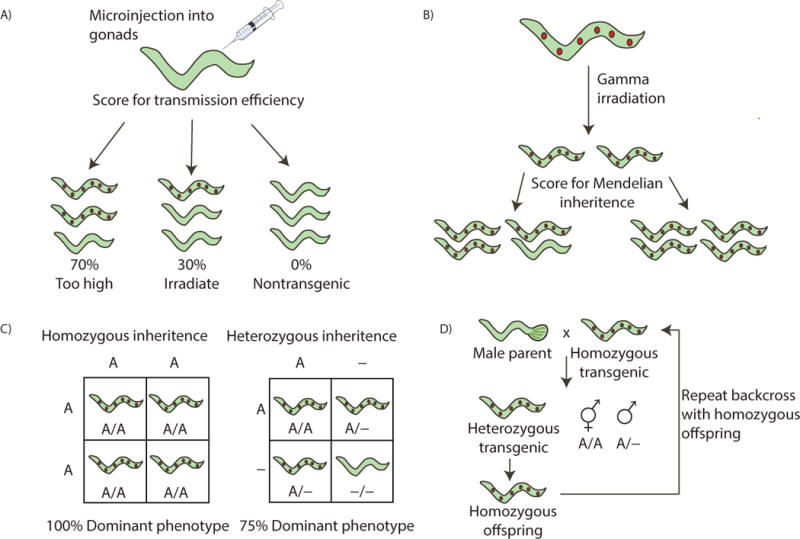
A) Microinjection of the dominant phenotype marker (mec7::mrfp, which causes constitutive expression of mRFP in 6 touch receptor neurons in the worm, shown as red dots) and Halo-POI (under heat shock promoter) plasmids into hermaphrodite worms leads to transgenic worms with various rates of transmission. Transmission efficiency can be determined by observing the percent transgenic offspring. B) Using transgenic worms with ~30% transmission efficiency, gamma irradiation is performed to integrate the plasmids into the genome, resulting in progeny that display Mendelian inheritance. C) Mendelian inheritance patterns for homozygous and heterozygous dominant phenotypes. The inheritance of the dominant phenotype marker is 100% or 75%, respectively. D) Backcrosses are performed with homozygous transgenic worms and male parent worms, giving heterozygous offspring that display Mendelian inheritance. Other possibilities of offspring include homozygotes hermaphrodites (A/A) from self-fertilization and heterozygote males (A/-). The two types of transgenic hermaphrodites can be distinguished by scoring the transmission, and only homozygous offspring of heterozygous transgenic worms should be used.
Considering Scale and Controls of the Experiment
For use in mammalian cells
The scale of the experiment must be carefully considered before beginning. If attempting MS analysis (Basic Protocol 6), a larger quantity (ideally 5–10 μg, instrument dependent) of POI enriched from cells treated with T-REX is desired. T-REX can be performed, the HaloTagged POI purified by affinity pulldown, the sample run on SDS-PAGE, stained with Coomassie or Sypro Ruby, the band excised, and in-gel digestion and LC-MS/MS performed. If performing fluorescent dye Click (Kolb, Finn, & Sharpless, 2001) quantitation (Basic Protocol 3) or Streptavidin-biotin enrichment (Basic Protocol 4), less protein may be required to obtain results (20 μg of whole-cell lysate for Click, 500 μg for biotin enrichment). Generally, HEK-293T cells give 0.5—0.75 mg of lysate protein per 25 cm2 plate, which corresponds to approximately 2.5—3.5 × 10⁶ cells.
Additionally, the number of control samples must be carefully considered. There are multiple negative controls in T-REX, namely, no light, no Ht-PreLDE, compound, and no light & no Ht-PreLDE (i.e., DMSO only, figure 2D). Additionally, a split system control can be used to show that targeting occurs only when HaloTag is fused to the POI. This can be done utilizing a P2A self-cleaving linker (P2A sequence is ATNFSLLKQAGDVEENPGP) between the HaloTag and the POI, or by transfecting cells with HaloTag and the POI on separate plasmids. RES-sensing defective mutants (CS mutants) that have serine instead of the sensing cysteine also can be used to show that labeling occurs selectively on the cysteine of the POI. Before attempting to study these mutants with T-REX, functionality should be confirmed to ensure that there are no major differences between wild type and the cysteine to serine or alanine mutants. Controls should be performed as appropriate and will be discussed in the following sections.
For use in worms
The same considerations of scale apply to worm analysis. The volume of worm pellet is used for estimated amount of worms needed rather than number of worms, as this is easier to track and predict. The amount needed for Cy5 Click (Basic Protocol 3) is generally 1 × 10cm plates and the amount for biotin pulldown (Basic Protocol 5) is 5 × 10 cm plates. Each plate gives approximately 100 μL of worms, which is generally between 0.3—1.2 mg of protein.
Control considerations are similar, although with worms a non-induced control (no heat shock) should also be used.
BASIC PROTOCOL 1: TRANSFECTION AND T-REX IN LIVE MAMMALIAN CELLS
This protocol gives the steps to perform T-REX in mammalian cells. Additional protocols below give multiple methods of analysis. The cells are transfected with a plasmid encoding HaloTagged POI and after allowing the cells to express the protein, the bioinert photocaged precursor is introduced which binds to HaloTag, excess rinsed away, and light shined on the sample to release the RES, enabling proximity-directed POI modification.
The transfection and subsequent treatment can be done in an array of plate sizes, but for this protocol, a 60 mm diameter dish will be used as an example. Alkyne-functionalized 4-hydroxynonenal alkyne (HNE) will be used as the representative native RES (figure 1B). The Halo-targeted photocaged HNE alkyne is referred to as Ht-PreHNE and includes an alkyne moiety to allow for Click coupling in the analysis steps (specifically for quantitation of the extent of POI modification). This alkyne modification is dispensable for downstream functional studies (Lin et al., 2015; Long, Lin, et al., 2017; Long, Parvez, et al., 2017; Parvez et al., 2015; Parvez et al., 2016), thus T-REX recapitulates a traceless delivery of an authentic endogenous RES in vivo.
Materials
HEK-293T cells (ATCC, cat. no. CRL-1573)
Complete media with antibiotics (see recipe)
Linear polyethyleneimine transfection solution (PEI, see recipe)
MEM media (transfection media, ThermoFisher cat. no. 11095080)
Plasmid: containing appropriate construct with a determined concentration (empty pCS2+8 Addgene, # 34931)
Rinse media (see recipe)
Ht-PreHNE solution (see recipe)
TrypLE Express Enzyme (ThermoFisher cat. no. 12605028)
Dulbecco’s Phosphate Buffered Saline (ThermoFisher cat. no. 14190144)
Cell lysis buffer (see recipe)
1X Bradford Reagent (Bio-Rad, cat. no. 5000205)
2 mg/mL BSA standard solution (Pierce, cat. no. 23209)
Biological safety cabinet
Tissue culture dishes (60 mm diameter, VWR, cat. no. 430166)
Tissue culture incubator (37 °C, 5% CO2)
Automated cell counter or hemocytometer
4°C micro centrifuge
UV lamp with 365 nm light, 5 mW/cm2 (e.g. Spectroline XX-15N)
Handheld UV power detector (Spectroline, cat. no. XDS-1000)
Absorbance plate reader (595 nm absorbance for Bradford assay)
Transfect cells and perform T-REX
-
1Grow up HEK-293T cells in complete media. Mix 9 μL of a 1 mg/mL PEI solution and 3 μg of plasmid DNA with 200 μL of transfection MEM media per plate. Mix well but gently and incubate the plasmid solution 15 minutes at room temperature, then mix well but gently once again and add the solution dropwise to the plate. Return plate to incubator.
- Cells should be plated 18–24 hours before transfection. Cell density at the point of transfection is very important. Cells should be approximately 70% confluent at the point of transfection (2.24 × 10⁶ cells per 60 mm diameter plate). Cells can be counted using a hemocytometer or automated cell counter and Trypan blue and then plated at an appropriate density.
- The optimal amount of plasmid and the transfection time need to be determined in order to ensure maximum transfection efficiency.
-
2
Change the media to fresh complete media 8 hours post transfection to remove PEI. Return plate to incubator.
-
336–48 hours post transfection, prepare a solution of Ht-PreHNE in rinse media. The final concentration should be 15 μM in rinse media with the DMSO vehicle content less than 0.1%. For the negative controls with no Ht-PreLDE, use rinse media with an equal amount of DMSO per mL added. Carefully remove the complete media from the plate and replace it with the Ht-PreHNE or control media. Return the plates to the incubator for two hours.
- From this point on, perform all work in dim light or dark room setup to avoid inadvertent uncaging of the Ht-PreHNE alkyne from stray light.
- Depending on confluence, T-REX can be performed as early as 24 hours post transfection, although best results are obtained at 36 hours.
- However, it is important that the cells do not overgrow before T-REX is started, as this leads to cell death and less healthy cells expressing the POI. If this is a continued problem, consider transfecting at a lower cell density (45–50% confluent).
-
4After two hours, remove the Ht-PreHNE and replace with fresh rinse media. Incubate 30 minutes at 37 °C and repeat, for a total of 3 washes over 1.5 hours.
- In these steps, it is important to not disturb the adhered cells, as this lowers protein yield. Pipette the media slowly onto the side of the plate. Marking the plate and always removing and adding media at the same point reduces cell disruption.
-
5After the last rinse and incubation, for plates exposed to light, remove the lid of the dish and place under a 365 nm UV lamp about 5 cm above the samples for 8 minutes at room temperature to uncage the Ht-PreHNE.
- A shorter exposure of light or a lower powered light can be used if the light is too powerful. In this protocol, a 5 mW/cm2 lamp power is adjusted for use, but the power can be reduced if needed. The lamp must be pre-warmed for at least five minutes prior to use, or until a stable light power is emitted. A handheld detector can be used to ensure the power of the lamp is as expected.
-
6
Incubate the cells for a further 5 minutes at 37 °C, then harvest the cells by adding 0.5 mL 37 °C Trypsin per plate. Incubate 5 minutes at 37 °C, quench the trypsin with addition of 1 mL of rinse media, and collect the cells.
-
7
Centrifuge 10 minutes at 3,000 × g, 4 °C. Resuspend the pellet in 1 mL 4 °C PBS by pipetting to wash and centrifuge again using the same conditions. Repeat this for a total of 2 washes. After the last spin, ensure full removal of the supernatant and flash freeze the pellets in liquid nitrogen.
-
8
Cells can immediately be used for any of the following assays, or they can be stored in −80 °C for up to three days.
Lyse the Cell Pellets
-
9
Thaw the cell pellets on ice, shielding from light. Resuspend each in 75 μL of ice cold lysis buffer. Lyse the cells by flash freezing them in liquid nitrogen and rapidly thaw. Repeat the freeze thaw cycle 3 times.
-
10Centrifuge 10 minutes at 20,000 × g, 4 °C. Remove the supernatant into a clean, pre-chilled tube. Determine the protein concentration by Bradford assay using BSA as a standard. Use the lysates immediately.
- Generally, 1 μL of lysate into 1 mL of Bradford reagent gives an absorbance at 595 nm within the linear range. Avoid high surfactant content, as this interferes with proper Bradford readout.
BASIC PROTOCOL 2: TRANSGENIC LINE GENERATION AND T-REX IN C. ELEGANS
C. elegans are a useful model for utilizing T-REX, as they maintain transparency throughout life and are extremely well characterized. Much like cells, the worms must be able to express a HaloTagged POI for use in T-REX (Long, Urul, et al., 2017). Transgenic worms with no deleterious mutations must be generated. C. elegans can proliferate by self-fertilization of hermaphrodites or by cross-fertilizing hermaphrodites with male worms (Bahrami & Zhang, 2013). By microinjection of the expression plasmid and dominant marker plasmid (to confirm proper integration of the plasmids; here we use Mec7::mRFP, but others, such as rol-6 or Myo2::DSRED would likely work), transgenic worms carrying the desired extrachromosomal array can be visualized. Individual hermaphroditic transgenic worms should be placed on separate plates and scored for transmission. Worms with high transmission (>30 %) should be selected for propagation. These worms can be maintained indefinitely, but require constant picking to maintain the line. In the absence of artificial selection, wild type worms dominate and the line can be lost. By sub-lethal irradiation with gamma-irradiation, the extrachromosomal arrays can be integrated into the genome (Yoshina, Suehiro, Kage-Nakadai, & Mitani, 2016). It is best to use arrays with 25–35% transmission for this experiment. Post irradiation and expansion, single worms should be screened for 75% (integrated heterozygous; requires selection of progeny and screening for 100% transmission) or 100% (integrated homozygous) transmission (figure 3). After homozygous lines have been selected, backcrosses with Bristol N2 (Vogel, 2009) are performed with the parent strain, and worms displaying Mendelian inheritance of the dominant phenotype with no deleterious mutations are selected for. Several backcrosses are performed and homozygous transgenic worms are recovered for use. HaloKeap1 worms will be available from the C. elegans genetics center.
In this protocol, HNE will be used as the representative RES (utilizing Ht-PreHNE as the photocaged precursor) and worms will express HaloTagged Keap1 upon heat shock induction. The worms will subsequently be lysed and the targeting of the POI confirmed by both Cy5 azide fluorescent quantification and biotin enrichment.
Materials
Wild type worms (Bristol N2)
Nematode growth medium plates (see recipe)
Halo::tev::keap1 plasmid with C. elegans heat shock promoter (HSP8)
Mec7::mRFP dominant marker plasmid expressing mRFP under the Mec7 promoter
Recovery media (see recipe)
S-Complete media (see recipe)
2× OP50 solution (see recipe)
10× Ht-PreHNE (see recipe)
50 mM HEPES buffer (pH 7.6)
Worm lysis buffer (see recipe)
Incubators for worm maintenance (17° or 20° C, depending on desired growth rate) and heat shock (37 °C)
Microloader tips (Eppendorf, cat. no. 5242956003)
Zirconia beads (0.7 mm diameter, BioSpec Products)
Swinging bucket rotor (with adaptor for 15 mL conical tube)
Generate Transgenic Lines in Worms
-
1
Pick 3−4 healthy L4 worms and place on a fresh worm plate with OP50. Allow to grow 5–7 days to the second generation. There should be many young adults on the plate.
-
2
Prepare 2% agarose pads for injection at least 1−3 days before injections. Put 2−3 drops of agarose on a coverslip slide and allow to dry at room temperature.
-
3On the day of injection, transfer young adult worms to a plate with no OP50 and give them time to move around to dry and clear off residual OP50. Place two drops of mineral oil on the dry agarose pad and use this liquid to wet the worm pick. Pick 3−4 worms and place on agarose pad, aligned such that the gonads are visible.
- Work efficiently at this point because the worms will become desiccated and die if left to dry for too long.
-
4
Make a plasmid mixture that is 150 ng/μL with a 1:1 ratio of expression plasmid and dominant marker plasmid. Centrifuge 20 minutes at 18,000 × g, room temperature. Note that some markers are toxic and therefore the corresponding plasmid amount needs to be reduced; however Mec7::mRFP and rol-6 work well in this recipe.
-
5
Prepare needles using the appropriate apparatus such as a stutter P-30 vertical puller. Needles should not be broken or cut (as is required in some protocols), but it is recommended to test the needle by injecting into the oil prior to attempting injection into the worm. Load the needles using microloader tips and store mounted on modeling clay or dental wax in a humidified chamber up to several hours before use.
-
6Using the worms on the agarose pad from step 3, inject plasmid mixture into each worm via a single gonad injection, using DIC setting on the microscope so that organs are easily visible.
- There is no exact volume used to inject the worms at this stage. Instead, the worm is injected until just before it bursts. This can be visualized as liquid (which is a paler color under DIC) just moving past the “bend” of the gonad arm (where the gonad starts to move inwards towards the vulva). This maximizes the amount of plasmid delivered while still leaving the worm viable.
-
7
Add recovery buffer to the worms on the pad to create a bubble. Worms will float and should start to twitch. After a few minutes, place onto fresh plates with OP50 lawns using a pipette. If worms start to dry out, extra recovery buffer can be added. Incubate 3 days at 16 °C to grow. Screen for expression of the dominant phenotype markers and transfer transgenic worms individually to a separate plate. The dominant marker in this case is red fluorescence in the touch receptor neurons (see figure 3). Score the progeny for transmission.
-
8Using transgenic worms with transmission efficiency of around 30%, grow until there are several hundred transgenic L4 worms.
- Transmission efficiency must be determined by analysis of the first generation of worms, before any progeny become adults.
-
9Gamma-irradiate the worms (3600–4800 rads, on OP50 plates).
- This typically requires use of a Cobalt-60 or Cesium-137 source that is often maintained under strict control. Consult your university radiation committee for availability. Other methods for DNA damage induction have also been suggested, such as UV irradiation (Mariol, Walter, Bellemin, & Gieseler, 2013).
-
10After gamma irradiation, allow the worms to grow and deplete the OP50 lawn. At this point, the plate is considered starved and the worms will begin to bury into the plate. Once starved, divide the starved plate equally onto 20 10 cm diameter plates.
- The time it takes for a plate to become starved depends on many factors, including growth temperature, health of worms, and the number of worms placed on the plate. It is best to check the plate periodically to see when the E. coli lawn has become depleted and worms crawl away from the lawn to non E. coli regions and bury in the agar.
-
11
Allow worms to grow such that the plate is 50% covered with worms.
-
12
Pick 100−300 individual transgenic worms in total from all the large plates (this can be done in 24 well plates or individual plates) and score for 75% or 100% transmission frequency as these worms must have undergone integration of the assay, assuming the array transmission frequency was approximately 30% (figure 3). Select worms that contain the integrated transgene and screen for homozygous transgenic progeny.
-
13Backcross the homozygous transgenic worms with the parent strain (Bristol N2). Plate 4−5 young adult homozygous transgenic hermaphrodites with 14−16 young adult males from the parent strain.
- Males are highly mobile and can easily get lost from the plate. Ensure the OP50 lawn is not touching the sides of the plate.
-
14
Screen the resulting worms for heterozygous transgenic worms. From these worms, screen for homozygous progeny. Use the homozygous progeny to repeat the backcross as described in the previous step.
-
15
Repeat the backcross at least three times. The homozygous transgenic worms recovered after the backcrosses will be used for the next steps.
Perform T-REX on Worms
-
16
Grow homozygous transgenic worms on the appropriate number of plates (see strategic planning for number of controls and number of plates per condition) to densely packed while maintaining an intact OP50 lawn.
-
17
For plates that will be induced with heat shock, incubate 60 minutes at 37 °C. For non-induced control plates, maintain the plates at 20 °C during this time.
-
18
Wash each plate with 2 mL of S-complete media and pipette each into a 2 mL tube. Centrifuge for 30 seconds, 2,000–6,000 × g, room temperature. Remove the supernatant and wash once with 2 mL S-Complete.
-
19
Pool all heat shocked worms and split evenly among the conditions (eg. no compound, no light, etc.), placing each into 15 mL conical tubes. Dilute with 2 mL of S-Complete media and add 2.5 mL of 2× OP50 stock. Finally, add in 0.5 mL of 10× Ht-PreHNE. For non-induced and no compound control samples, add 0.5 mL S-Complete instead.
-
20
Incubate samples 6 hours at room temperature with end-over-end rotation in the dark.
-
21Centrifuge the tubes for short pulses at 2,000–4,000 × g, at room temperature to pellet the worms. Wash the pellets by resuspending in fresh S-complete and incubating for 30 minutes at room temperature with end-over-end rotation. Repeat the wash once more with S-complete and a third time with HEPES buffer.
- It is best to use a swinging bucket rotor with a 15 mL conical tube as this removes the OP50 the most efficiently. OP50 removal is helpful to ensure the protein loading is equal, as excess OP50 will add to protein content after lysis of worms.
-
22
Resuspend the washed pellet in 2 mL HEPES buffer and transfer to a 6 well plate. Place the uncovered plate under a UV lamp (365 nm, 5 mW/cm2) for 5 minutes. Collect the worms, pellet, remove the supernatant, and flash freeze with liquid nitrogen. Store at –80 °C for up to 1 week.
Lyse the Worms
-
23
Remove the pellets from –80 °C and thaw on ice. Add 2–8 volumes of worm lysis buffer and ¼ volume of zirconia beads.
-
24
Vortex for 15 seconds and then flash freeze in liquid nitrogen. Thaw, vortex for 15 seconds, and repeat for a total of three freezes.
-
25
Centrifuge 10 minutes at 20,000 × g, 4 °C. Take the supernatant and determine the protein concentration using a Bradford assay using BSA as a standard. Use lysates immediately.
BASIC PROTOCOL 3: PREPARE LYSATE WITH FLUORESCENT DYE AZIDE TO QUANTIFY TARGETING EFFICIENCY
This section outlines how to prepare the lysate from either cells (Basic Protocol 1) or worms (Basic Protocol 2) to quantify labeling efficiency by use of the alkyne handle on the RES. This protocol starts from the clarified lysate and gives steps for TEV cleavage to separate the HaloTag from the POI and then copper-catalyzed Click with a fluorescent dye azide (Cy5 azide) to quantify the extent of HNEylation on the POI. Running the mixture on an SDS-PAGE gel and then imaging allows for the calculation of targeting efficiency. Cy5 azide is used in this procedure, but other azide conjugated dyes have also been successfully used (including FAM azide and FITC azide). Figure 4 shows a representative gel and blot for T-REX with Keap1.
Figure 4. Using T-REX to specific target Keap1 visualized by in gel fluorescence (Cy5).
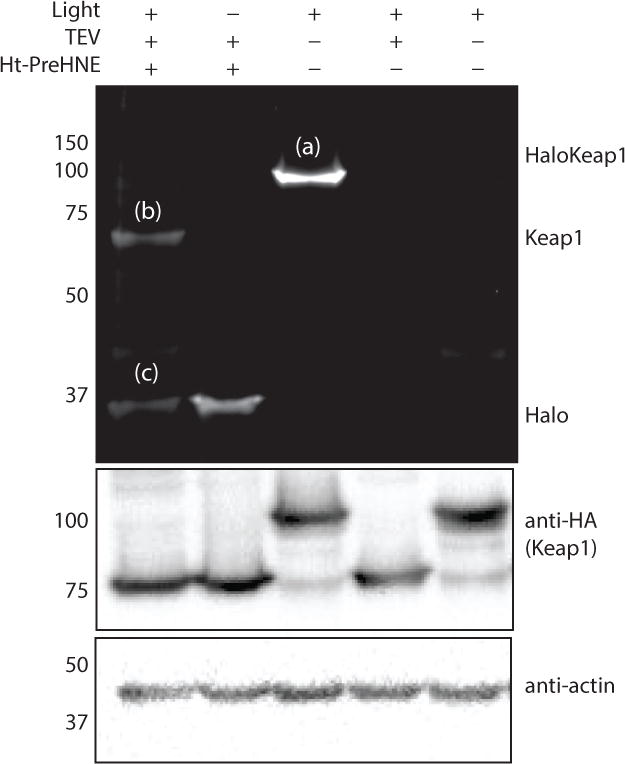
A) Representative data of T-REX driven Keap1-specific electrophilic adduction Cy5 Click performed with HaloKeap1 in cell lysate. HEK-293T cells expressing HaloTevKeap1HA were treated with Ht-PreHNE (15 μM) for two hours, excess probe was rinsed out, and cells were exposed to 5 minutes of UV light. Cells were lysed, TEV protease treatment applied, and Click chemistry performed with Cy5 azide. The top band (a) is the HaloTevKeap1HA fusion protein, band (b) is Keap1, and band (c) is Halo. Calculation of targeting efficiency of Keap1 was done using equation 1. Targeting efficiency was calculated to be 39%.
Materials
TEV protease (see recipe)
tert-butanol (t-BuOH; Sigma-Aldrich, cat. no. 471712)
20% SDS solution (see recipe)
100 mM CuSO4 (Sigma, cat. no. 209198)
10 mM Copper Tris[1-benzyl-1H01,2,3,-triazol-4-yl)methyl]amine (Cu(TBTA), Lumiprobe, cat. no. 21050)
0.5 mM Sulfo-Cy5 Azide (Lumiprobe, cat. no. B3330)
4X Laemmli Dye with 6% BME (see recipe)
anti-HA antibody (table 1)
anti-β actin antibody (table 1)
PCR strip tubes (USA Scientific, cat. no. 1402–4700)
37 °C incubator (PCR thermal cycler will work)
Standard SDS PAGE gel equipment
ChemiDoc MP Imaging System or other Fluorescence gel imager (Bio-Rad)
Standard Western Blotting Apparatus
Image processing software (such as ImageJ)
Prepare Lysate with Fluorescent Dye Azide
-
1Prepare samples with a final volume of 20 μL that have 0.85−1 mg/mL of protein sample and 0.2 mg/mL TEV protease or no TEV protease, depending on the condition.
- Complete TEV cleavage is important and spinning down the samples before the incubation can help ensure that all the TEV and lysate is properly mixed.
-
2
Incubate the samples 35 minutes at 37 °C to allow for TEV cleavage.
-
3To each sample, add the following reagents to a final concentration of 5% t-BuOH, 1% (w/v) SDS, 2 mM TCEP, 1 mM CuSO4, 0.1 mM Cu(TBTA), and 10 μM Cy5 azide. The final lysate concentration should be 0.85−1.00 mg/mL. Mix well and incubate 30 minutes at 37 °C.
- Add 1.15 μL t-BuOH to each, then make a 10X master mix with the other five components followed by addition of 2.35 μL to each sample. This method reduces variation caused by pipetting errors and allows for easier mixing of all the Click components.
- When making the master mix, add the Cy5 azide last, preceded immediately by the TCEP. After adding these last components, use immediately.
-
4
Quench each sample with 7.5 μL of 4X Laemmli Dye. Incubate samples for a further five minutes at 37 °C. Freeze at –20 °C, protected from light, if not proceeding to next step immediately.
Run SDS-PAGE with Cy5 Samples and Transfer to a Blot
-
5Load each sample into a 10% SDS PAGE gel and run, keeping shielded from light.
- The gel percentage and run time/voltage will need to be optimized if the POI molecular weight is similar to that of HaloTag (33 kDa). The POI and HaloTag bands must be well separated to ensure good results and enable quantification. Bleaching the glass plates for the gel can help reduce the background fluorescence. Bleach briefly with 10% bleach and then wash thoroughly with water and dry before casting the gels.
-
6Image the gel with a ChemiDoc-MP or other equivalent imager with red epi illumination and emission filter as 695/55 filter.
- If the background is high, wash the gel in distilled water for up to half an hour and image again. Washing can be repeated until an optimal signal to background ratio is achieved.
-
7
Transfer the gel to a PVDF membrane using standard methods (Ni, Xu, & Gallagher, 2001).
-
8Probe the blot for the POI and loading control (e.g. β actin) and image as appropriate.
- Using the epitope tag (e.g. FLAG, HA) to probe the blot for POI level can be a better option than probing for the POI, depending on antibody sensitivity or availability.
Calculate Targeting Efficiency
-
9
Using an imaging editing software such as ImageJ, draw equal size rectangles of each lane of the Cy5 fluorescence image. Quantify the area of the signal observed for full construct, POI, and HaloTag.
-
10
Repeat the quantification with the western blot.
-
11Use the following equation to calculate the targeting efficiency:
In this equation, Cy5POI is the Cy5 signal from the POI in the sample originating from in-cell T-REX treatment that has been subjected to TEV protease treatment in lysate, WBPOI is the western blot signal from the POI of the same sample. Cy5Full is the Cy5 signal from the protein in the compound alone (no light). In this case, the average of no TEV treated full length and TEV treated HaloTag can be used, as all of the signal should remain on the Halo protein after TEV cleavage. WBFull is the western blot signal from the full length protein in the no light sample. Cy5Halo is the Cy5 signal on the HaloTag post TEV cleavage originating from the T-REX sample (this is the residual uncaged precursor that remains on Halo). For various POI and RES pairs, targeting efficiencies have ranged from 15—60% (Long & Aye, 2016). Specifically for Keap1, 30—40% targeting efficiency with HNE is generally seen.(1)
BASIC PROTOCOL 4: PREPARE LYSATE WITH BIOTIN AZIDE TO ENRICH LABELED PROTEIN FROM MAMMALIAN CELLS
This method is an alternative to the Cy5 labeling method and can be used if it is difficult to visualize the labeling of the protein of interest due to various reasons, e.g. low full−length protein expression level, low labeling efficiency or difficulty separating POI from HaloTag. This utilizes the TEV cleavage and Click methods from the Cy5 section, but instead labels with biotin azide in place of azido fluorescent dyes. Subsequent streptavidin enrichment gave rise to the elution fraction which is run on a gel and transferred to a blot to allow for quantification of the amount of HNEylated POI pulled down. T-REX conditions will show enrichment over negative controls if the POI is able to sense the RES being released. Recall that it is important to work in dim light throughout the entire procedure, as stray light may cause uncaging of the Ht-PreHNE.
Materials
100 mM biotin azide (Quanta Biodesign, cat. no. 45-QBD10784)
70% ethanol in water
Ethanol
Acetone
Resolubilization buffer (see recipe)
High Capacity Streptavidin resin (Pierce, cat. no. 20359)
Wash buffer (see recipe)
2X Laemmli Dye (see recipe)
37 °C incubator
4 °C centrifuge
End to end Rotator
Perform TEV Cleavage and Biotin Click
-
1
After determining the concentration of lysates, dilute the lysate with 1 X HEPES buffer to 2 mg/mL final concentration with 0.3 mM TCEP. Add TEV protease to have 0.2 mg/mL final per sample. Incubate the samples 35 minutes at 37 °C, flicking the samples occasionally to ensure mixing and full cleavage.
-
2Add Click components to a final concentration of 1% SDS, 5% t-BuOH, 200 μM biotin azide, 2 mM TCEP, 0.9 mM CuSO4, 0.1 mM Cu(TBTA). Return the samples to incubate 30 minutes at 37 °C.
- Halfway through the incubation, an additional amount of TCEP (bringing the TCEP concentration up to 4 mM) can be added to each sample, mixed, and returned to 37°C. This facilitates the completion of the Click reaction and better yields in enrichment.
-
3
Add 4 volumes of ice cold ethanol to each sample (80% ethanol final) and freeze in –80 °C for at least 4 hours or overnight to precipitate the protein and quench the Click reaction. The experiment can be paused at this point for up to three days.
Wash and Resuspend the Proteins
-
4
Remove samples from freezer and centrifuge 45 minutes at 20,000 × g, 4 °C. Remove supernatant and add 1 mL of ice cold 70% ethanol to each sample. Vortex for one minute to wash pellet.
-
5
Centrifuge samples for 10 minutes at 20,000 × g, 4 °C. Then repeat the wash with chilled pure ethanol and centrifuge again. Wash for a third time, this time using ice cold acetone. Centrifuge with the same conditions.
-
6
After the final spin, remove all acetone carefully. It may be necessary to rotate the open tube for a few seconds to evaporate any residual acetone.
-
7Add 50 μL of resolubilization buffer to each sample. Resuspend the protein by vortexing and sonicating at 50 °C.
- It can be difficult to resuspend the proteins, but generally vortexing for 1 minute and sonicating for 5 minutes and repeating this 3 times is sufficient.
-
8Centrifuge the resuspended samples for 10 minutes at 20,000 × g, 4 °C. Take the supernatant into a clean tube and repeat the centrifugation. Using the final supernatant, dilute to 0.5% LDS with 50 mM HEPES buffer. Take a small sample and add 4X Laemmli Dye to use as an input sample.
- It is important to ensure that no insoluble protein (pellet) is taken into the next step. Any pellet that remains will remain in the resin and interfere with proper readout of results.
Enrich Biotinylated Proteins with Streptavidin Pulldown
-
9For each sample, prepare a tube with 50 μL bed volume of streptavidin high capacity agarose resin. Centrifuge 5 minutes, 500 × g, room temperature and remove the glycerol storage from the resin. Resuspend in 1 mL of water and rotate with end-over-end rotation for 5 minutes. Centrifuge again and remove water. Resuspend in 1 mL of 0.5% LDS in HEPES buffer to equilibrate the resin. Repeat this equilibration one additional time.
- It is important to be gentle with the resin. Pipette it through a cut pipette tip to avoid damage and always centrifuge at a low speed (500−800 × g). When taking the buffer out after pellet down, it is not necessary to fully remove the supernatant. Leaving a small amount of buffer (50 μL) on top is optimal to prevent pipetting beads out and causing uneven amounts of resin in each sample.
-
10
Add the samples to the resin and incubate 2−3 hours at room temperature with end over end rotation.
-
11
Centrifuge the samples 5 minutes at 500 × g, room temperature and remove the supernatant. Take a small sample of the flow through and add 4X Laemmli Dye to use as a flow through sample.
-
12Add 1mL of 0.5% LDS to each sample and incubate 30 minutes at room temperature with end over end rotation. Centrifuge 5 minutes at 500 × g, room temperature. Repeat wash three times total.
- Wash stringency can be increased with a higher percentage of LDS if non-specific pulldown is a consistent problem.
-
13After the final wash, remove as much of the wash buffer as possible without taking any resin. Add 40 μL of 2X Laemmli Dye with 6% BME, tap to mix with the resin, and boil the samples in 98 °C bath for 10 minutes. Centrifuge the samples 5 minutes at 20,000 × g, room temperature and remove the supernatant for the next step.
- For the final removal, using a gel loading tip helps to remove as much of the wash buffer as possible.
-
14
Load the elution onto an SDS-PAGE gel and run the gel.
-
15
Transfer SDS-PAGE gel to a PVDF membrane for western blotting.
-
16
Probe the blot for the POI (using the epitope tag if desired) and quantify the amount of signal for each condition. The level of enrichment of HNEylated POI following T-REX can be calculated by dividing the amount of signal in the T-REX conditions by the negative control (no compound, no light, or the use of Ht-PreHNE with no alkyne functionalization in place of alkyne-functionalized Ht-PreHNE).
BASIC PROTOCOL 5: PREPARE LYSATE WITH BIOTIN AZIDE TO ENRICH LABELED PROTEIN FROM WORM LYSATES
This protocol is for use with worm lysates. The procedure is the similar to Basic Protocol 4, except for an additional preclearance step that is needed for worm lysates. This preclearance step is needed because worm lysate has endogenously biotinylated proteins, which would get pulled down in the streptavidin enrichment step. This endogenous biotinylation can come from residual OP50 bacteria (the food source for worms) in the lysate and endogenous biotinylated acetyl-CoA carboxylase (Ooi, Henikoff, & Henikoff, 2010). This will interfere with the read out of the enrichment procedure, so preclearance is necessary. While mammalian cells also have endogenously biotinylated proteins, it has been shown that preclearance is not necessary as the abundance of these proteins is too low to be detected by this procedure.
Perform TEV, Biotin Preclearance, and Biotin Click on Worm Lysate
-
1
Standardize lysates to the lowest-concentration lysate using worm lysis buffer. The final volume should be 300–500 μL, with a concentration around 1 mg/mL.
-
2
Add TEV protease to each sample to a final concentration of 0.3 mg/mL. Incubate 30 minutes at 37 °C.
-
3
Rinse 50 μL bed volume of high capacity streptavidin resin per sample with 1 volume of water for 30 minutes with end-over-end rotation. Centrifuge 5 minutes at 500 × g, room temperature and remove wash. Repeat this step once more with water, and then a third time with 50 mM HEPES buffer.
-
4
Add the lysates to the beads and incubate for 2 hours at room temperature with end-over-end rotation.
-
5
Centrifuge the lysates 1 minute at 2,000 × g, room temperature and remove the supernatant from the beads.
-
6To perform the biotin Click procedure, prepare the lysates such that each sample has a final concentration of 1% SDS, 5% t-butanol, 1 mM CuSO4, 0.1 mM Cu(TBTA), 2 mM TCEP, and 0.2 mM biotin azide.
- Add the biotin azide last, preceded immediately by the TCEP.
-
7
Incubate the samples 30 minutes at 37 °C.
-
8
Add 4 volumes of ice cold pure ethanol (80% final concentration) and vortex the solution to mix well. Freeze in –80 °C at least 4 hours or overnight in the ethanol to precipitate the proteins.
From this point, the procedure for biotin pulldown with worm lysate is the same as with cell lysate (Basic Protocol 4). To finish this analysis with worm lysate, continue the protocol at Basic Protocol 4 step 4.
BASIC PROTOCOL 6: LC-MS/MS ANALAYSIS OF MODIFICATIONS
Starting from the clarified lysate from Basic Protocol 1, this protocol outlines a liquid chromatography tandem mass-spectrometry (LC-MS/MS) approach to identify site of HNE-derived modifications of the POI following T-REX in living systems (Lin et al., 2015; Long, Parvez, et al., 2017; Parvez et al., 2015; Parvez et al., 2016). This method involves enriching the HaloTag-POI construct post-T-REX and then in-gel protease digestion of the enriched band on SDS-PAGE corresponding to the molecular weight of the HaloTag-POI protein, and analyzing by LC-MS/MS. The protocol below utilizes a FLAG (DYKDDDDK) tag to enrich the POI, but other tags (e.g., His-tag) could be used with appropriate resin. In this example, the flag tag is positioned after the TEV cleavable linker, but before the POI. Although no TEV cleavage takes place before submitting for LC-MS/MS analysis, this placement is useful for the previously described methods of analysis.
Because of the labile nature of the thiol-based modifications, several precautions must be taken with the LC-MS/MS analysis. TCEP must be used as a reducing agent in place of DTT standardly used in sample processing for MS, since DTT is able to deconjugate Michael-acceptor adducts of HNE especially at higher temperatures. In addition to avoiding thiol-based nucleophilic buffer components such as DTT, the sample must be handled very carefully since the thiol modifications as well as any remaining uncaged Ht-Pre-LDE bound on HaloTag are light, heat, and/or pH sensitive. The ionization temperature should be kept as low as possible (130 °C has given successful results (Lin et al., 2015; Long, Parvez, et al., 2017; Parvez et al., 2015; Parvez et al., 2016)). Digestion steps should be optimized to be at as low of a temperature as possible. Iodoacetamide is used to alkylate cysteine residues before analysis. As a general precaution for mass spectrometry, utmost care should be taken to avoid contamination of samples with keratin, which can come from dust, skin, or hair. Gloves should be changed often when handling the sample and buffers should be made fresh.
Prior to beginning this analysis, the ideal digestion enzyme should be determined. Expasy.org or other similar tools can be used to determine what fragments would arise from a given enzyme digestion on the sequence of the HaloTag-POI. Fragments containing cysteines of interest should be within the range of detection (instrument dependent). It is possible to use two digestion enzymes simultaneously, if necessary.
When processing the data, it is important to keep in mind that there are multiple possibilities for HNE adduction (figure 6). There are various m/z shifts that must be considered, so manual interpretation of the resulting spectra may be necessary to ensure that all modifications are found (Lin et al., 2015; Long, Parvez, et al., 2017; Parvez et al., 2015; Parvez et al., 2016). This is different than many other PTM mass spectrometry methods, which consider only one mass change.
Figure 6. Possible HNE modifications.
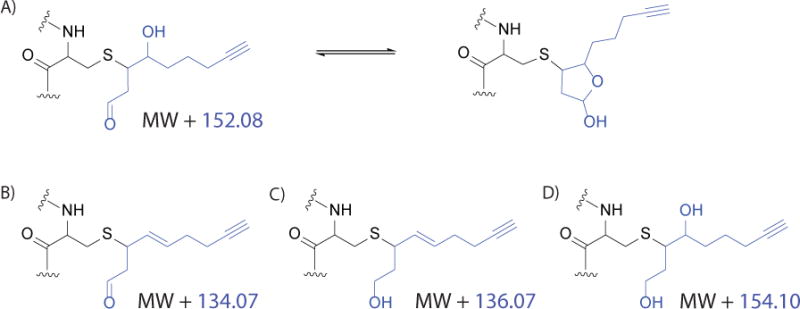
Possible structures and mass of all HNE(alkyne) derivatives addition (blue) to cysteine of a target protein (black). Mass changes with respect to the original y or b ion (MW) are shown. A) HNE(alkyne) via Michael addition, in equilibrium with the cyclized version. B) Dehydrated HNE(alkyne). C) Dehydrated and reduced HNE(alkyne). D) Reduced HNE(alkyne).
After a specific cysteine residue is identified as being the site of HNEylation, site directed mutagenesis can be performed (cysteine to serine or alanine) and the resulting point mutant used in T-REX experiments. It is necessary to ensure that the point mutation does not drastically effect the folding and function of the protein prior to using for experiments.
Materials
FLAG resin (Sigma-Aldrich, cat. no. A2220)
0.3 mg/mL 3X FLAG peptide in 50 mM HEPES, pH 7.6 (APEXBIO, cat. no. A6001)
SDS-PAGE stain solution (Coomassie R-250 or Sypro Ruby)
100 mM NH4HCO3, pH 7.8
Trypsin solution (Promega, cat. no. V5113)
Desalt solvent (97:3 H2O: acetonitrile with 0.1% (v/v) formic acid and 0.01% (v/v) TFA)
Separation solvent (85% acetonitrile/10% isopropanol with 0.1% (v/v) formic acid and 0.0075% (v/v) TFA)
CapLC system coupled to QSTAR XL
Everest C18 column for desalting
Jupiter C18 column for separation
Analyst QS 1.1 software
Enrich Flag-tagged Proteins
-
1
Resuspend the cell pellets in an appropriate amount of lysis buffer. Centrifuge 10 minutes at 20,000 × g, 4 °C. Collect supernatant.
-
2
Determine the concentration of the lysate using a Bradford assay. Dilute to 1.5 mg/mL (concentration depends on the type of resin used).
-
3Equilibrate 25 μL bed volume of anti-flag M2 resin for each sample by washing three times with 1 mL of lysis buffer.
- Pipette the resin with a cut pipette tip to avoid damage. To wash, incubate with end-over-end rotation and then centrifuge 5 minutes at 500 × g, 4 °C. Remove supernatant carefully to not damage or lose resin.
-
4Add the 1.5 mg/mL sample to the resin and incubate for 1.5 hours, 4 °C, with end-over-end rotation.
- Some lysate should be saved for Click coupling (Basic Protocol 3) to confirm modification by the RES.
-
5
Remove the flow through by centrifuging at 500 × g for 5 minutes at 4 °C. Wash the resin by adding 1 mL lysis buffer and incubating 30 minutes, 4 °C, with end-over-end rotation. Repeat the washes 3 times total.
-
6
Remove wash 3 fully to maximize the yield of the eluted protein. Add 50 μL 0.30 mg/mL 3X FLAG peptide and incubate 90 minutes, 4 °C, with end-over-end rotation to elute the POI.
-
7
Centrifuge the samples 5 minutes at 20,000 × g, 4 °C and remove supernatant.
-
8
Determine the concentration of each elution with a Bradford assay.
-
9
Mix the elution with 4X Laemmli buffer with 6% BME and incubate for 5 minutes at 37 °C. Run this on an SDS-PAGE gel to resolve and stain with colloidal Coomassie or Sypro Ruby. Destain in water or appropriate destain solution and excise the band of the POI. Store gel piece in –20 °C until ready to run LC-MS/MS, but it is best to proceed immediately.
Digest and Analyze Peptides by LC-MS/MS
-
10
Wash the pieces of gel with 100 μL of water and remove water.
-
11
Add 100 μL of 50:50 acetonitrile:100 mM NH4HCO3. Incubate 10 minutes at room temperature, then remove the liquid. Add 50 μL acetonitrile and incubate for 5 minutes at room temperature. Remove acetonitrile and dry the gel pieces for 10 minutes in a fume hood.
-
12
Reduce the proteins by addition of 5 mM TCEP in 50 mM NH4HCO3, pH 7.8, and incubation for 45 minutes at 37 °C. Alkylate with 20 mM iodoacetamide in 50 mM NH4HCO3 for 45 minutes in the dark.
-
13
Repeat step 10 to dry the gel pieces.
-
14
Digest the peptide and rehydrate the gel pieces by adding 60 μL of trypsin solution and incubate on ice 30 minutes. Incubate overnight at 37 °C.
-
15
Add formic acid to a final concentration of 1% to stop the reaction. Remove the supernatant and save.
-
16
Add 120 μL of 50% acetonitrile with 5% (v/v) formic acid to the gel pieces. Incubate at room temperature 45 minutes. Sonicate for 5 minutes and remove supernatant and combine with the supernatant from the previous step. Repeat this step a total of two times.
-
17
Add 90% acetonitrile with 5% (v/v) formic acid to the gel pieces. Incubate at room temperature 5 minutes. Remove the supernatant and add to supernatant from previous steps.
-
18
Dry the supernatant under vacuum, and resuspend the peptides in 60 μL of 0.1% (v/v) formic acid. Inject the resuspended peptide into the LC.
-
19
Desalt and separate the peptide using the CapLC system coupled to the QSTAR XL. Desalt the peptide solution by running on an Everest C18 column with desalt solvent with flow rate 40 μL/min. Wash for 6 minutes and then separate the peptides on a Jupiter C18 with a 40 minute linear gradient (10–40% separation solvent) with flow rate 250 nl/min. Collect the data from the QSTAR XL, and use Analyst QS 1.1 to analyze.
-
20Combine the MS/MS spectra into a single file and smoothen, de-isotope using an Analyst script mascot.dll, to create a peak list and save the peak list into a file. Use the peak list to search the NCBI human database using Mascot 2.4 from Matrix Science. Parameters should be set as follows: 0.3 Da peptide mass tolerance, 0.3 Da MS/MS ion mass tolerance, up to two missed cleavages.
- Consider multiple forms of HNEylation (figure 6) including electrophile Michael adduct, reduced electrophile Michael adduct, dehydrated electrophile Michael adduct, or electrophile Michael adduct in Schiff-base form.
-
21
Extract the modified peptide signal (XIC) for both the modified peptide signal and the unmodified peptide. Compare the two to estimate the extent of modifications.
REAGENTS AND SOLUTIONS
Complete media
500 mL MEM media (ThermoFisher, cat. no. 11095080)
50 mL fetal bovine serum (Sigma, cat. no. F2442)
5 mL 100× non-essential amino acids (ThermoFisher, cat. no. 11140050)
5 mL 100 mg/mL penicillin streptomycin (ThermoFisher, cat. no. 15140122)
5 mL 100× sodium pyruvate (ThermoFisher, cat. no. 11360070)
Mix all and store up to 1 month at 4 °C, prewarm to 37° C immediately before use.
Linear polyethylenimine transfection solution
Dissolve 50 mg of linear polyethylenimine (Polyscience, cat. no. 23966-2) in 40 mL of 80 °C distilled water, let cool to room temperature. Bring pH to 7.0 with addition of 0.1 M HCl. Bring total volume to 50 mL. Sterilize by filtration through 0.22 μm filter and aliquot. Avoid freeze thaw cycles. Store for 6 months in −20 °C.
Rinse media
500 mL MEM media
5 mL 100× non-essential amino acids (ThermoFisher, cat. no. 11140050)
5 mL 100 mg/mL penicillin streptomycin (ThermoFisher, cat. no. 15140122)
5 mL 100× sodium pyruvate (ThermoFisher, cat. no. 11360070)
Mix all and store up to 1 month at 4 °C, but prewarm to 37 °C immediately before use.
Ht-PreHNE stock solution
Synthesized Ht-preHNE (Parvez et al., 2016) dissolved in 100 μL DMSO in an amber tube to make approximately 130−200 mM stock solution. Determine exact concentration using UV-Vis (25 °C, 366 nm with extinction coefficient = 3593 M−1cm−1), quantitative NMR, or both. Aliquot (typically 2–3 μL per tube) and store in amber tubes. Use in dim light and avoid freeze thawing the solution. Store for 6 months at −80 °C, thawing immediately before use.
Cell lysis buffer
4.47 mL 50 mM HEPES pH 7.6, 50 mM
500 μL 10% Nonidet P-40 (NP-40) in 50 mM HEPES, pH 7.6, 1% (v/v)
30 μL 100 mM TCEP, pH 7.0 (see recipe), 0.3 mM
1 Roche cOmplete mini EDTA-free tablet (Sigma cat. no. 11836170001)
Dissolve Roche tablet in HEPES, add TCEP and 10% NP-40 and mix well. Store on ice for up to one day.
100 mM TCEP
Dissolve TCEP HCl (Goldbio, cat. no. TCEP1) in 80% of the final volume. Bring the pH to 7.0 with the addition of NaOH. Aliquot and store at –20 °C for up to 1 year, avoiding freeze thaw cycles.
Nematode growth plates
0.79 g Tris HCl
2 g NaCl
3 g Tryptone
17 g Agar
1 mL 5 mg/mL cholesterol
Dissolve the tris and NaCl in about 800 mL of ddH2O. Mix and adjust pH to 6.0 with NaOH. Bring volume to 1 L, mix into tryptone and agar. Autoclave for 45−60 minutes. Immediateley before pouring plates, add the cholesterol to a final concentration of 5 mg/L. Pour 13 mL of agar mixture onto each 100 mm diameter plate, under flame. Set plates aside to dry at least 24 but no more than 48 hours.
Nematode growth OP50
OP50 (available from University of Minnesota’s Caenorhabditis Genetics Center)
LB broth (see recipe)
2 days before pouring the nematode growth plates, seed 5 mL of LB with OP50 stock. Incubate with shaking at 37 °C overnight. Take 1 mL of each culture and dilute into 50 mL L flask. Incubate overnight with shaking at 37 °C. When ready to pour OP50 onto dry plates, check the OD of a 1:1 mixture of OP50 in LB. The OD should be 1.3–1.4. If below this, allow more incubation time to increase OP50 concentration. To 100 mm plates, add 1.1–1.3 mL of OP50 solution under flame. Keep OP50 in the middle of each plate, as this keeps the worms away from the edges of the plate, which makes for easier handling of males. Allow OP50 to dry before storing in 4 °C for up to a month.
LB broth
10 g tryptone
10 g NaCl
5 g yeast extract
Mix all together and bring volume to 1 L with ddH2O. Autoclave to sterilize. Store at room temperature up to a week, but check carefully for contamination before using.
Recovery media
0.117 g HEPES, 5 mM
0.333 g CalCl2, 3 mM
0.286 g MgCl2, 3 mM
3.857 g NaCl, 66 mM
0.179 g KCl, 2.4 mM
40 g glucose, 4% (w/v)
Mix all together in ddH2O, pH to 7.2. Bring to 1 L with ddH2O and sterile filter. Use only under flame, and store at 4 °C for up to 6 months.
S-Complete media
500 mL S-Basal media (see recipe)
5 mL trace metals solution (see recipe)
1.5 mL 1M CaCl2, 3 mM
1.5 mL 1M MgSO4, 3 mM
5 mL 1 M sodium citrate, pH 6.0, 10 mM
5 mL 100 mg/mL penicillin streptomycin
5 mL nystatin (Sigma, cat. no. N1638)
Mix together as needed and use within a day.
S-Basal media
5.844 g NaCl, 100 mM
0.993 g K2HPO4, 5.7 mM
6.001 g KH2PO4, 44.1 mM
1 mL 5 mg/mL cholesterol, 5 mg/L
Dissolve salts in ddH2O, add cholesterol and bring to 1 L. Store at room temperature for up a year.
Trace metals solution, 100×
1.86 g disodium EDTA, 5 mM
0.69 g FeSO4•7H2O, 2.5 mM
0.20 g MnCl2•4H2O, 1 mM
0.29 g ZnSO4•7H2O, 1 mM
0.025 g CuSO4•5H2O, 0.1 mM
Dissolve all in 1 L ddH2O, aliquot and store room temperature for up to one year.
2X OP50 solution
1 mL OP50 in LB per plate of worms
0.5 mL S-Complete media per plate of worms
Spin down OP50 to pellet. Resuspend in half the original volume of S-Complete to make the 2X OP50 solution.
10X Ht-PreHNE solution
Dissolve an appropriate amount of Ht-PreHNE in S-Complete media to give 300 μM.
Worm lysis buffer
8.95 mL 50 mM HEPES, pH 7.6
1 mL 10% NP-40 in 50 mM HEPES, pH 7.6
50 μL 100 mM TCEP
2 Roche cOmplete mini EDTA-free tablets
Dissolve Roche tablets in HEPES, add TCEP and NP-40 and mix well. Store on ice up to one day.
TEV protease
This protein can be prepared using S219V mutant of TEV protease pRK793 bacterial expression vector (Addgene #8827). The procedure is adapted from Nature Protocols(Parvez et al., 2016), but with the following changes.
The induction time has been optimized to increase yield. After the diluted E. coli grow to reach OD 0.5−0.6 (typically 4−5), IPTG 1 mM (final concentration) is added to induce protein expression at 37 °C for 6 hours, then the temperature is decreased to 16−18 °C and growth continues overnight. Harvest the cells and prepare the TEV protease as outlined in the published procedure.
Ideally, obtaining a concentration of TEV around 3−4 mg/mL works well for the procedures for T-REX. However, the activity should be checked to ensure complete cleavage of HaloTagged POI. Activity can be checked utilizing a crude gel based analysis (incubating a TEV-cleavable protein with a given amount of TEV for various times and visualizing the cleavage with Coomassie or western blot detection) or more rigorous and accurate real-time assays (Kraft, Radke, Wieland, Zipfel, & Horn, 2007).
20% SDS solution
Dissolve SDS (Teknova, cat. no. S9974) in water to a concentration of 20% (w/v). Sonication and heating may be necessary to fully dissolve SDS. If precipitation forms, sonicate again to dissolve. Store at room temperature for up to 1 year.
4X Laemmli Dye
25 mL 1 M Tris, pH 6.8
40 mL glycerol
8 g SDS
40 mg bromophenol blue
36 mL H2O
β-mercaptoethanol (BME; Sigma-Aldrich, cat. no. M6250)
Mix all but BME together, ensuring that all SDS is dissolved. Dye can be stored at room temperature for up to 1 year, but BME should be added immediately before use (6% final concentration). After the addition of BME, keep only for 30 minutes.
Resolubilization buffer
4 mL 20% LDS in 50 mM HEPES, pH 7.6
100 μL 100 mM disodium EDTA
5.9 mL 50 mM HEPES, pH 7.6
Mix all together and store at room temperature for up to 1 month. Heat to 50 °C before use. If 20% LDS precipitates, sonicate and heat to redissolve.
Wash buffer
0.25 mL 20% LDS in 50 mM HEPES, pH 7.6
9.75 mL 50 mM HEPES, pH 7.6.
Mix together and store at room temperature up to one year. LDS percentage can be increased if more stringent wash is needed.
2X Laemmli Dye
25 mL 0.5 M Tris-Cl, pH 6.8
4 g SDS
5 mg bromophenol blue
20 mL glycerol
55 mL H2O
BME
Mix all together except BME and stir to ensure SDS is totally dissolved. Dye can be sotred up to one year at room temperature. Immediately before use add 30 μL of BME per mL of dye.
COMMENTARY
Background Information
In the field of redox signaling, bulk administration of RES of interest from outside of cells/animals is a common approach with which to examine biological consequences of a specific RES. However, these uncontrolled bolus methods result in simultaneous modifications of many biomolecules with no considerations for spatiotemporal control and/or nuances of compartmentalized redox signaling. Bulk RES exposure thus renders the protein-of-interest-specific “true” signal from multiple off-target and/or secondary responses exceedingly challenging to parse out. T-REX (Fang et al., 2013; Lin et al., 2015; Long & Aye, 2016, 2017; Long, Lin, et al., 2017; Long, Parvez, et al., 2017; Long et al., 2016; Long, Poganik, et al., 2017; Long, Urul, et al., 2017; Parvez et al., 2015; Parvez et al., 2016) was developed to circumvent these problems and interrogate these non-enzymatic yet “on-target” redox events with previously-unattainable surgical precision in live systems.
T-REX can be simply coupled with various downstream assays to enable examination of downstream consequences of precision redox signaling, giving the first glimpse at the functional consequences of precise spatiotemporal and POI-specific modifications. Examples include modulation of kinase activity in vivo with a FRET readout (Long, Parvez, et al., 2017), antioxidant response (AR) activation upon T-REX using a luciferase reporter (in lysates by luminescent assays (Parvez et al., 2015)) or GFP reporter (in live cells by flow cytometry (Parvez et al., 2016)). Additionally, modularity of T-REX in delivering structurally diverse native lipid-derived RES(Lin et al., 2015) as well as its functionality in labeling multiple privileged sensor proteins of diverse sizes and functions (Fang et al., 2013) have been demonstrated. Finally, versatility of the method has been documented from cells (E. coli to human (Fang et al., 2013)) to whole organisms, namely, C. elegans (Long, Urul, et al., 2017) and zebrafish (Long, Parvez, et al., 2017).
Critical parameters
Transfection methods
Controlling the expression level of the HaloTag-POI fusion protein is very important for the successful performance of T-REX (Fang et al., 2013). Too little expression will make analysis difficult by decreasing the possible signal that can be observed with fluorescent dyes, but too much plasmid and transfection reagent can stress the cells. The latter is critical especially for redox signaling. Unintentional stress can lead to subtle changes in cellular redox states, potentially causing artifacts in measured RES sensitivity of the POI as well as in potential downstream signaling studies. Amounts of plasmid and transfection time should be evaluated for optimal conditions.
Photouncaging parameters
The light to uncage the RES in this protocol is 365 nm, 0.5 mW/cm2 for 5 minutes. Track the light power using a handheld monitor (as outlined in Basic Protocol 1) to ensure consistency. The lamp should be properly warmed up for a consistent amount of time (5 minutes) before use and distance between the sample and the bulb should be kept constant between experiments as power varies as a function of distance. Uncaging should be checked using Basic Protocol 3 and visualizing the release of the RES with various amounts and powers of light. If it is desirable to release less than stoichiometric amounts of RES, this can be tuned by changing the light exposure time (Lin et al., 2015). The optimal time of light shining and power should be experimentally determined with the POI RES pair to be used. While not specifically described in this present protocol, careful use of the UV light (of correct power, etc.) is vital for downstream studies as UV light with longer exposure or higher power can cause perturbations in cells/organisms. If performing downstream studies, viability of the cells or organisms should be assessed after light exposure and controls should be included to ensure that effects seen are due to compound release and not only light alone. For cells, observing growth rate and the amount of dead cells shows the health of the cells. In worms, egg laying rate and appearance after light exposure is a good indicator of health.
Rinsing of Cells in T-REX
Rinsing steps in Basic Protocol 1 are important to ensure that excess compound is not present during light shining, as this would cause off-target release of RES. However, cells and therefore protein can be lost from excessive rinses and/or negligent rinsing procedure, especially if using weakly adherent cells. To minimize loss, one could mark a point on the edge of the culture plate and remove the old media and add rinse media at the same point on the plate each time, taking care to add the fresh media slow enough to avoid disturbing the monolayer of cells but quickly enough to keep the cells from drying out and dying.
Resolubilization during the biotin azide pulldown
It is important to ensure equal resolubilization of cell pellets in the biotin pulldown experiment, Basic Protocol 4. Incomplete resolubilization can lead to variations among the samples and associated data misinterpretation. When resolubilizing, pre-warm the buffer and vortex and sonicate several times. Any material not resolubilized should be removed by centrifugation and only resolubilized protein added to the streptavidin resin.
Transgenic C. elegans line generation
Prior to integrating the plasmids with radiation, the transiently expressing worms can be used for T-REX. However, the worms must be picked to selectively enrich for transgenic worms before each experiment. This can be time consuming if running a large number of samples. If using the worms with stable expression of the constructs (i.e., integrated lines), picking of transgenic worms is not necessary as homozygotes for the HaloTag-POI will always give homozygote progeny. There is no need to age-synchronize the worms for T-REX, but worms should be healthy with the edge of the OP50 field visible on the plate.
Troubleshooting
Common problems and their possible causes are outlined in Table 2.
Table 2.
Troubleshooting Common Problems
| Problem | Possible Cause | Solution |
|---|---|---|
| Poor protein expression | Transfection needs optimization | Use a different transfection reagent (i.e., 2020) or longer transfection time |
| High Cy5 background | Old SDS-PAGE running buffer/uncleaned gel plates | Use fresh buffer/bleach the glass gel plates |
| Rinse the gel in ddH2O a few times and image again to obtain better signal-to-noise ratio | ||
| Old Cy5 azide | Dissolve fresh Cy5 azide and run the Click reaction using this | |
| Fusion protein not completely cleaved by TEV | Not enough TEV activity | Do not freeze thaw TEV, use a fresh aliquot each time and mix well when adding to lysate |
| Increase concentration of TEV. Re-measure the specific activity of the TEV using methods outlined in the TEV protease recipe | ||
| Poor resolubilization during biotin pulldown | Not enough buffer | Add more 8% LDS to the pellet and sonicate longer until more of the pellet resuspends |
| High non-specific protein pulldown in biotin elution | Washes not stringent enough | Increase the percent of LDS in the wash buffer (1% LDS maximally) |
| Increase the volume of wash buffer or the number of washes | ||
| Protein pellet transferred to resin | Spin down the samples after resuspending and add only the supernatant to the resin, not any insoluble protein | |
| Targeting not seen | Concentration of Ht-PreHNE not correct | Determine concentration of the molecule using multiple methods (UV-Vis, NMR, etc.). Concentration too low could cause HaloTag sites to not be saturated, leading to low signal. Too high could lead to residual probe not being washed out and high background |
| Dilute Ht-PreHNE carefully into rinse media. The DMSO and compound is not immediately soluble in the media, so vigorously mix and use immediately after making, checking for aggregation | ||
| Lamp not working correctly, no/little uncaging | Check the power of the lamp and ensure consistency in time and power between trials | |
| Click failing (either biotin or Cy5) | Make fresh Click reagents and mix well when adding to lysate | |
| Check that lysate concentration is 0.85−1 mg/mL | ||
| Use HNE(alkyne) as a positive control | ||
| Many factors in solutions, lysing, etc. | Check solutions and make fresh wherever possible, work efficiently with proteins, recheck critical parameters | |
| Mold or fungal contamination of C. elegans stock | Can happen even with proper handling, but poor sterile technique can increase the likelihood of occurrence | Chunk a portion of the contaminated plate onto a fresh seeded plate, then allow the worms to crawl away from the chunk. After they have crawled, pick several worms onto a new plate. Repeat this serial transmission several times |
| Bacterial/yeast/heavy fungal contamination of C. elegans stocks | Poor sterile technique can increase the likelihood of heavy contamination | Allow the worms to grow until many gravid adults are present. Wash and collect worms and eggs with water. Make up to 3.5 mL, then add a solution of 0.5 mL 5 M NaOH and 1 mL household bleach. Shake/vortex the solution every 2 minutes until 10 minutes have passed. Pellet the released eggs (1300 × g, 30s), then rinse with sterile H2O (at least 2×). Pellet eggs and resuspend in 0.1mL H2O. Add the suspension to the edge of a clean seeded plate. After one day, transfer hatched worms to new, clean plates |
Anticipated Results
Results expected to be obtained from Basic Protocol 3 are shown in Figure 4. In both cases, the cells or worms should be in good health prior to beginning the T-REX protocol. For cells, this includes a normal growth rate and no excessive cell death. For worms, there should still be a visible edge to the OP50 field to ensure the worms still have plenty of food and will not enter dauer state. Additionally, eggs should be visible as a sign that the worms are reproducing normally. The uncaging can be assessed to ensure that RES is being efficiently released from the photocage. This can be tested by varying the light exposure and visualizing the release of RES-alkyne from HaloTag with Cy5-azide. Western blotting using antibodies for the epitope tags fused to the POI and HaloTag (table 1) can be used to detect the levels of HaloTag-POI fusion protein expressed in the system.
Figures 5 shows the expected results for Basic Protocol 5. The extent of enrichment of HNEylated POI following T-REX can be calculated compared to negative controls. There is approximately 4-fold enrichment (p<0.0001, using unpaired student-t test) in the PreHNE and light treated sample compared to the controls.
Figure 5. Worm data.
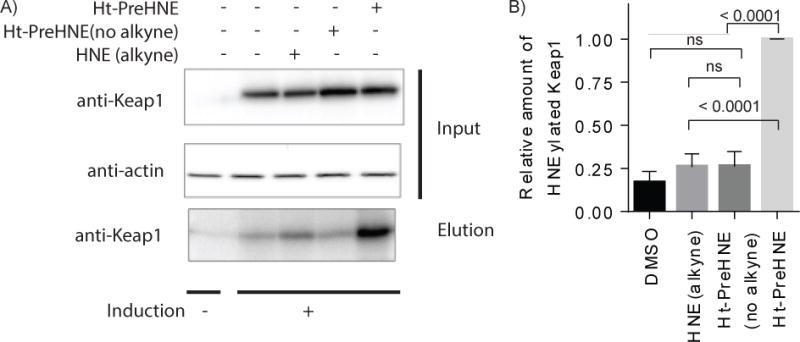
A) Biotin pulldown data from C. elegans showing enrichment of Keap1 upon T-REX treatment in live worms. In this experiment Ht-PreHNE with no alkyne handle was used as a negative control. After T-REX treatment, lysates were Clicked with biotin azide and enriched with a streptavidin pulldown. The elution shows enrichment with T-REX conditions compared to the negative controls. B) Quantification of enrichment from the various conditions. Adapted with permission from http://pubs.acs.org/doi/abs/10.1021%2Facs.biochem.7b00642.
Time considerations
Basic Protocol 1
Transfection and T-REX in Live Mammalian Cells takes approximately three to four days from plating to obtaining cell pellets. Plates for transfection are seeded on the first day and transfected on the second day (or when they reach appropriate confluence). Thirty six to forty eight hours after transfection T-REX can be performed. The T-REX procedure takes approximately 4−5 hours from the point of probe addition to the collection of cell pellets. These pellets can be stored up to 3 days at −80 °C, but it is recommended to use them for analysis as soon as possible.
Basic Protocol 2
Transgenic Line Generation and T-REX in C. elegans takes several months to generate the transgenic lines. It takes about a month for injection, selection, and validation of transiently expressing worms. Minimally six more weeks are needed for irradiating worms, picking, and backcrossing with the parent strain. After transgenic lines are available and the appropriate number of worms grown, the T-REX portion of the protocol can be completed in one day. Pellets from this should be used within three days as well.
Basic Protocol 3
Prepare Lysate with Fluorescent Dye Azide to Quantify Targeting Efficiency can be performed in two days. The first day involves lysis, TEV cleavage, and Click coupling with Cy5 azide (or another fluorescent azide), followed by running on the gel, imaging Cy5 signal, and transferring to western blot. The second day is for probing the western blot and imaging for final analysis of targeting efficiency.
Basic Protocol 4
Prepare Lysate with Biotin Azide to Quantify Targeting Occupancy from Mammalian Cells can be completed within three days. The first day involves lysis, TEV cleavage, and Click coupling with biotin azide. The second day involves enrichment of biotinylated proteins, running the elution on a gel, and transferring to a blot. The third day involves probing the blot for the final quantification.
Basic Protocol 5
Prepare Lysate with Biotin Azide to Quantify Targeting Occupancy from Worm Lysates follows the same timeline as Basic Protocol 4. The only difference is that the first day of the procedure includes a biotin preclearance step to remove endogenously biotinylated proteins.
Basic Protocol 6
LC-MS/MS Analysis of Modifications can be completed in 3 days from the point of clarified lysates. The first day is an enrichment of the POI fusion protein. The second day is a preparation and digestion of the protein and running on the mass spec. The third day is data analysis to find HNE adducts (figure 6).
Significance Statement.
Redox signaling utilizes small reactive molecules that covalently modify targets and modulate cellular decision-making. Modifying proteins largely without enzymatic guidance, these inherently reactive signaling molecules engage on-target, and even at moderate levels of modification, enable accurate downstream response. Conventional methods to study redox signaling involving uncontrolled administration of reactive species from outside of cells/animals give rise to complex responses. Bolus exposure also does not account for temporal and compartmentalized nature of redox signaling. To address these limitations, T-REX was developed to enable precision modification of a single protein, thereby linking on-target modifications directly to function. This protocol outlines the steps to perform T-REX in live mammalian cells and C. elegans, including determination of targeting efficiency and the site of modification.
Acknowledgments
Professor Jun (Kelly) Liu, Mr. Stephen Sammons, and the Liu laboratory are acknowledged for their C. elegans guidance and use of microinjection facilities. Author contributions: A.V.H-B. Experiments and Analysis (cell culture), Writing (initial manuscript and editing); Y.Z. Experimental Optimization (biotin enrichment), Writing (initial manuscript and editing); D.A.U. Experiments and Analysis (C. elegans), Writing (editing); M.J.C.L. Experiments and Analysis (C. elegans), Writing (editing); Y.A. Conceptualization, Writing, Funding acquisition. Research instrumentation, supplies, and personnel in this work are partly or fully supported by Sloan Fellowship (FG-2016-6379) (to Y.A.), NSF CAREER (CHE-1351400), Beckman Young Investigator, NIH New Innovator (1DP2GM114850) (to Y.A.), NSF Graduate Research Fellowship (DGE-1650441 to A.V.H-B. and D.A.U.), NSF MRI (CHE-1531632, PI: Y.A. for Cornell University core-facility NMR instrumentation).
Footnotes
Conflict of Interest
The authors declare no conflict of interest.
LITERATURE CITED
- Bahrami AK, Zhang Y. When females produce sperm: genetics of C. elegans hermaphrodite reproductive choice. G3: Genes, Genomes, Genetics. 2013;3(10):1851–1859. doi: 10.1534/g3.113.007914. [DOI] [PMC free article] [PubMed] [Google Scholar]
- Bogdanova YA, Schultz C, Belousov VV, Local Generation. Imaging of Hydrogen Peroxide in Living Cells. Current protocols in chemical biology. :117–127. doi: 10.1002/cpch.20. [DOI] [PubMed] [Google Scholar]
- Brewer TF, Garcia FJ, Onak CS, Carroll KS, Chang CJ. Chemical approaches to discovery and study of sources and targets of hydrogen peroxide redox signaling through NADPH oxidase proteins. Annual review of biochemistry. 2015;84:765–790. doi: 10.1146/annurev-biochem-060614-034018. [DOI] [PMC free article] [PubMed] [Google Scholar]
- Doorn JA, Petersen DR. Covalent Modification of Amino Acid Nucleophiles by the Lipid Peroxidation Products 4-Hydroxy-2-nonenal and 4-Oxo-2-nonenal. Chemical Research in Toxicology. 2002;15(11):1445–1450. doi: 10.1021/tx025590o. [DOI] [PubMed] [Google Scholar]
- Fang X, Fu Y, Long MJ, Haegele JA, Ge EJ, Parvez S, Aye Y. Temporally controlled targeting of 4-hydroxynonenal to specific proteins in living cells. Journal of the American Chemical Society. 2013;135(39):14496–14499. doi: 10.1021/ja405400k. [DOI] [PMC free article] [PubMed] [Google Scholar]
- Hellberg K, Grimsrud PA, Kruse AC, Banaszak LJ, Ohlendorf DH, Bernlohr DA. X-ray crystallographic analysis of adipocyte fatty acid binding protein (aP2) modified with 4-hydroxy-2-nonenal. Protein Sci. 2010;19(8):1480–1489. doi: 10.1002/pro.427. [DOI] [PMC free article] [PubMed] [Google Scholar]
- Higdon AN, Landar A, Barnes S, Darley-Usmar VM. The Electrophile Responsive Proteome: Integrating Proteomics and Lipidomics with Cellular Function. Antioxidants & Redox Signaling. 2012;17(11):1580–1589. doi: 10.1089/ars.2012.4523. [DOI] [PMC free article] [PubMed] [Google Scholar]
- Jacobs AT, Marnett LJ. Systems analysis of protein modification and cellular responses induced by electrophile stress. Accounts of chemical research. 2010;43(5):673–683. doi: 10.1021/ar900286y. [DOI] [PMC free article] [PubMed] [Google Scholar]
- Johnson DS, Weerapana E, Cravatt BF. Strategies for discovering and derisking covalent, irreversible enzyme inhibitors. Future medicinal chemistry. 2010;2(6):949–964. doi: 10.4155/fmc.10.21. [DOI] [PMC free article] [PubMed] [Google Scholar]
- Kraft M, Radke D, Wieland GD, Zipfel PF, Horn U. A fluorogenic substrate as quantitative in vivo reporter to determine protein expression and folding of tobacco etch virus protease in Escherichia coli. Protein Expr Purif. 2007;52(2):478–484. doi: 10.1016/j.pep.2006.10.019. [DOI] [PubMed] [Google Scholar]
- Lin HY, Haegele JA, Disare MT, Lin Q, Aye Y. A Generalizable Platform for Interrogating Target- and Signal-Specific Consequences of Electrophilic Modifications in Redox-Dependent Cell Signaling. Journal of the American Chemical Society. 2015;137(19):6232–6244. doi: 10.1021/ja5132648. [DOI] [PMC free article] [PubMed] [Google Scholar]
- Long MJC, Aye Y. The die is cast: precision electrophilic modifications contribute to cellular decision making. Chemical Research in Toxicology. 2016;29(10):1575–1582. doi: 10.1021/acs.chemrestox.6b00261. [DOI] [PMC free article] [PubMed] [Google Scholar]
- Long MJC, Aye Y. Privileged Electrophile Sensors: A Resource for Covalent Drug Development. Cell Chemical Biology. 2017;24(7):787–800. doi: 10.1016/j.chembiol.2017.05.023. [DOI] [PMC free article] [PubMed] [Google Scholar]
- Long MJC, Lin HY, Parvez S, Zhao Y, Poganik JR, Huang P, Aye Y. β-TrCP1 is a vacillatory regulator of Wnt signaling. Cell chemical biology. 2017;24(8):944–957.e947. doi: 10.1016/j.chembiol.2017.06.009. [DOI] [PMC free article] [PubMed] [Google Scholar]
- Long MJC, Parvez S, Zhao Y, Surya SL, Wang Y, Zhang S, Aye Y. Akt3 is a privileged first responder in isozyme-specific electrophile response. Nature chemical biology. 2017;13(3):333–338. doi: 10.1038/nchembio.2284. [DOI] [PMC free article] [PubMed] [Google Scholar]
- Long MJC, Poganik JR, Aye Y. On-demand targeting: investigating biology with proximity-directed chemistry. J Am Chem Soc. 2016;138(11):3610–3622. doi: 10.1021/jacs.5b12608. [DOI] [PMC free article] [PubMed] [Google Scholar]
- Long MJC, Poganik JR, Ghosh S, Aye Y. Subcellular Redox Targeting: Bridging in Vitro and in Vivo Chemical Biology. ACS chemical biology. 2017;12(3):586–600. doi: 10.1021/acschembio.6b01148. [DOI] [PMC free article] [PubMed] [Google Scholar]
- Long MJC, Urul DA, Chawla S, Lin HY, Zhao Y, Haegele JA, Aye Y. Precision Electrophile Tagging in Caenorhabditis elegans. Biochemistry. 2017 doi: 10.1021/acs.biochem.7b00642. [DOI] [PMC free article] [PubMed] [Google Scholar]
- Los GV, Encell LP, McDougall MG, Hartzell DD, Karassina N, Zimprich C, Urh M. HaloTag: a novel protein labeling technology for cell imaging and protein analysis. ACS chemical biology. 2008;3(6):373–382. doi: 10.1021/cb800025k. [DOI] [PubMed] [Google Scholar]
- Mariol MC, Walter L, Bellemin S, Gieseler K. A rapid protocol for integrating extrachromosomal arrays with high transmission rate into the C. elegans genome. J Vis Exp. 2013;(82):e50773. doi: 10.3791/50773. [DOI] [PMC free article] [PubMed] [Google Scholar]
- Ni D, Xu P, Gallagher S. Current Protocols in Molecular Biology. John Wiley & Sons, Inc; 2001. Immunoblotting and Immunodetection. [DOI] [PubMed] [Google Scholar]
- Ooi SL, Henikoff JG, Henikoff S. A native chromatin purification system for epigenomic profiling in Caenorhabditis elegans. Nucleic Acids Research. 2010;38(4):e26–e26. doi: 10.1093/nar/gkp1090. [DOI] [PMC free article] [PubMed] [Google Scholar]
- Parvez S, Fu Y, Li J, Long MJ, Lin HY, Lee DK, Aye Y. Substoichiometric hydroxynonenylation of a single protein recapitulates whole-cell-stimulated antioxidant response. Journal of the American Chemical Society. 2015;137(1):10–13. doi: 10.1021/ja5084249. [DOI] [PMC free article] [PubMed] [Google Scholar]
- Parvez S, Long MJ, Lin HY, Zhao Y, Haegele JA, Pham VN, Aye Y. T-REX on-demand redox targeting in live cells. Nature protocols. 2016;11(12):2328–2356. doi: 10.1038/nprot.2016.114. [DOI] [PMC free article] [PubMed] [Google Scholar]
- Schopfer FJ, Cipollina C, Freeman BA. Formation and signaling actions of electrophilic lipids. Chemical reviews. 2011;111(10):5997–6021. doi: 10.1021/cr200131e. [DOI] [PMC free article] [PubMed] [Google Scholar]
- Vogel K. Backcross breeding. Methods in molecular biology (Clifton, NJ) 2009;526:161. doi: 10.1007/978-1-59745-494-0_14. [DOI] [PubMed] [Google Scholar]
- Weerapana E, Wang C, Simon GM, Richter F, Khare S, Dillon MB, Cravatt BF. Quantitative reactivity profiling predicts functional cysteines in proteomes. Nature. 2010;468(7325):790–795. doi: 10.1038/nature09472. [DOI] [PMC free article] [PubMed] [Google Scholar]
- Yoshina S, Suehiro Y, Kage-Nakadai E, Mitani S. Locus-specific integration of extrachromosomal transgenes in C. elegans with the CRISPR/Cas9 system. Biochemistry and Biophysics Reports. 2016;5:70–76. doi: 10.1016/j.bbrep.2015.11.017. [DOI] [PMC free article] [PubMed] [Google Scholar]
- Zhao Y, Long MJC, Wang Y, Zhang S, Aye Y. Ube2V2 Is a Rosetta Stone Bridging Redox and Ubiquitin Codes, Coordinating DNA Damage Responses. ACS Central Science. 2018 doi: 10.1021/acscentsci.7b00556. [DOI] [PMC free article] [PubMed] [Google Scholar]