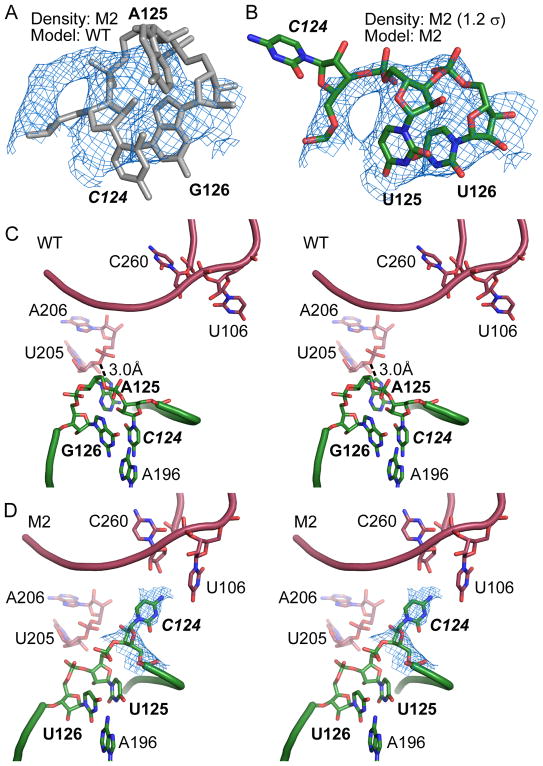
Figure 2. Generation of a new lattice contact in mutant M1.
(A) Model of WT P4–P6 (grey) positioned as a rigid body in the 2Fo-Fc map (blue) of the M1 mutant contoured at 1.5σ, showing residues 130 and 131 do not fit the electron density. (B) The M1 structure contains a local structural rearrangement that explains the 2Fo-Fc map. (C) Stereoscopic view of WT P4–P6 crystal, showing P5 region of molecule A in green and P6 region of molecule B in red. (D) The 3.14 Å resolution M1 structure shows that swapping of base-pairs in molecule A (green) positions its A131 in contact with neighboring molecule B (red). Blue mesh shows σA-weighted 2Fo-Fc map contoured at 0.8σ level. In all figures showing detailed lattice contacts, we color a mutated region undergoing local structural changes green and the molecule receiving the new contact red.

