Abstract
Recent studies have indicated that the intracellular concentration of chloride ions (Cl−) regulates gene expression in several types of cells and that Cl− modulators positively or negatively regulate the PI3K/AKT/mammalian target of rapamycin (mTOR) and signal transducer and activator of transcription (STAT)3 signaling pathways. We previously reported that the Ca2+‐activated Cl− channel anoctamine (ANO)1 regulated human epidermal growth factor receptor 2 (HER2) transcription in breast cancer YMB‐1 cells. However, the mechanisms underlying ANO1‐regulated HER2 gene expression have not yet been elucidated. In the present study, we showed the involvement of intracellular organelle ClC‐3 Cl−/H+ transporter in HER2 transcription in breast cancer MDA‐MB‐453 cells. The siRNA‐mediated inhibition of ClC‐3, but not ANO1, markedly repressed HER2 transcription in MDA‐MB‐453 cells. Subsequently, treatments with the AKT inhibitor AZD 5363 and mTOR inhibitor everolimus significantly enhanced HER2 transcription in MDA‐MB‐453 cells, whereas that with the STAT3 inhibitor 5,15‐diphenylporphyrin (5,15‐DPP) inhibited it. AKT and mTOR inhibitors also significantly enhanced HER2 transcription in YMB‐1 cells. The siRNA‐mediated inhibition of ClC‐3 and ANO1 resulted in increased AKT phosphorylation and decreased STAT3 phosphorylation in MDA‐MB‐453 and YMB‐1 cells, respectively. The intracellular Cl− channel protein CLIC1 was expressed in both cells; however, its siRNA‐mediated inhibition did not elicit the transcriptional repression of HER2. Collectively, our results demonstrate that intracellular Cl− regulation by ANO1/ClC‐3 participates in HER2 transcription, mediating the PI3K/AKT/mTOR and/or STAT3 signaling pathway(s) in HER2‐positive breast cancer cells, and support the potential of ANO1/ClC‐3 blockers as therapeutic options for patients with resistance to anti‐HER2 therapies.
Keywords: AKT, breast cancer, ClC‐3, HER2, STAT3
Abbreviations
- ACTB
β‐actin
- ANO
anoctamine
- AP
activator protein
- CLIC
chloride intracellular channel protein
- 5,15‐DPP
5,15‐diphenylporphyrin
- EBP
ErbB3‐binding protein
- EGR
early growth response protein
- Foxp
forkhead box protein
- HDAC
histone deacetylase
- HER
human epidermal growth factor receptor
- MBP‐1
major basic protein 1
- mTOR
mammalian target of rapamycin
- STAT
signal transducer and activator of transcription
1. INTRODUCTION
The ClC Cl− channel/transporter family contains nine members: ClC‐1, ‐2, ‐3, ‐4, ‐5, ‐6, ‐7, ‐Ka, and ‐Kb.1 ClC‐1, ‐2, ‐Ka, and ‐Kb function as Cl− channels that localize at the plasma membrane, whereas ClC‐3 to ‐7 function as Cl−/H+ transporters that distribute at intracellular vesicles such as endosomes/lysosomes and contribute to their acidification.2, 3 Ion channels/transporters are expressed in several organelles such as mitochondria, endoplasmic reticulum, and endosomes,4 and intracellular ion channels play a role in the control of cancer development and progression.5 Intracellular ClC‐3 is highly expressed in metastatic cancer cells, accelerates cell migration,6 and contributes to the acquisition of resistance to chemotherapeutic drugs and anti‐HER2 therapies.7 Therefore, ClC‐3 is a potential prognostic biomarker and therapeutic target for metastatic cancers. Intracellular Cl− channel CLIC members (CLIC1‐6) that localize to endosomal/lysosomal vesicles are also involved in cancer development.8, 9
A recent study by Valdivieso et al10 showed a role for Cl− channels as transcriptional regulators that control the expression of specific genes. ClC‐3 proteins localize in intracellular organelles and function as Cl−/H+ transporters.11, 12 ClC‐3 also contributes to osteo‐differentiation, and its overexpression has been shown to enhance the gene expression of osteogenic markers such as alkaline phosphatase, osteocalcin, and bone sialoprotein.13 Furthermore, inhibition of ClC‐3 downregulates the expression of the matrix metalloproteinases MMP2 and MMP9 in osteosarcoma cells.14 The Ca2+‐activated Cl− channel ANO1 plays an important role in breast cancer cell proliferation and metastasis by regulating intracellular Cl− concentrations.15, 16 Kulkarni et al17 showed that ANO1 is responsible for the regulation of HER2 signaling. HER2 belongs to an ERBB family of receptor tyrosine kinases and is downregulated through transcriptional and posttranslational mechanisms in cancer cells. Amplification of its gene is observed in approximately 30% of breast cancers, and its overexpression is associated with more aggressive tumors.18 We previously reported that inhibition of the Ca2+‐activated Cl− channel ANO1 resulted in the transcriptional repression of HER2 in HER2‐positive breast cancer YMB‐1 cells.19 However, the precise mechanisms responsible for HER2 gene expression mediated by ANO1 activation have yet to be elucidated.
PI3K/AKT/mTOR and JAK/STAT3 are both major signaling pathways that lead to breast cancer cell proliferation, and are positive and negative regulators of tumorigenesis‐related genes.20, 21 STAT3 is constitutively activated in more than 50% of breast tumors.20 Liu et al22 showed that ClC‐3 activators with potent antitumor activities inhibited the PI3K/AKT/mTOR signaling pathway. In contrast, Wong et al23 showed that the Cl− channel inhibitor exerted suppressive effects on the PI3K/AKT and JAK/STAT3 signaling pathways. HER2 is an attractive therapeutic target for gastric, colorectal, and ovarian cancers, and the STAT3 signaling pathway is associated with the high expression of HER2 in ovarian cancer.24
In the present study, we investigated the effects of siRNA‐mediated inhibition of ANO1, ClC‐3/7, and CLIC1 in HER2‐expressing MDA‐MB‐453 and YMB‐1 cells. In MDA‐MB‐453 cells, ClC‐3 proteins were expressed at intracellular vesicles and contributed to the transcriptional regulation of HER2. The present results also suggest the involvement of the PI3K/AKT/mTOR and/or JAK/STAT3 signaling pathways in ANO1/ClC‐3‐regulated HER2 transcription in HER2‐positive breast cancer cells.
2. MATERIALS AND METHODS
2.1. Chemicals
Sources of pharmacological agents were as follows: WST‐1 (Dojindo, Kumamoto, Japan), T16inh‐A01 (Tocris Bioscience, Bristol, UK), everolimus (Cayman Chemical, Ann Arbor, MI, USA), AZD 5363 (Cayman Chemical), MHY 1485 (Cayman Chemical), and DPP (Cayman Chemical). Other agents were obtained from Sigma‐Aldrich (St Louis, MO, USA) or Wako Pure Chemical Industries (Osaka, Japan).
2.2. Cell culture
Breast cancer cell lines YMB‐1 and MDA‐MB‐453 were supplied by the Health Science Research Resources Bank (HSRRB) (Osaka, Japan) and RIKEN BioResource Center (RIKEN BRC) (Tsukuba, Japan), respectively. They were maintained at 37°C in 5% CO2 with RPMI 1640 or Leibovitz's L‐15 medium (Wako Pure Chemical Industries) containing 10% FBS (Sigma) and a penicillin (100 units/mL)‐streptomycin (0.1 mg/mL) mixture (Wako Pure Chemical Industries).19
2.3. RNA extraction, reverse transcription, and real‐time PCR
Total RNA extraction from cell lines and reverse transcription were carried out as previously reported.19 cDNA products were amplified with gene‐specific PCR primers, designated using Primer Express™ software (Ver 3.0.1; Thermo Fisher Scientific, Waltham, MA, USA). Quantitative, real‐time PCR was carried out using SYBR Green chemistry on an ABI 7500 Fast real‐time PCR system (Thermo Fisher Scientific). PCR primers of human origin used in real‐time PCR are shown in Supporting information (Methods S1). Unknown quantities relative to the standard curve for a particular set of primers were calculated as previously reported,18 yielding the transcriptional quantitation of gene products relative to the endogenous standard, ACTB.
2.4. siRNA‐mediated inhibition of target genes
Lipofectamine RNAiMAX reagent (Thermo Fisher Scientific) was used in all siRNA transfection procedures.19 Commercially available siRNA oligonucleotides against ClC‐3, ClC‐4, ClC‐5, ClC‐7, CLIC1, ANO1, and control siRNA were purchased from Santa Cruz Biotechnology (Santa Cruz, CA, USA) or Thermo Fisher Scientific. Expression levels of the respective transcripts were assessed 48 hours after the transfection of siRNAs using a real‐time PCR assay. The expression levels of HER2 transcripts and proteins were assessed 72 hours after the transfection of siRNAs using real‐time PCR and western blotting, respectively.
2.5. Measurement of protein expression levels by western blotting and immunocytochemical staining
Protein lysates were prepared from MDA‐MB‐453 and YMB‐1 cells using RIPA lysis buffer for western blotting, as previously reported.19 Protein expression levels were assessed 48 hours after the compound treatment. Equal amounts of protein (20 μg/lane) were subjected to SDS‐PAGE (10%). Blots were incubated with anti‐HER2/Neu (A‐2; Santa Cruz Biotechnology), anti‐AKT, anti‐AKT Phospho (Ser473), anti‐STAT3, anti‐STAT3 Phospho (Tyr705; BioLegend, San Diego, CA, USA), and anti‐ACTB (6D1; Medical & Biological Laboratories, Nagoya, Japan) antibodies and then with anti‐mouse HRP‐conjugated IgG (Merck Millipore, Darmstadt, Germany). An ECL detection system (GE Healthcare Japan, Tokyo, Japan) was used to detect the bound antibody. The resulting images were analyzed by a VersaDoc 5000MP device (Bio‐Rad Laboratories, Hercules, CA, USA). The light intensity of the protein band signal for respective target protein relative to that of the ACTB signal was calculated using ImageJ software (Ver. 1.42, NIH, Bethesda, MD, USA), and protein expression levels in the vehicle control were then expressed as 1.0.
In the immunocytochemical assay, MDA‐MB‐453 cells were harvested using a sterile cell scraper, and fixed and permeabilized cells by the BD Cytofix/Cytoperm kit (BD Biosciences, San Jose, CA, USA) were stained using a rabbit polyclonal anti‐ClC‐3 antibody (B‐21; Santa Cruz Biotechnology) and Alexa Fluor® 488‐conjugated goat anti‐rabbit IgG secondary antibody (Thermo Fisher Scientific).25 Stained cells were subjected to an analysis using LSM 810 laser scanning confocal microscopy (Zeiss, Jena, Germany).
2.6. Statistical analysis
Significance of differences among two and multiple groups was evaluated using Student's t test and Tukey's test after the F test or ANOVA, respectively. Significance at P < .05 and P < .01 is indicated in the figures. Data are presented as the means ± SEM.
3. RESULTS
3.1. Transcriptional repression of HER2 by siRNA‐mediated ClC‐3 Cl−/H+ transporter inhibition in MDA‐MB‐453 cells
We previously identified transcriptional repression of HER2 by a treatment with Ca2+‐activated Cl− channel ANO1 inhibition in human breast cancer YMB‐1 cells.19 However, these suppressive effects by ANO1 inhibition were not found in HER2‐positive breast cancer MDA‐MB‐453 cells.19 In YMB‐1 cells, large Ca2+‐activated Cl− currents were observed by whole‐cell patch clamp recording, and viability was significantly reduced by pharmacological blockade and siRNA‐mediated inhibition of ANO1,26 whereas the viability of MDA‐MB‐453 cells was not affected by ANO1 inhibition.19 In this study, no significant changes were noted in the expression levels of HER2 transcripts by treatment with T16inh‐A01 (T16inh, 10 μmol/L), a specific ANO1 inhibitor (n = 4 for each, P > .05; Figure 1A). Concomitant with these results, no significant changes were noted in the expression levels of HER2 proteins by the treatment with T16inh in MDA‐MB‐453 cells (n = 4 for each, P > .05; Figure 1B). However, the other Cl− channels/transporters expressed in MDA‐MB‐453 cells may contribute to the transcriptional repression of HER2.
Figure 1.

Effects of treatment with an anoctamine (ANO)1 blocker, T16inh‐A01, for 48 h on expression levels of human epidermal growth factor receptor 2 (HER2) in MDA‐MB‐453 cells, and expression of ClC and chloride intracellular channel protein (CLIC) members in MDA‐MB‐453 cells. A, Real‐time PCR assay for HER2 in vehicle‐ and 10 μmol/L T16inh‐A01 (T16inh)‐treated MDA‐MB‐453 cells (n = 4 for each). Expression levels were expressed as a ratio to β‐actin (ACTB). B, Protein lysates of vehicle‐ and 10 μmol/L T16inh‐treated MDA‐MB‐453 cells were probed by immunoblotting with anti‐HER2 (upper panel) and anti‐ACTB (lower panel) antibodies on the same filter. Summarized results were obtained as described in Section 2.5 from HER2 and ACTB band signals. After compensation, the HER2 signal in the vehicle control was expressed as 1.0 (n = 4 for each). C, D, Real‐time PCR assay for 7 ClC subtypes (ClC‐1‐ClC‐7) (C) and 6 CLIC subtypes (CLIC1‐CLIC6) (D) in MDA‐MB‐453 cells (n = 3 for each). Results are expressed as means ± SEM
We first identified the ClC subtypes expressed in MDA‐MB‐453 cells. Among the nine ClC members, the ClC‐3 and ClC‐7 transcripts were highly expressed in MDA‐MB‐453 cells (Figure 1C). We also identified the intracellular Cl− channel member CLIC1‐6 transcripts in MDA‐MB‐453 cells, with CLIC1 being predominantly expressed (Figure 1D). As shown in Figure 2A, transcriptional repression of HER2 was elicited by the siRNA‐mediated inhibition of ClC‐3, but not ANO1, ClC‐7, or CLIC1 (control siRNA [si‐cont]; n = 4 for each, P < .01 vs si‐cont). The inhibitory efficacy of each siRNA‐mediated target gene was more than 50% (Figure S1). The siRNA‐mediated inhibition of ClC‐3, but not ANO1, ClC‐7, or CLIC1 significantly reduced HER2 protein levels in MDA‐MB‐453 cells (n = 4 for each, P < .01 vs si‐cont; Figure 2B‐D). These results suggest that ClC‐3 Cl−/H+ transporter regulates HER2 transcription in breast cancer cells.
Figure 2.
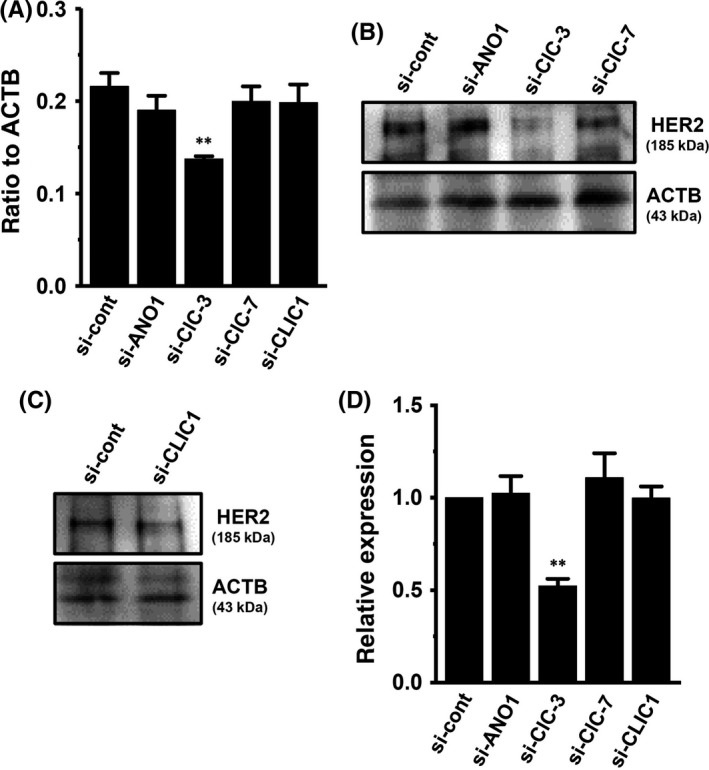
Effects of siRNA‐mediated inhibition of ClC‐3, ClC‐7, and chloride intracellular channel protein 1 (CLIC)1 on expression levels of human epidermal growth factor receptor 2 (HER2) transcripts in MDA‐MB‐453 cells. A, Real‐time PCR assay for HER2 in control siRNA (si‐cont)‐, ANO1 siRNA (si‐ANO1)‐, ClC‐3 siRNA (si‐ClC‐3)‐, ClC‐7 siRNA (si‐ClC‐7)‐, and CLIC1 siRNA (si‐CLIC1)‐transfected MDA‐MB‐453 cells for 72 h. Expression levels were expressed as a ratio to β‐actin (ACTB). B‐D, Protein lysates of si‐cont‐, si‐ANO1‐, si‐ClC‐3‐, si‐ClC‐7‐, and si‐CLIC1‐transfected MDA‐MB‐453 cells were probed by immunoblotting with anti‐HER2 and anti‐ACTB antibodies on the same filter (B, C). Summarized results were obtained as described in Section 2.5 from HER2 and ACTB band signals (D). After compensation, the HER2 signal in the si‐cont group was expressed as 1.0 (n = 4 for each). Results are expressed as means ± SEM. **P < .01 vs si‐cont. ANO, anoctamine
3.2. Intracellular distribution of ClC‐3 in MDA‐MB‐453 cells
Guzman et al12 reported differential subcellular localization of 3 neuronal‐type ClC‐3 splice isoforms. In heterologous mammalian expression system, ClC‐3a and ClC‐3b localized to the late endosomal/lysosomal system, whereas ClC‐3c was found in recycling endosome and plasma membrane. Depolarization‐induced outward currents were in ClC‐3c‐expressed HEK293 cells alone.12 In order to visualize intracellular ClC‐3 protein localization using laser scanning confocal microscopy, the immunocytochemical staining of ClC‐3 in MDA‐MB‐453 cells was carried out with an anti‐ClC‐3 antibody and Alexa Fluor 488 anti‐rabbit IgG antibody. As shown in Figure 3A,B, fluorescent signals showed a punctate labeling pattern at the cytosol, but not at the plasma membrane. The spectral line profile of fluorescence (Figure 3C) showed that ClC‐3 proteins were not distributed at the plasma membrane, suggesting that MDA‐MB‐453 may express ClC‐3a and/or ClC‐3b but not ClC‐3c. Similar images were obtained from over 90% cells (n >20). Fluorescent signals disappeared following the siRNA‐mediated inhibition of ClC‐3 (P < .01 vs control siRNA; Figure 3D,E,H). ClC‐3 amino acid sequences are close to ClC‐4 and ClC‐5; however, no significant differences in fluorescence signals of ClC‐3 were found in either ClC‐4 siRNA‐ or ClC‐5 siRNA‐transfected cells (Figure 3F‐H). Common mechanisms for HER2 transcription mediating ANO1 and ClC‐3 may exist in breast cancer cells.
Figure 3.
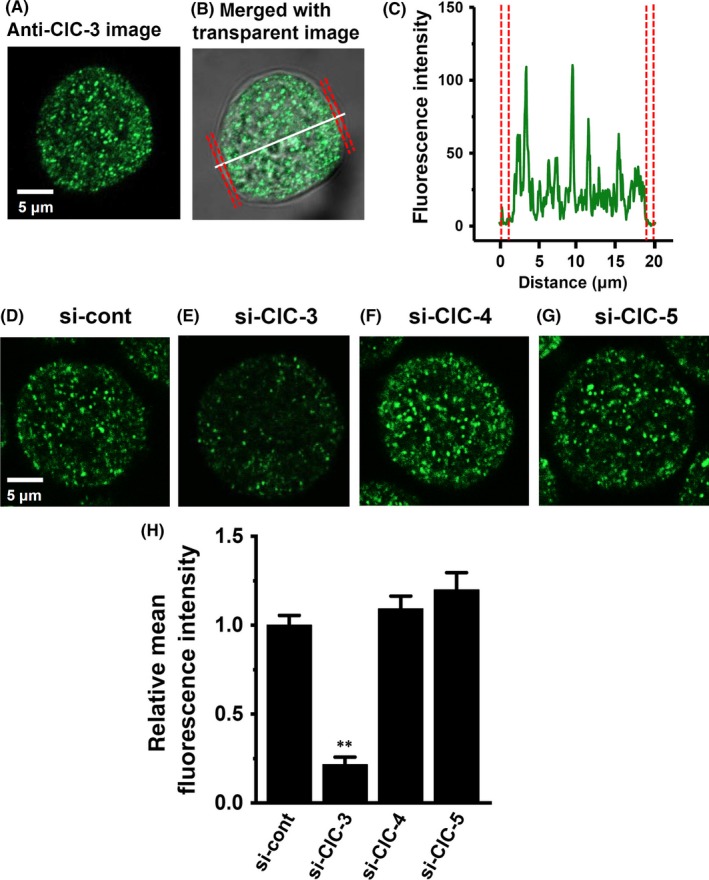
Cellular distribution of ClC‐3 in MDA‐MB‐453 cells. (A‐C) Immunocytochemical staining of MDA‐MB‐453 cells for ClC‐3. A, Confocal images of a cell labeled with anti‐ClC‐3 and Alexa Fluor 488 anti‐rabbit IgG antibodies. B, a fluorescent image merged with a transparent image. C, the profile of fluorescence intensity on the white dotted line in (B) is shown in “green”. The plasma membrane is shown in ‘red’. D‐H, ClC‐3 fluorescent images in control siRNA (si‐cont) (D)‐, ClC‐3 siRNA (si‐ClC‐3) (E)‐, ClC‐4 siRNA (si‐ClC‐4) (F)‐, and ClC‐5 siRNA (si‐ClC‐5)‐transfected MDA‐MB‐453 cells for 72 h. Mean fluorescent intensity in the si‐cont group was expressed as 1.0 (n = 24 for each); summarized data are shown in (H). Results are expressed as means ± SEM. **P < .01 vs si‐cont
3.3. Involvement of AKT/mTOR and STAT3 signaling pathways in the regulation of HER2 transcription mediating ClC‐3 in MDA‐MB‐453 cells
In breast cancer cells, the PI3K/AKT/mTOR and JAK/STAT3 signaling pathways are both major regulators of tumorigenesis‐related gene expression.20, 21 In order to identify the contribution of their signaling pathways to HER2 transcription, the effects of a treatment with the AKT inhibitor AZD 5363 (1 μmol/L), the mTOR inhibitor everolimus (10 nmol/L), the mTOR activator MHY 1465 (2 μmol/L), or the STAT3 inhibitor 5,15‐DPP (10 μmol/L) for 24 hours on the expression levels of HER2 transcripts were examined using real‐time PCR assays. As shown in Figure 4A,B, the respective inhibition of AKT and mTOR induced significant increases (approximately 3‐fold) in HER2 transcription in MDA‐MB‐453 cells. Inhibition of STAT3 subsequently induced a significant decrease in HER2 transcription (Figure 4D). Correspondingly, the AKT/mTOR inhibition‐induced upregulation and STAT‐3 inhibition‐induced downregulation of HER2 was observed at the protein level using western blotting (Figure 4E,F,H). Activation of mTOR induced significant decreases in HER2 transcript and protein levels (Figure 4C,G). In order to determine direct effects of ClC‐3 inhibition on the activation of AKT and STAT3, we examined the effects of siRNA‐mediated inhibition of ClC‐3 on AKT and STAT3 phosphorylation (P‐AKT and P‐STAT3) in MDA‐MB‐453 cells by western blotting. After compensation of the expression levels of AKT, P‐AKT, STAT3, and P‐STAT3 proteins by ACTB, the ratios of P‐AKT to AKT and P‐STAT3 to STAT3 in the control siRNA‐transfected group (si‐cont) were arbitrarily expressed as 1.0, respectively. As shown in Figure 5A,B, siRNA‐mediated inhibition of ClC‐3 (si‐ClC‐3) resulted in increased AKT phosphorylation and decreased STAT3 phosphorylation in MDA‐MB‐453 cells (n = 6 for each, P < .01 vs si‐cont). Significant changes in AKT and STAT3 phosphorylation were not found by siRNA‐mediated inhibition of ANO1 in MDA‐MB‐453 cells (Figure S2A,B).
Figure 4.
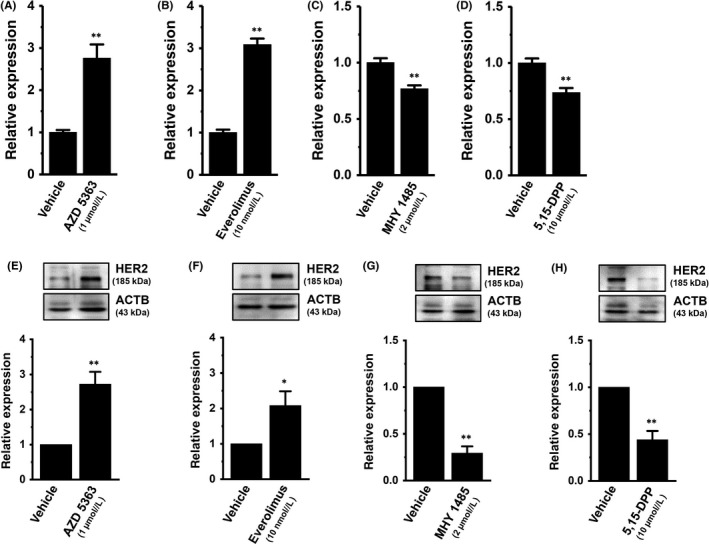
Effects of the treatment with the AKT kinase inhibitor AZD 5363 (1 μmol/L), the mammalian target of rapamycin (mTOR) inhibitor everolimus (10 nmol/L), the mTOR activator MHY 1485 (2 μmol/L), and the signal transducer and activator of transcription (STAT)3 inhibitor 5,15‐diphenylporphyrin (5,15‐DPP; 10 μmol/L) on expression levels of human epidermal growth factor receptor 2 (HER2) transcripts (for 24 h) and proteins (for 48 h) in MDA‐MB‐453 cells. A‐D, Real‐time PCR assay for HER2 in AZD 5363‐ (A), everolimus‐ (B), MHY 1485‐ (C), and 5,15‐DPP‐treated MDA‐MB‐453 cells (D) (n = 4 for each). Expression levels are expressed as a ratio to β‐actin (ACTB). E‐H, Protein lysates of AZD 5363‐ (E), everolimus‐ (F), MHY 1485‐ (G), and 5,15‐DPP‐treated MDA‐MB‐453 cells (H) were probed by immunoblotting with anti‐HER2 (upper panel) and anti‐ACTB (lower panel) antibodies on the same filter. After compensation, the HER2 signal in the vehicle control was expressed as 1.0 (n = 4 for each). Results are expressed as means ± SEM. *,**P < .05, .01 vs the vehicle control
Figure 5.
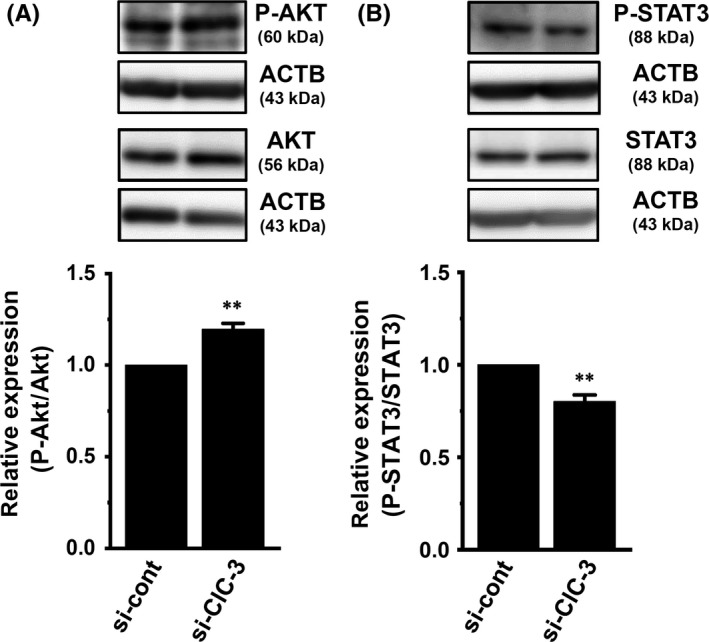
Effects of siRNA‐mediated inhibition of ClC‐3 for 72 h on the expression levels of phosphorylated AKT (P‐AKT) and phosphorylated STAT3 (P‐STAT3) proteins in MDA‐MB‐453 cells. A, B, Protein lysates of control siRNA (si‐cont) and ClC‐3 siRNA (si‐ClC‐3)‐transfected MDA‐MB‐453 cells were probed by immunoblotting with anti‐P‐AKT, anti‐AKT, and anti‐ACTB (A) or anti‐P‐STAT3, STAT3, and ACTB (B). After compensation, the ratio of P‐AKT to AKT or P‐STAT3 to STAT3 in si‐cont was expressed as 1.0 (n = 6 for each). Results are expressed as means ± SEM. **P < .01 vs si?cont. ACTB, β‐actin; STAT, signal transducer and activator of transcription
3.4. Involvement of AKT/mTOR, but not STAT3 signaling pathway in the regulation of HER2 transcription in breast cancer YMB‐1 cells
We identified ClC and CLIC Cl− channel members in YMB‐1 cells. Similar to MDA‐MB‐453 cells, ClC‐3 and CLIC1 were the main components of their members in YMB‐1 cells (Figure 6A,B). A previous study indicated that the inhibition of ANO1 induced a significant decrease in HER2 transcription in YMB‐1 cells.19 In YMB‐1 cells, siRNA‐mediated inhibition of ClC‐3 did not affect HER2 transcription (Figure 6C). Similar to MDA‐MB‐453 cells, no significant changes were observed in HER2 transcription by the siRNA‐mediated inhibition of ClC‐7 or CLIC1 in YMB‐1 cells (Figure 6C). The siRNA‐mediated inhibition of ANO1 significantly reduced gene and protein expression levels of HER2 in YMB‐1 cells (Figure 6D; Figure S3A,B).19 As shown in Figure 7A,B, the respective inhibition of AKT and mTOR induced a significant increase in HER2 transcription in YMB‐1 cells. Correspondingly, the AKT/mTOR inhibition‐induced upregulation of HER2 was observed at the protein level (Figure 7D,E). In contrast to MDA‐MB‐453 cells, the inhibition of STAT3 did not significantly affect HER2 expression in YMB‐1 cells (Figure 7C,F). In order to determine the direct effects of ANO1 inhibition on the activation of AKT and STAT3, we next examined the effects of siRNA‐mediated inhibition of ANO1 on P‐AKT and P‐STAT3 in YMB‐1 cells by western blotting. As shown in Figure 8A,B, siRNA‐mediated inhibition of ANO1 (si‐ANO1) resulted in increased AKT phosphorylation and decreased STAT3 phosphorylation in YMB‐1 cells (n = 6 for each, P < .01 vs si‐cont). Significant changes in AKT and STAT3 phosphorylation were not found by the siRNA‐mediated inhibition of ClC‐3 in YMB‐1 cells (Figure S2C,D).
Figure 6.
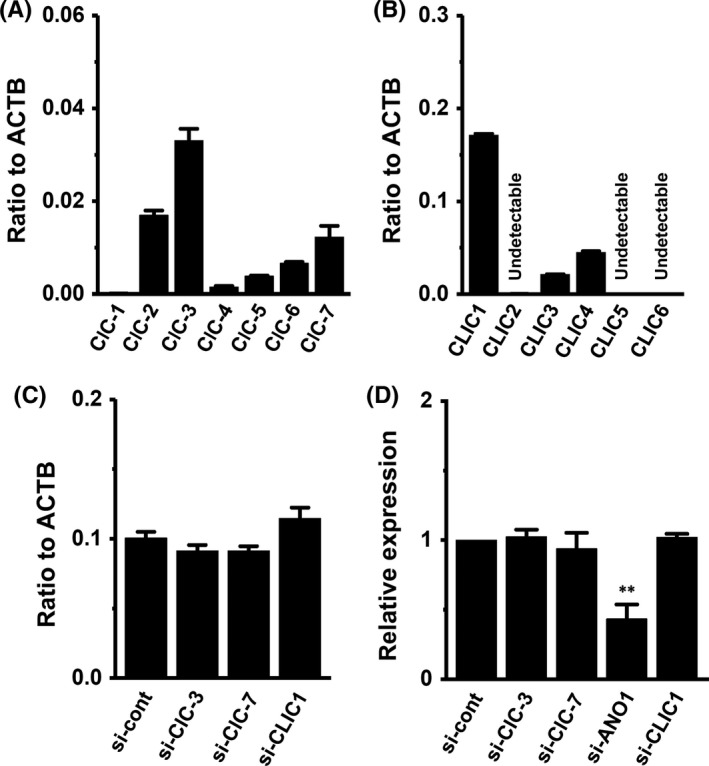
Distribution of ClC and chloride intracellular channel protein (CLIC) subtype transcripts and effects of siRNA‐mediated inhibition of YMB‐1 cells. A, B, Real‐time PCR assay for 7 ClC subtypes (ClC‐1‐ClC‐7) (A) and 6 CLIC subtypes (CLIC1‐CLIC6) in YMB‐1 cells (n = 3 for each). C, Real‐time PCR assay for human epidermal growth factor receptor 2 (HER2) in control siRNA (si‐cont)‐, ClC‐3 siRNA (si‐ClC‐3)‐, ClC‐7 siRNA (si‐ClC‐7)‐, and CLIC1 siRNA (si‐CLIC1)‐transfected YMB‐1 cells for 72 h. Expression levels are expressed as a ratio to β‐actin (ACTB). D, Protein lysates of si‐cont‐, si‐ClC‐3‐, si‐ClC‐7‐, si‐ANO1‐, and si‐CLIC1‐transfected YMB‐1 cells were probed by immunoblotting with anti‐HER2 and anti‐ACTB antibodies on the same filter (Figure S2A,B). After compensation, the HER2 signal in the si‐cont group was expressed as 1.0 (n = 4 for each). Results are expressed as means ± SEM. **P < .01 vs si‐cont
Figure 7.
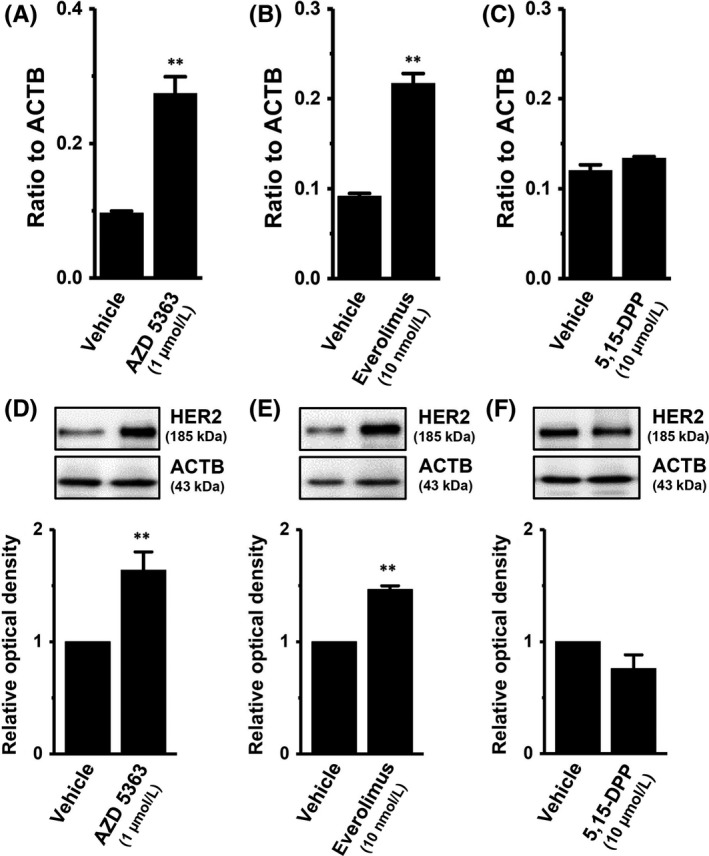
Effects of treatment with the AKT kinase inhibitor AZD 5363 (1 μmol/L), the mammalian target of rapamycin (mTOR) inhibitor everolimus (10 nmol/L), and the signal transducer and activator of transcription (STAT)3 inhibitor 5,15‐diphenylporphyrin (5,15‐DPP; 10 μmol/L) for 24 h on the expression levels of human epidermal growth factor receptor 2 (HER2) transcripts and proteins in YMB‐1 cells. A‐C, Real‐time PCR assay for HER2 in AZD 5363‐ (A), everolimus‐ (B), and 5,15‐DPP‐treated YMB‐1 cells (C) (n = 4 for each). Expression levels were expressed as a ratio to β‐actin (ACTB). D‐F, Protein lysates of AZD 5363‐ (D), everolimus‐ (E), and 5,15‐DPP‐treated (F) YMB‐1 cells were probed by immunoblotting with anti‐HER2 (upper panel) and anti‐ACTB (lower panel) antibodies on the same filter. After compensation, the HER2 signal in the vehicle control was expressed as 1.0 (n = 4 for each). Results are expressed as means ± SEM. **P < .01 vs the vehicle control
Figure 8.
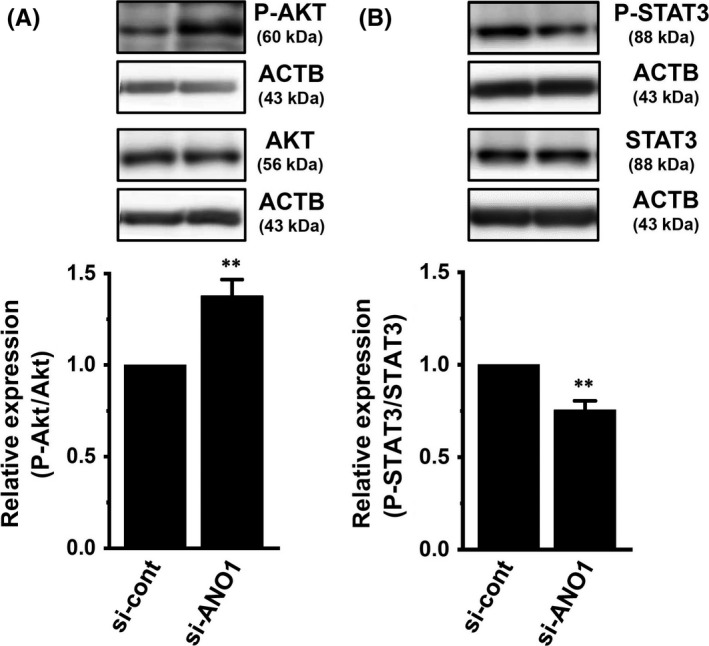
Effects of siRNA‐mediated inhibition of ANO1 for 72 h on the expression levels of phosphorylated AKT (P‐AKT) and phosphorylated STAT3 (P‐STAT3) proteins in YMB‐1 cells. A, B, Protein lysates of control siRNA (si‐cont) and ANO1 siRNA (si‐ANO1)‐transfected YMB‐1 cells were probed by immunoblotting with anti‐P‐AKT, anti‐AKT, and anti‐ACTB (A) or anti‐P‐STAT3, STAT3, and ACTB (B). After compensation, the ratio of P‐AKT to AKT or P‐STAT3 to STAT3 in si‐cont was expressed as 1.0 (n = 6 for each). Results are expressed as means ± SEM. **P < .01 vs the vehicle control. ACTB, β‐actin; ANO, anoctamine; STAT, signal transducer and activator of transcription
3.5. Effects of siRNA‐mediated inhibition of ClC‐3 and ANO1 on expression levels of transcriptional factors of HER2, and histone deacetylases in MDA‐MB‐453 and YMB‐1 cells
Previous studies indicated that: (i) HER2 transcription is regulated by several transcriptional factors: AP‐2, EGR2, and STAT3 as positive regulators, and Foxp3, EBP1, and MBP‐1 as negative regulators; and (ii) the expression level of HER2 positively correlates with that of HDAC6 in breast cancer cells.27, 28 Three members of AP‐2 are expressed in breast cancer: AP‐2α, β, and γ. As shown in Figure 9, no significant changes were observed in the expression levels of the HER2 transcription regulators examined (AP‐2α, AP‐2β, AP‐2γ, STAT3, EBP1, MBP‐1, and HDAC6) following the siRNA‐mediated inhibition of ClC‐3 in MDA‐MB‐453 cells. EGR2 and Foxp3 transcripts were less abundantly expressed in MDA‐MB‐453 cells (not shown). Similarly, no significant changes were noted in these molecules following the pharmacological blockade and siRNA‐mediated inhibition of ANO1 in YMB‐1 cells (Figure 9 and Figure S4).
Figure 9.
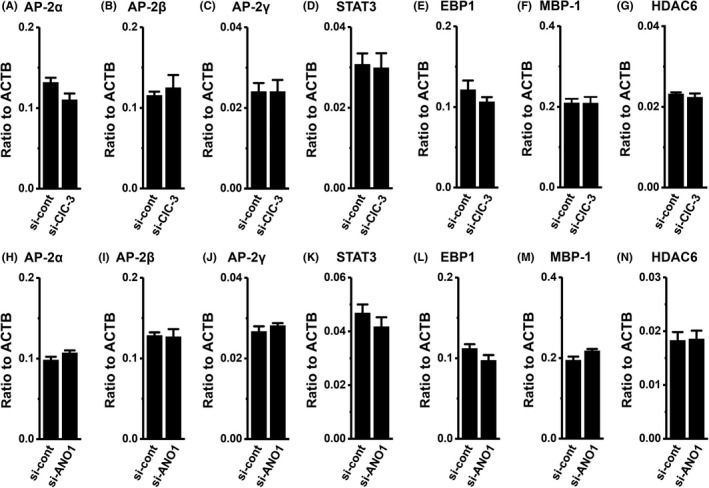
Effects of siRNA‐mediated inhibition of ClC‐3 and ANO1 on expression levels of human epidermal growth factor receptor 2 (HER2)‐related transcriptional factor transcripts in MDA‐MB‐453 and YMB‐1 cells, respectively. Real‐time PCR assay for AP‐2α (A, H), AP‐2β (B, I), AP‐2γ (C, J), STAT3 (D, K), EBP1 (E, L), MBP‐1 (F, M), and HDAC6 (G, N) in control siRNA (si‐cont) and ClC‐3 siRNA (si‐ClC‐3)‐transfected MDA‐MB‐453 cells for 72 h (A‐G) and ANO1 siRNA (si‐ANO1)‐transfected YMB‐1 cells for 72 h (H‐N), respectively. Expression levels were expressed as a ratio to ACTB (n = 4 for each). Results are expressed as means ± SEM. ANO, anoctamine; AP, activator protein; EBP, ErbB3‐binding protein; HDAC, histone deacetylase; MBP‐1, major basic protein 1; STAT, signal transducer and activator of transcription
4. DISCUSSION
We recently showed that inhibition of the Ca2+‐activated Cl− channel ANO1 downregulated the expression of HER2 in breast cancer YMB‐1 cells.19 However, no significant changes in HER2 transcription levels were noted following pharmacological inhibition (Figure 1A,B) of ANO1 in MDA‐MB‐453 cells. In MDA‐MB‐453 cells, siRNA‐mediated inhibition of ClC‐3 Cl−/H+ transporter exerted transcriptional repression of HER2 (Figure 2). ANO1 and ClC‐3 both promote tumor metastasis and are associated with a poor prognosis.6, 29 ANO1 proteins are localized at the plasma membrane and regulate membrane potential,30 whereas ClC‐3 proteins are distributed among intracellular organelles such as endosomes and lysosomes, and are involved in vesicular acidification and Cl− accumulation as a Cl−/H+ transporter.2, 31 As shown in Figure 3, ClC‐3 proteins were expressed in intracellular vesicles in MDA‐MB‐453 cells. Recent studies indicated that ClC‐3 proteins are transcriptional regulators that control gene expression such as osteogenic markers;13, 14 however, the regulatory mechanisms underlying Cl− channel/transporter‐induced modifications to gene expression have yet to be elucidated. The most important results of the present study are those clarifying the involvement of the PI3K/AKT/mTOR and JAK/STAT3 signaling pathways in the Cl− channel/transporter‐induced modification of HER2 transcription in breast cancer cells. A previous study reported that CLIC1 promoted transcription of the pro‐inflammatory cytokine, interleukin (IL)‐1β in LPS‐stimulated macrophages.32 Among the 6 members of intracellular Cl− channels, CLIC, CLIC1 was predominantly expressed in MDA‐MB‐453 and YMB‐1 cells (Figures 1D and 6B); however, the siRNA‐mediated inhibition of CLIC1 did not repress HER2 transcription in either cell (Figures 2A and 6C).
The PI3K/AKT/mTOR and JAK/STAT3 signaling pathways are both crucial regulators of tumorigenesis‐related gene expression.20, 21 Liu et al22 discovered that ClC‐3 activators inhibited the PI3K/AKT/mTOR signaling pathway in the human nasopharyngeal cancer cell line CNE‐1. As shown in Figures 4A‐C and 7A,B, the expression levels of HER2 transcripts were markedly increased by the respective treatments with AKT and mTOR inhibitors in MDA‐MB‐453 and YMB‐1 cells. In addition, the siRNA‐mediated inhibition of ClC‐3 and ANO1 significantly enhanced AKT phosphorylation, respectively (Figures 5A and 8A). These results suggest that the ANO1/ClC‐3 inhibition‐induced activation of the PI3K/AKT/mTOR signaling pathway may be involved in the transcriptional repression of HER2 in breast cancer cells. STAT3 is constitutively activated in breast cancer cells,20 and the activated STAT3 signaling pathway is associated with high HER2 levels.24 Previous studies demonstrated that inhibition of the PI3K/AKT and JAK/STAT3 signaling pathways reduced glioblastoma cell proliferation, migration, and invasion.33, 34 Similar to these findings, our study showed significant suppression of the viability of MDA‐MB‐453 cells by treatments with the AKT inhibitor AZD 5363, the mTOR inhibitor everolimus, and the STAT3 inhibitor 5,15‐DPP (not shown). Figures 5B and 8B show that siRNA‐mediated inhibition of ClC‐3 and ANO1 significantly suppressed STAT3 phosphorylation, respectively. Expression levels of HER2 transcripts were significantly decreased by the treatment with the STAT3 inhibitor in MDA‐MB‐453 cells (Figure 4D). In contrast, no significant decrease in HER2 transcription by this treatment was noted in YMB‐1 cells (Figure 7C). Chang et al35 showed that inhibition of ANO5 activated the JAK/STAT3 signaling pathway in thyroid cancer cells. High ANO1 activity in YMB‐1 cells may prevent the constitutive JAK/STAT3 signaling pathway.
Transcription of the HER2 gene is regulated by a number of transcriptional factors such as AP‐2, EGR2, and STAT3 as positive regulators, and Foxp3, EBP1, and MBP‐1 as negative regulators.27 As shown in Figure 9, no significant changes in the expression levels of their transcripts were noted following the siRNA‐mediated inhibition of ClC‐3 and ANO1 in MDA‐MB‐453 and YMB‐1 cells. Our previous study showed high expression levels of HDAC1, 2, 3, and 6 in both cell lines.19 Seo et al36 reported a positive correlation between HER2 and HDAC6, but not HDAC1, 2, or 3 in breast cancer cells. As shown in Figure 9G,N, no significant changes in the expression level of HDAC6 by the siRNA‐mediated inhibition of ClC‐3 or ANO1 were found in either cell line.
Constitutive activation of the PI3K/AKT/mTOR signaling pathway results in resistance to trastuzumab and other anti‐HER2 therapies.37 Pohlmann et al38 showed that trastuzumab elevated levels of phosphorylated AKT and AKT kinase activity. As shown in Figures 5A and 8A, ANO1/ClC‐3 inhibition enhanced AKT phosphorylation in YMB‐1 and MDA‐MB‐453 cells. These results suggest that ClC‐3 inhibitor might promote trastuzumab resistance through activation of the PI3K/AKT/mTOR signaling pathway. Kulkarni et al17 recently reported that ANO1 contributed to the acquirement of resistance to anti‐HER2 therapies. However, our main finding is that ANO1/ClC‐3 inhibition downregulates the expression levels of HER2 proteins through transcriptional repression of it, suggesting that targeting ANO1/ClC‐3 may prevent resistance to anti‐HER2 therapies in breast cancer. Further studies will be needed to clarify the clinical implications of ANO1/CIC‐3 targeting to prevent resistance to anti‐HER2 therapies. AKT/mTOR inhibitors also reduce resistance to HER2‐targeted therapy, thereby improving the management of patients with resistance to anti‐HER2 therapies.39 In the present study, AKT/mTOR inhibitors induced marked increases in HER2 expression (Figures 4 and 7). A recent study showed that activation of the STAT3 signaling pathway promoted trastuzumab resistance in HER2‐overexpressing breast cancer cells.40 Therefore, co‐targeting HER2 and AKT/mTOR/STAT3 may prevent resistance to anti‐HER2 therapies in breast cancer.
In conclusion, the present results indicate the importance of ANO1/ClC‐3 in therapeutics for HER2‐positive breast cancer with resistance to anti‐HER2 therapies. ANO1 expression has been investigated in cancer patients categorized according to estrogen receptor, progesterone receptor, and HER2, and a recent report showed that breast cancer cells resistant to trastuzumab showed upregulation of ANO1.17 Correlation between chemotherapy drug resistance and ClC‐3 expression is well known;7 however, ClC‐3 expression in categorized cancer patients has not been sufficiently studied. Further studies will be needed to clarify the correlation between ClC‐3 expression and HER2 expression/trastuzumab resistance in a particular cancer patient. Anti‐HER2 therapies such as trastuzumab are molecular targeting drugs used in the treatment of gastric, colorectal, and cervical cancers.28, 41, 42 The STAT3 signaling pathway is associated with high expression levels of HER2 in cervical cancer cells,42 and ClC‐3 is highly expressed in the HER2‐positive gastric cancer cell line NCT‐N87 (not shown). ClC‐3 Cl−/H+ transporter in addition to ANO1 may be novel and effective targets for the treatment of HER2‐positive cancers. Further studies on Cl−‐regulated tumor target gene regulation will provide novel therapeutic approaches for molecular targeting treatments in cancer.
CONFLICTS OF INTEREST
Authors declare no conflicts of interest for this article.
Supporting information
ACKNOWLEDGMENTS
The authors thank K. Endo and M. Matsui for their technical assistance. This work was supported by a research grant from JSPS KAKENHI [JP16K08285]. Medical English Service (Kyoto, Japan) reviewed the manuscript prior to its submission.
Fujimoto M, Kito H, Kajikuri J, Ohya S. Transcriptional repression of human epidermal growth factor receptor 2 by ClC‐3 Cl−/H+ transporter inhibition in human breast cancer cells. Cancer Sci. 2018;109:2781–2791. 10.1111/cas.13715
REFERENCES
- 1. Jentsch TJ. Discovery of CLC transport proteins: cloning, structure, function and pathophysiology. J Physiol. 2015;593:4091‐4109. [DOI] [PMC free article] [PubMed] [Google Scholar]
- 2. Stauber T, Jentsch TJ. Chloride in vesicular trafficking and function. Annu Rev Physiol. 2013;75:453‐477. [DOI] [PubMed] [Google Scholar]
- 3. Stölting G, Fischer M, Fahlke C. CLC channel function and dysregulation in health and disease. Front Physiol. 2014;5:378. [DOI] [PMC free article] [PubMed] [Google Scholar]
- 4. Peruzzo R, Biasutto L, Szabò I, Leanza L. Impact of intracellular ion channels on cancer development and progression. Eur Biophys J. 2016;45:685‐707. [DOI] [PMC free article] [PubMed] [Google Scholar]
- 5. Xu H, Martinoia E, Szabo I. Organellar channels and transporters. Cell Calcium. 2015;58:1‐10. [DOI] [PMC free article] [PubMed] [Google Scholar]
- 6. Xu B, Jin X, Min L, et al. Chloride channel‐3 promotes tumor metastasis by regulating membrane ruffling and is associated with poor survival. Oncotarget. 2014;6:2434‐2450. [DOI] [PMC free article] [PubMed] [Google Scholar]
- 7. Hong S, Bi M, Wang L, Kang Z, Ling L, Zhao C. CLC‐3 channels in cancer (review). Oncol Rep. 2015;33:507‐514. [DOI] [PubMed] [Google Scholar]
- 8. Macpherson IR, Rainero E, Mitchell LE, et al. CLIC3 controls recycling of late endosomal MT1‐MMP and dictates invasion and metastasis in breast cancer. J Cell Sci. 2014;127:3893‐3901. [DOI] [PubMed] [Google Scholar]
- 9. Chiang PC, Chou RH, Chien HF, Tsai T, Chen CT. Chloride intracellular channel 4 involves in the reduced invasiveness of cancer cells treated by photodynamic therapy. Lasers Surg Med. 2014;45:38‐47. [DOI] [PubMed] [Google Scholar]
- 10. Valdivieso AG, Clauzure M, Massip‐Copiz M, Santa‐Coloma TA. The chloride anion acts as a second messenger in mammalian cells – modifying the expression of specific genes. Cell Physiol Biochem. 2016;38:49‐64. [DOI] [PubMed] [Google Scholar]
- 11. Guzman RE, Grieschat M, Fahlke C, Alekov AK. ClC‐3 is an intracellular chloride/proton exchanger with large voltage‐dependent nonlinear capacitance. ACS Chem Neurosci. 2013;4:994‐1003. [DOI] [PMC free article] [PubMed] [Google Scholar]
- 12. Guzman RE, Miranda‐laferte E, Franzen A, Fahlke C. Neuronal ClC‐3 splice variants differ in subcellular localizations, but mediate identical transport functions. J Biol Chem. 2015;290:25852‐25862. [DOI] [PMC free article] [PubMed] [Google Scholar]
- 13. Wang H, Mao Y, Zhang B, et al. Chloride channel ClC‐3 promotion of osteogenic differentiation through Runx2. J Cell Biochem. 2016;111:49‐58. [DOI] [PubMed] [Google Scholar]
- 14. Du S, Yang L. ClC‐3 chloride channel modulates the proliferation and migration of osteosarcoma cells via AKT/GSK3β signaling pathway. Int J Clin Pathol. 2015;8:1622‐1630. [PMC free article] [PubMed] [Google Scholar]
- 15. Wang H, Zou L, Ma K, et al. Cell‐specific mechanisms of TMEM16A Ca2+‐activated chloride channel in cancer. Mol Cancer. 2017;16:152. [DOI] [PMC free article] [PubMed] [Google Scholar]
- 16. Wu H, Wang H, Guan S, et al. Cell‐specific regulation of proliferation by Ano1/TMEM16A in breast cancer with different ER, PR, and HER2 status. Oncotarget. 2017;8:84996‐85013. [DOI] [PMC free article] [PubMed] [Google Scholar]
- 17. Kulkarni S, Bill A, Godse NR, et al. TMEM16A/ANO1 suppression improves response to antibody‐mediated targeted therapy of EGFR and HER2/ERBB2. Genes Chromosom Cancer. 2017;56:460‐471. [DOI] [PMC free article] [PubMed] [Google Scholar]
- 18. Krishnamurti U, Silverman JF. HER2 in breast cancer: a review and update. Adv Anat Pathol. 2014;21:100‐107. [DOI] [PubMed] [Google Scholar]
- 19. Fujimoto M, Inoue T, Kito H, et al. Transcriptional repression of HER2 by ANO1 Cl− channel inhibition in human breast cancer cells with resistance to trastuzumab. Biochem Biophys Res Commun. 2017;482:188‐194. [DOI] [PubMed] [Google Scholar]
- 20. Chung SS, Giehl N, Wu Y, Vadgama JV. STAT3 activation in HER2‐overexpressing breast cancer promotes epithelial‐mesenchymal transition and cancer stem cell traits. Int J Oncol. 2014;44:403‐411. [DOI] [PMC free article] [PubMed] [Google Scholar]
- 21. Paplomata E, O'Regan R. The PI3K/AKT/mTOR pathway in breast cancer: targets, trials and biomarkers. Ther Adv Med Oncol. 2014;6:154‐166. [DOI] [PMC free article] [PubMed] [Google Scholar]
- 22. Liu J, Zhang D, Li Y, et al. Discovery of bufadienolides as a novel class of ClC‐3 chloride channel activators with antitumor activities. J Med Chem. 2013;56:5734‐5743. [DOI] [PubMed] [Google Scholar]
- 23. Wong R, Chen W, Zhong X, Rutka JT, Feng ZP, Sun HS. Swelling‐induced chloride current in glioblastoma proliferation, migration, and invasion. J Cell Physiol. 2018;233:363‐370. [DOI] [PubMed] [Google Scholar]
- 24. Shang AQ, Wu J, Bi F, et al. Relationship between JAK/STAT‐SOCS3 signaling pathway and clinicopathological features and prognosis of ovarian cancer. Cancer Biol Ther. 2017;18:314‐322. [DOI] [PMC free article] [PubMed] [Google Scholar]
- 25. Endo K, Kurokawa N, Kito H, Nakakura S, Fujii M, Ohya S. Molecular identification of the dominant‐negative, splicing isoform of the two‐pore domain K+ channel K2P5.1 in lymphoid cells and enhancement of its expression by splicing inhibition. Biochem Pharmacol. 2015;98:440‐452. [DOI] [PubMed] [Google Scholar]
- 26. Matsuba S, Niwa S, Muraki K, et al. Downregulation of Ca2+‐activated Cl− channel TMEM16A by the inhibition of histone deacetylase in TMEM16A‐expressing cancer cells. J Pharmacol Exp Ther. 2014;351:510‐518. [DOI] [PubMed] [Google Scholar]
- 27. Dittrich A, Gautrey H, Browell D, Tyson‐Capper A. The HER2 signaling network in breast cancer–Like a spider in its web. J Mammary Gland Biol Neoplasia. 2014;19:253‐270. [DOI] [PubMed] [Google Scholar]
- 28. Seo AN, Kwak Y, Kim DW, et al. HER2 status in colorectal cancer: its clinical significance and the relationship between HER2 gene amplification and expression. PLoS One. 2014;9:e98528. [DOI] [PMC free article] [PubMed] [Google Scholar]
- 29. Ruiz C, Martins JR, Rudin F, et al. Enhanced expression of ANO1 in head and neck squamous cell carcinoma causes cell migration and correlates with poor prognosis. PLoS One. 2012;7:e43265. [DOI] [PMC free article] [PubMed] [Google Scholar]
- 30. Tian Y, Schreiber R, Kunzelmann K. Anoctamins are a family of Ca2+‐activated Cl− channels. J Cell Sci. 2012;125:4991‐4998. [DOI] [PubMed] [Google Scholar]
- 31. Hara‐Chikuma M, Yang B, Sonawane ND, Sasaki S, Uchida S, Verkman AS. ClC‐3 chloride channels facilitate endosomal acidification and chloride accumulation. J Biol Chem. 2005;280:1241‐1247. [DOI] [PubMed] [Google Scholar]
- 32. Domingo‐Fernandez R, Coll RC, Kearney J, Breit S, O'Neill LAJ. The intracellular chloride channel proteins CLIC1 and CLIC4 induce IL‐1β transcription and activate the NLRP3 inflammasome. J Biol Chem. 2017;292:12077‐12087. [DOI] [PMC free article] [PubMed] [Google Scholar]
- 33. Chen WL, Turloca E, Sun CL, et al. Xyloketal B suppresses glioblastoma cell proliferation and migration in vitro through inhibiting TRPM7‐regulated PI3K/Akt and MEK/ERK signaling pathways. Mar Drugs. 2015;13:2505‐2525. [DOI] [PMC free article] [PubMed] [Google Scholar]
- 34. Liu M, Inoue K, Leng T, Guo S, Xiong ZG. TRPM7 channels regulate glioma stem cell through STAT3 and Notch signaling pathways. Cell Signal. 2016;26:33440‐33450. [DOI] [PMC free article] [PubMed] [Google Scholar]
- 35. Chang Z, Cai C, Han D, et al. Anoctamin5 regulates cell migration and invasion in thyroid cancer. Int J Oncol. 2017;51:1311‐1319. [DOI] [PubMed] [Google Scholar]
- 36. Seo J, Min SK, Park HR, et al. Expression of histone deacetylases HDAC1, HDAC2, HDAC3, and HDAC6 in invasive ductal carcinomas of the breast. J Breast Cancer. 2014;17:323‐331. [DOI] [PMC free article] [PubMed] [Google Scholar]
- 37. Rimawi MF, Schiff R, Osborne CK. Targeting HER2 for the treatment of breast cancer. Annu Rev Med. 2015;66:111‐128. [DOI] [PubMed] [Google Scholar]
- 38. Pohlmann PR, Mayer IA, Mernaugh R. Resistance to trastuzumab in breast cancer. Clin Cancer Res. 2009;15:7479‐7491. [DOI] [PMC free article] [PubMed] [Google Scholar]
- 39. Yardley DA. Combining mTOR inhibitors with chemotherapy and other targeted therapies in advanced breast cancer: rational, clinical experience, and future directions. Breast Cancer (Auckl). 2013;7:7‐22. [DOI] [PMC free article] [PubMed] [Google Scholar]
- 40. Aghazadeh S, Yazdanparast R. Activation of STAT3/HIF‐1α/Hes‐1 axis promotes trastuzumab resistance in HER2‐overexpressing breast cancer cells via down‐regulation of PTEN. Biochim Biophys Acta. 2017;1861:1970‐1980. [DOI] [PubMed] [Google Scholar]
- 41. Aoyagi K, Kouhuji K, Kizaki J, Isobe T, Hashimoto K, Shirouzu K. Molecular targeting to treat gastric cancer. World J Gastroenterol. 2014;20:13741‐13755. [DOI] [PMC free article] [PubMed] [Google Scholar]
- 42. Oh DY, Kim S, Choi YL, et al. HER2 as a novel therapeutic target for cervical cancer. Oncotarget. 2015;6:36219‐36230. [DOI] [PMC free article] [PubMed] [Google Scholar]
Associated Data
This section collects any data citations, data availability statements, or supplementary materials included in this article.
Supplementary Materials


