

Abstract
Autophagy plays an important role in multiple myeloma (MM) for homeostasis, survival and drug resistance, but which genes participate in this process is unclear. We identified several cytoskeleton genes upregulated in MM patients by gene expression profiling (GEP) datasets; in particular, patients with high profilin 1 (PFN1) expression had poor prognosis in MM. In vitro, overexpressed PFN1 promotes proliferation and bortezomib (BTZ) resistance in MM cells. Further study indicated overexpression of PFN1 significantly promoted the process of autophagy and induced BTZ resistance in MM. Otherwise, knockdown of PFN1 blocked autophagy and sensitized MM to BTZ. Co‐immunoprecipitation in MM cells indicated that PFN1 could bind Beclin1 complex and promote the initiation of autophagy. Inhibition of autophagy by blocking the formation of Beclin1 complex could reverse the phenotype of BTZ resistance in MM. Our findings suggested that PFN1 could promote autophagy through taking part in Beclin1 complex and contribute to BTZ resistance, which may become a novel molecular target in the therapy of MM.
Keywords: autophagy, cell proliferation, drug resistance, multiple myeloma, profilin
1. INTRODUCTION
Multiple myeloma (MM) is a plasma cell‐derived hematological malignancy, with multiple abnormal genes and high heterogeneity of subclones.1 Over the past decades, although the approval of proteasome inhibitor bortezomib (BTZ) enabled a great breakthrough in the treatment of MM, it also caused more and more drug‐resistant patients, and this problem is still occurring.2, 3 The mechanisms of BTZ resistance are very complicated including chromosomal translocations, oncogene (eg, TP53) mutations and deranged signaling pathways (eg, NF‐κB), but the underlying mechanism is still poorly known.
Autophagy is an important mechanism for maintaining cellular homeostasis that can resist extra‐ and intracellular stress to maintain normal physiological function. Autophagy can suppress tumorigenesis in the initiation of cancer, but it can also facilitate tumor progression in the later stages of cancer.4 Hence, autophagy is a two‐edged sword protecting tumors from drug treatment.5 With a massive amount of Ig synthesis in MM, a significant amount of unfolded and misfolded proteins are aggregated, which activate the unfolded protein response (UPR) and autophagy‐lysosome pathway. High level of autophagy contributes to intercellular homeostasis and drug resistance of MM.6, 7 Thus, targeting autophagy provides a new insight for treatment of relapsed/refractory MM.
Profilin 1 (PFN1) is a 15 kDa protein, ubiquitously expressed in mammalian cells, which was found highly expressed in our gene expression profiling (GEP) data of MM. It is thought to be a key regulator of actin polymerization in cells.8 PFN1 can bind actin with ATP and ADP, which maintains the speed of actin polymerization during the elongation of new filaments by controlling the exchange of binding with ATP and ADP. It also has 2 other domains that can bind the poly‐l‐proline (PLP) domain and PIP2 or PIP3. PLP domain of PFN1 can bind other cytoskeleton proteins, which engages in general motility functions, such as cell migration, cytokinesis,9 membrane trafficking and endocytosis in all cell types. It was previously reported that phosphoinositide binding of profilin 1 can inhibit phospholipase‐Cγ (PLCγ)‐mediated PI(4,5)P2 hydrolysis, which led to a speculation that profilin 1 could be a phosphoinositide regulator. Another in vitro assay also found that binding of PFN1 to phosphatidylinositol‐4,5‐bisphosphate [PI(4,5)P2] promotes the formation of lipid vesicles.10 These study suggested that PFN1 may have an ability to participate in the formation of intracellular vesicles, including in the initial formation of autophagosome.
In the present study, we studied PFN1 in MM pathogenesis, in particular, the relationship between PFN1 and BTZ resistance. Furthermore, we targeted PFN1 in MM cell lines to investigate the role of PFN1 in autophagy and the mechanism of PFN1‐induced drug resistance through autophagy. This study will show a novel target in the therapy of MM patients to BTZ resistance.
2. MATERIALS AND METHODS
2.1. Study subjects
Nineteen primary MM patients including 59 samples at baseline, after chemotherapy (pre‐1st, pre‐2nd, and post‐2nd autologous stem cell transplantation [ASCT]), were obtained from Huntsman Cancer Institute, University of Utah, according to the protocol 25009. Studies were approved by the Institutional Review Board of the University of Utah. GEP database accession number for MM samples to analyze the expression of PFN1 is GSE 5900, GSE 2658 and GSE19554.
2.2. Chemicals and antibodies
3‐Methyladenine (3‐MA) was obtained from Selleckchem (Houston, TX, USA). Antibodies used were LC3B, Beclin‐1 p‐P38, p‐JNK and PARP (Cell Signaling Technology, Danvers, MA, USA), PFN1 (Abcam, Cambridge, MA, USA), Bcl‐2 and GAPDH (Santa Cruz Biotechnology, Dallas, TX, USA). All of these antibody dilution ratios were 1:1000.
2.3. Cell culture and treatment
8226, 8226 R10R cell lines were cultured in RPMI 1640 medium (Gibco, Gaithersburg, MA, USA), 293T was cultured in DMEM medium (Gibco). All cell lines were supplemented with 10% FBS (Gibco), 100 U/mL penicillin and 100 μg/mL streptomycin (Thermo Fisher Scientific, Waltham, MA, USA) in 5% CO2 at 37°C.
2.4. Patient samples and primary human CD138+ cell isolation
Human patient samples were treated in accordance with the ethical standards of the Central South University Institutional Review Board Committee on human experimentation and committee‐approved procedures were used. Bone marrow aspirates were obtained from patients with myeloma, and subjects who underwent bone marrow aspirate procedure for other disease who were found to have normal plasma cells. Primary human CD138+ cells were isolated by human CD138 enrichment kit (CD138+ Plasma Cell Iso. Kit; Miltenyi Biotech, Bergisch Gladbach, Germany).
2.5. Cell viability and cell cycle assay
Cell viability was measured using CCK‐8 according to the manufacturer's protocol (Vazyme Biotech Co., Nanjing, China). Absorbance was measured at 450 nmol/L using a microplate reader (Randox Toxicology, Crumlin, UK). Cells were cultured for 48 hours with complete medium after starvation for 24 hours, then fixed and stained following the protocol of the cell cycle staining kit (Multisciences (Lianke) Biotech Co., Ltd, Ghangzhou, China).
2.6. Soft agar clonogenic assay and apoptosis assay
Ten thousand cancer cells per well were seeded in 12‐well plates for layer agar cultures and treated by multiple drugs at different dosages for 3 weeks. Cells were resuspended in 0.3% agar in 20% FBS. Cells were fed twice a week by placing 2 drops of medium on the layer with or without drugs. Photos of all plates were taken under microscope, and colony number in the photo was scanned and counted.
For the apoptosis assay, all procedures followed the standard protocol (Annexin V‐PE/7‐AAD Apoptosis Detection Kit; BD Biosciences, Franklin Lakes, NJ, USA). Cells undergoing apoptosis were fixed and phycoerythrin (PE)‐conjugated Annexin‐V was used to visualize the early stage of apoptotic cells and 7‐AAD was used to visualize the later stage of apoptotic cells and analyzed by flow cytometry.
2.7. Real‐time RT‐PCR
Total RNA was isolated from cells harvested at logarithmic phase. cDNA was synthesized using oligo(dT)18 primers. Real‐time RT‐PCR was conducted in an Mastercycler ep realplex (Eppendorf, Hamburg, Germany) using SYBR Green qPCR Mix. Primers for PFN1 mRNA were as follows: forward 5′‐GTTCGTCAACATCACGCCAG‐3′; reverse: 5′‐GTCCCGGATCACCGAACATT‐3′. Primers for Beclin1 mRNA: forward 5′‐TCAGGAGGAAGCTCAGTATCA‐3′; reverse 5′‐GTCTGGGCATAACGCAT CT‐3′. Primers for PFN2 mRNA: forward 5′‐GGGCGTCTTTCAGAGCATTA‐3′; reverse 5′‐TTCGCGCCAAGAGTCAAA‐3′. Primers for GAPDH mRNA: forward 5′‐TCGGAGTCAACGGATTTGGT‐3′; reverse 5′‐TGGAATTTGCCAT GGGTGGA‐3′.
2.8. siRNA transfection
Profilin 1 siRNA and control scramble siRNA were transfected into MM cells according to the manufacturer's protocol (RiboBio, Guangzhou, China). After 24 hours, expression of PFN1 was checked and then used for the subsequent assay. Two PFN1 siRNAs were used: PFN1 siRNA‐1 sequence is ACC GUG GAC ACC UUC UUU; PFN1 siRNA‐2 sequence is GCA AAG ACC GGU CAA GUU U.
2.9. Plasmid construction and transfection
Human PFN1 coding sequence was amplified from human cDNA by PCR using Pfu DNA Polymerase high fidelity (TransGen biotech Co., Beijing, China) and cloned into pLVX vectors by the ClonExpress II One Step Cloning Kit (Vazyme Biotech Co.). Primer pairs for the pLVX vector are as follows: 5′‐ TTCCTCGAGACTAGTTCTAGAATGGCCGGGTGGAACGCCTAC‐3′ and 5′‐ GGAGGGAGAGGGGCGGGATCCTCAGTACTGGGAACGCCGAAG‐3′ (Sangon Biotech, Shanghai, China). Red fluorescent protein‐light‐chain 3 (LC3‐GFP) adenovirus was purchased from Genomeditech Co. (Shanghai, China). All genes were transfected into cells by lentivirus infection.
2.10. Transmission electron microscopy
Cells were fixed with 2.5% glutaraldehyde for 24 hours, post‐fixed with 2% OsO4 for 2 hours, followed by dehydration. Thin sections (50 nm) were cut on an ultramicrotome (LKB‐3 microtome, Stockholm, Sweden) and stained with uranyl acetate and lead citrate. Images were visualized by transmission electron microscope (TEM; HT7700, Tokyo, Japan).
2.11. Protein extraction, western blotting, and co‐immunoprecipitation
Whole cell lysates were prepared using RIPA buffer (Thermo Fisher Scientific) in the presence of a protease inhibitor and PhosStop (Roche, Basel, Switzerland). Protein concentration was quantified using BCA Kit (Thermo Fisher Scientific). Equal amounts of protein were blotted, and the blots were incubated with primary antibody, and HRP conjugated secondary antibody. Blots were developed using the Luminata Western HRP Substrate (Millipore, Burlington, MA, USA) and Gene Genius Bio‐imaging System (Bio‐Rad, Hercules, CA, USA). Co‐IP followed the protocol of the IP kit (Thermo Fisher Scientific).
2.12. Statistical analysis
All data are shown as means ± SD. Student's t test was used to compare 2 experimental groups. Correlation of PFN1 expression with overall survival was measured using the Kaplan‐Meier method, and the log‐rank test was used for group comparison. For comparison among the different groups from the GEP dataset, 1‐way analysis of variance by SPSS 21.0 (IBM Corp. Released 2013. IBM SPSS Statistics for Windows, Version 21.0. IBM Corp., Armonk, NY, USA) was used and significance was set at P < .05.
3. RESULTS
3.1. High PFN1 expression is linked to poor prognosis in myeloma
To evaluate whether the expression of PFN1 is linked with progression and prognosis of MM in patients, public MM GEP datasets GSE 5900 and GSE 2658 were analyzed. We detected PFN1 and 21 other cytoskeleton genes related to PFN1 (including ANXA1, CFL1, CLTA, CLTB, CLTC, DBN1, DNM1, ENAH, FMN1, GPHN, HTT, NCKAP1, PALLD, PCLO, SYN1, SYN2, SYN3, SYNJ1, SYNJ2, VASP, VCP), and found that the expression of PFN1 and 5 other cytoskeleton‐related genes CFL1, CLTA, CLTC, HTT, GPHN was higher in 351 patients with newly diagnosed MM compared with expression in 22 healthy donors and 44 subjects with monoclonal gammopathy of undetermined significance (MGUS) (Figure 1A). Sequential GEP data of 9 MM patients showed that PFN1 and 7 other cytoskeleton‐related genes FMN1, ENAH, VASP, CFL1, CLTA, HTT, ANXA were increased in advanced stages of MM (Figure 1B). MM were further defined into 7 disease subtypes, which were strongly influenced by known genetic lesions, such as c‐MAF‐ MAFB‐, CCND1‐ and CCND3‐, and MMSET‐activating translocations and hyperdiploidy.11 Patients with high expression of PFN1 were distributed into subgroups PR and MF (Figure 1C). PR (Proliferation) subgroup was characterized by overexpression of numerous cell cycle‐ and proliferation‐related genes, and comprised varying fractions of each of the other 6 subgroups. The PR subgroup dominated at relapse, suggesting that this signature is linked to disease progression. MF subgroup was defined by t(14;16)(q32;q23) and t(14;20)(q32;q11) translocations which resulted in activation of c‐MAF and MAFB proto‐oncogenes. Both of these 2 translocations are high‐risk factors in the prognosis of MM. High expression of PFN1 in these 2 groups indicates that PFN1 may also be correlated with the progression and prognosis of MM. Protein expression of PFN1 is significantly high in partial CD138+ cells of MM patients, compared to the constituted low expression in normal plasma cells (Figure 1D), which suggests that PFN1 plays a role in the progression of MM. Survival analysis using GEP data found that high expression of PFN1 is correlated with poor prognosis of MM patients (Figure 1E). These data suggest that PFN1 is a gene related to MM and may take part in MM progression.
Figure 1.
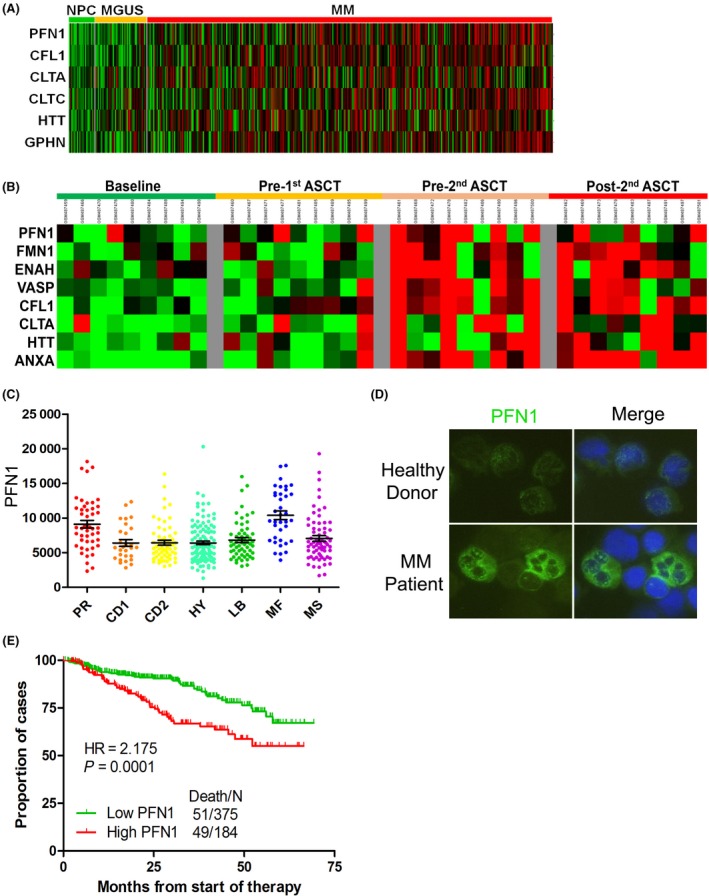
Profilin 1 (PFN1) increases with the progression of multiple myeloma (MM) and is related to the prognosis. A, Expression of PFN1 and other cytoskeleton‐related genes from microarray analysis of samples obtained from healthy donors, monoclonal gammopathy of undetermined significance (MGUS), and MM patients. B, Complete sample set (at diagnosis, pre‐1st, pre‐2nd and post‐2nd transplants) was available for 9 of the 19 patients. Expression of PFN1 and other cytoskeleton‐related genes was obtained to estimate the changes of PFN1 and other cytoskeleton‐related genes at different MM stages. C, Different classifications of MM were identified from microarray to analyze the function of PFN1 in MM (*P < .05). D, Protein expression of PFN1 in primary human BM CD138+ cells. Primary human CD138+ cells were isolated from bone marrow (BM) aspirates of normal subjects and patients with myeloma. Expression of PFN1 was detected by immunofluorescence. E, Kaplan‐Meier analysis of overall survival is shown in relation to PFN1 expression determined by gene expression profiling. High expression of PFN1 conferred a short overall survival. NPC, normal plasma cell; HR, hazard ratio.
3.2. Overexpression of PFN1 promotes proliferation through accelerating the cell cycle from G1 to S phase
Profilin 1 is expressed at a relatively high level in MM cell lines, whereas PFN2 has almost no expression (Figure 2A). First, we checked PFN1 expression in 6 MM cell lines, namely ANBL‐6, MM.1R, MM.1S, ARP1, KMS11, and 8226 (clinical information is provided in Table S1).According to the results (Figure 2B). Then we overexpressed PFN1 in 8226 and 8226 R10R (Figure 2C). Meanwhile, we knocked down PFN1 in MM.1R and MM.1S to study the function of PFN1 in MM. We constructed PFN1 overexpression cell lines by infecting pLVX‐PFN1 lentivirus into 8226 and 8226 R10R MM cell lines, and we confirmed the expression of PFN1 by western blot (WB) (Figure 2C). To determine the role of PFN1 in myeloma cell growth, we measured cell viability at different time points and cell cycles. Compared to empty vector (EV) groups, PFN1 overexpression (OE) groups showed accelerated cell viability and a faster cell growth trend compared to the control (Figure 2D). We also knocked down PFN1 in MM.1R and MM.1S using siRNA, then measured cell viability and clonogenesis ability, and found they were all significantly decreased in the siPFN1 groups (Figure S1). After PFN1 overexpression, cells of the G1 phase were decreased, which transferred to the S and G2/M phases, indicating that cells of PFN1 OE have active proliferation compared with control cells. In a further study, we found that the phosphorylation level of proliferation and cell cycle‐related genes p38 and JNK were increased in PFN1 overexpression cells and decreased in PFN1 knockdown cells (Figure S2A,B), which suggested that PFN1 may promote proliferation through the MAPK pathway. Furthermore, the anti‐apoptotic protein BCL2 also changed as PFN1 changed (Figure S1A,B), indicating that PFN1 may be related to cell apoptosis and autophagy. These results showed that PFN1 functions in cell proliferation in MM.
Figure 2.
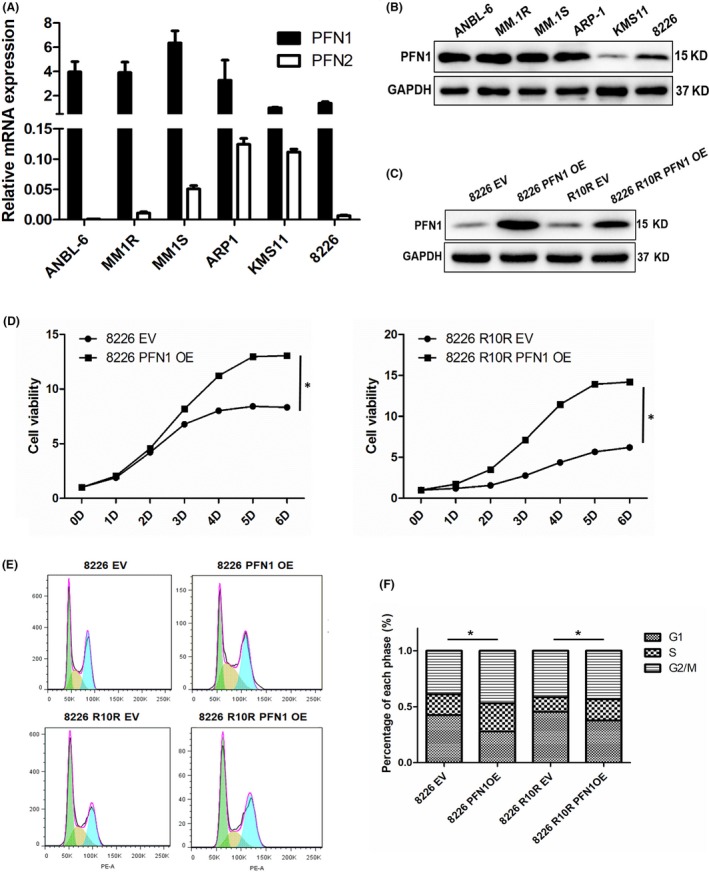
Overexpression of profilin 1 (PFN1) promotes cell growth. A, mRNA expression of PFN1 and PFN2 in myeloma cell lines was measured by RT‐qPCR. GAPDH was used as a control. B, Protein expression of PFN1 in myeloma cell lines was measured by western blotting. GAPDH was used as a control. C, 8226 and 8226 R10R cells were transiently transfected with pLVX empty vector (EV) or pLVX‐PFN1 OE, and expression of PFN1 was detected by western blot. D, CCK‐8 assay was used to check cell viability after 8226 and 8226 R10R cells were transfected with EV or PFN1 OE for various times. Data are presented as mean ± SD (n = 3, *P < .01). E and F, Cell cycle was checked in 8226 and 8226 R10R cells transfected with EV and PFN1 OE. Percentage of different stages (G1, S and G2/M) was compared between EV and PFN1 OE cells of 8226 and 8226 R10R. EV, empty vector; OE, overexpression vector. (*P < .01)
3.3. Overexpression of PFN1 contributes to BTZ resistance in MM
To estimate the function of PFN1 in BTZ resistance, we used the MM cell line 8226 R10R which was resistant to BTZ, and the IC50 was approximately 17 nmol/L, whereas the IC50 of the wild‐type 8226 cell line was approximately 5 nmol/L. We measured the expression of PFN1 in these 2 cell lines by WB, and the BTZ resistance cell line 8226 R10R had higher expression of PFN1 than the wild‐type cell line 8226 (Figure 3A). We then treated 8226 EV/PFN1OE and R10R NC (Negative Control)/siPFN1 cell lines with BTZ for concentration gradient, and IC50 was increased in the 8226 PFN1 OE group and decreased in the 8226 R10R siPFN1 groups (P < .05, Figure 3C). We also measured cell apoptosis by flow cytometry after treatment with BTZ for 24 hours, and the results showed that compared with the 8226 EV group, the 8226 PFN1 OE group was more resistant to BTZ with few apoptotic cells, 8226 R10R cells treated with BTZ showed little apoptosis, but when PFN1 was knocked down in the 8226 R10R cell line, apoptotic cells increased significantly, which suggests that PFN1‐conferred drug resistance is associated with decreased apoptosis (Figure 3D,E). Clonogenic soft agar assay was then carried out to examine the effect of PFN1 on cancer cell growth and drug resistance. We overexpressed PFN1 in the 8226 cell line and knocked down PFN1 in the 8226 R10R cell line (Figure 3F,G). 8226 PFN1 OE cells showed a significant increase in colony formation, indicating that high levels of PFN1 promote cancer cell proliferation and, compared with the NC group, 8226 PFN1 OE cells showed only a slight decrease in their capacity to form colonies for BTZ. However, control cells transfected with empty vector showed a significant decrease in colony formation when incubated with BTZ at the same concentrations (Figure 3F). In contrast, colony formation was decreased when PFN1 was knocked down in 8226 R10R cells and, compared with non‐treated controls, 8226 R10R PFN1 knocked down cells showed a significant decrease in their capacity to form colonies for BTZ (Figure 3G).
Figure 3.
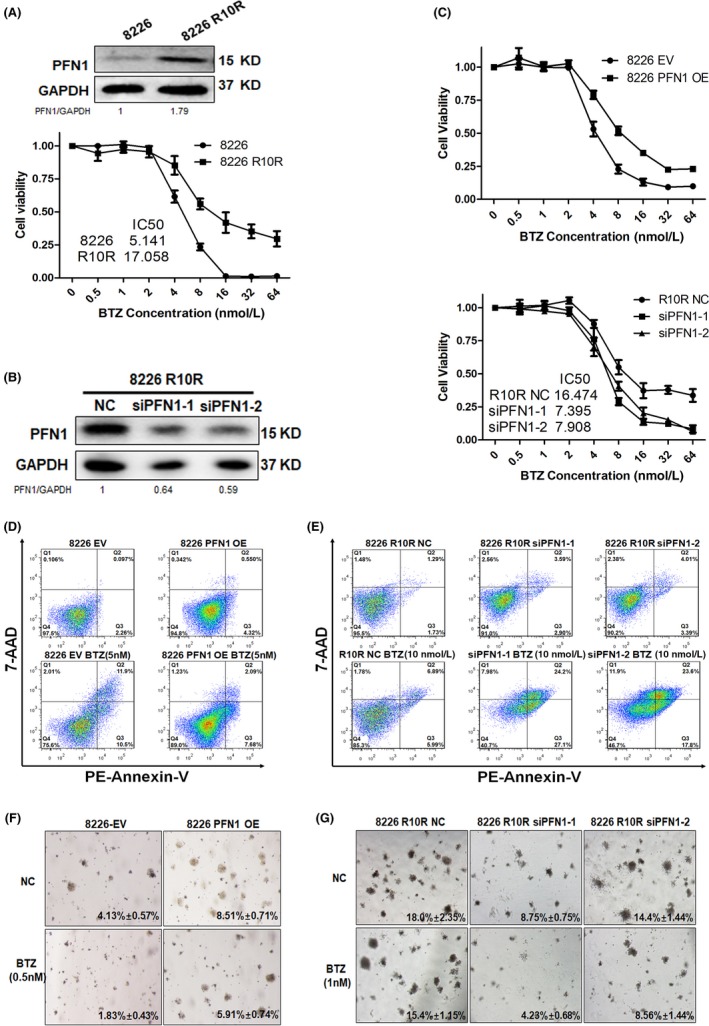
Profilin 1 (PFN)1 contributes to bortezomib (BTZ) resistance in multiple myeloma (MM) cells. A, Western blotting analysis of baseline PFN1 expression in wild‐type and drug‐resistant 8226 cells. CCK8 was used to detect drug resistance to BTZ in 8226 and 8226 R10R cells. B, 8226 R10R cells were transiently transfected with NC siRNA or PFN1 siRNA‐1/2, and the expression of PFN1 was detected by western blot. C, CCK8 was used to detect the drug resistance to BTZ in 8226 EV/PFN1 OE and 8226 R10R NC/siPFN1‐1/2 cells. IC 50 was increased in PFN1 OE cells and decreased in PFN1 KD cells. D, 8226 EV cells showed sensitivity to BTZ using a standard apoptotic assay, and the bottom and top right quadrants represent cells undergoing early and late apoptosis. 8226 cells with PFN1 overexpression showed only a few cells in the right quadrant with bortezomib treatment. E, Standard apoptotic assay was used to detect BTZ sensitivity of 8226 R10R cells with PFN1 knockdown, and siPFN1 groups showed more cells in the right quadrant with bortezomib treatment. F, MM cells were fed with medium with or without bortezomib in plates with bilayer agar cultures. Drug treatments significantly decreased colony efficiency values (shown in the figure) in the NC group, but these decreased much less in the PFN1‐overexpressing group. Representative images of colonies of 8226‐EV and 8226‐PFN1 OE are shown (4×). G, MM cells were fed with medium with or without bortezomib in plates with bilayer agar cultures. Drug treatments significantly decreased colony efficiency values (shown in the figure) in the PFN1 knockdown group, but these decreased much less in the control group. Representative images of colonies of 8226 R10R are shown (4×). EV, empty vector; OE, overexpression vector; NC, negative control; KD, knock down; PE, phycoerythrin.
3.4. Profilin 1 promotes autophagy in MM cells
We analyzed GEP data and found that PFN1 is significantly linked with Beclin1 (row data provided in Table S2), which hinted at the relationship between PFN1 and autophagy (Figure 4A). Then, we measured PFN1 and autophagy‐related genes Beclin1 and LC3B in 6 MM cell lines, and found the change of PFN1 is correlated with Beclin1 (Figure 4B). To determine the role of PFN1 in autophagy, we measured the Beclin1 and LC3B change by overexpression and knocked down PFN1 in 8226 and 8226 R10R cell lines. Results indicated overexpression of PFN1 could increase the expression of Beclin1 and LC3B, and knockdown of PFN1 could decrease the expression of Beclin1 and LC3B (Figure 4C). GFP‐LC3 Adenovirus was infected to 8226 EV/PFN1OE and 8226 R10R siPFN1 groups; we then found the formation of punctuated aggregations of GFP‐LC3 fluorescence in the cytoplasm was increased in the 8226 PFN1 OE group and decreased in 8226 R10R siPFN1 groups (Figure 4D). Transmission electron microscopy (TEM) showed more autophagosomes in the cytoplasm of the 8226 PFN1 OE cell line compared with the control group (Figure 4E). To confirm the autophagy flux, we blocked the autophagy using chloroquine (CQ), which could inhibit the fusion of autophagosome and lysosome. We then observed that LC3 in the 8226 PFN1 OE group increased significantly, indicating that PFN1 could promote autophagy in the early stage and the autophagy caused by PFN1 was blocked. These findings suggest that PFN1 is required for autophagy initiation.
Figure 4.
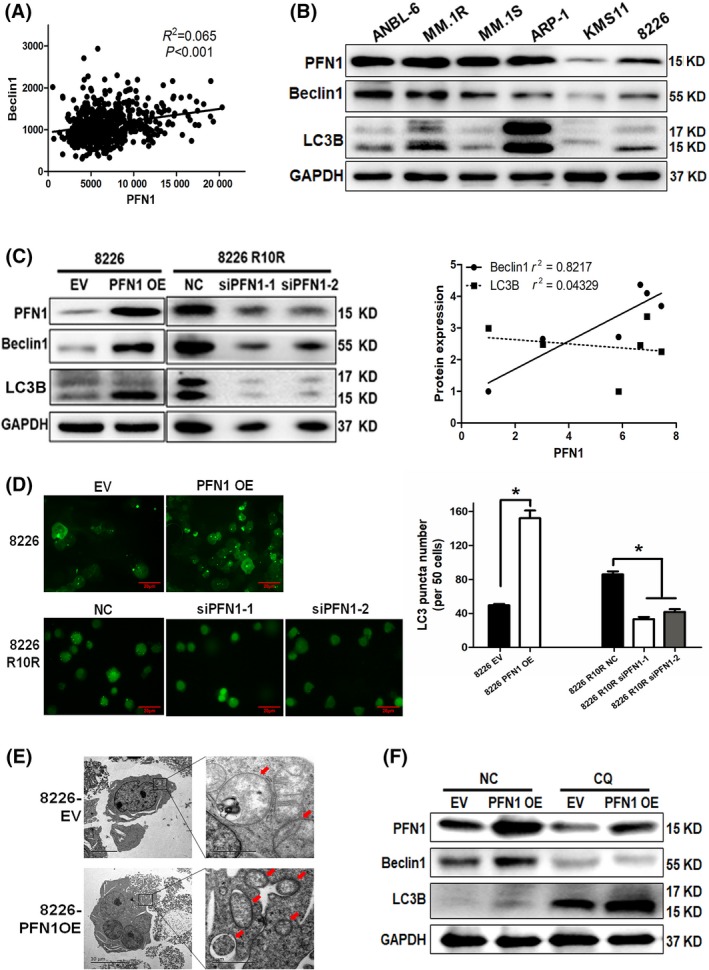
Profilin 1 (PFN)1 promoted autophagy. A, Correlation analysis of PFN1 and Beclin1 in multiple myeloma (MM) patients of gene expression profiling (GEP). B, Western blot to detect PFN1 expression and basic autophagy level in different MM cell lines. Gravity value was measured to analyze the correlation of PFN1, Beclin1 and LC3B II/I. C, Western blot to detect autophagy‐related change when PFN1 was overexpressed in 8226 and knockdown in 8226 R10R cell lines. D, LC3‐GFP was transfected in 8226 with PFN1 overexpression and 8226 R10R with PFN1 knockdown. LC3 puncta was examined and counted in 5 different fields. E, Morphological changes of 8226 PFN1 OE cells were detected by transmission electron microscopy. Number of autophagic vesicles is labeled by red arrows. F, 8226 EV/PFN1 OE cells were treated with chloroquine (CQ; 10 μmol/L), and autophagy‐related genes were detected by western blot. EV, empty vector; OE, overexpression vector; NC, negative control; CQ, chloroquine.
3.5. Profilin 1 enhances autophagy through interacting with the Beclin1 complex
Our further study found that PFN1 could bind Beclin1 in both 8226 EV and PFN1 OE cells. qPCR results suggested that PFN1 could not affect Beclin1 at the mRNA level (Figure 5A). Then we checked the protein level and found that there was an interaction between PFN1 and Beclin1 in MM (Figure 5B). Therefore, we silenced Beclin1 by siRNA to block autophagy in 8226 EV/PFN1 OE cells. Western blot showed the increase of LC3 caused by PFN1 OE was inhibited as Beclin1 was knocked down by siRNA, and PFN1 was also decreased (Figure 5C). Furthermore, we treated 8226 PFN1 OE cells with siBeclin1 and/or BTZ for 24 hours; apoptosis assay showed there were few apoptotic cells (about 10%) when treated with siBeclin1 or BTZ only, but the apoptotic cells increased greatly (about 70%) after combination of siBeclin1 and BTZ (Figure 5D). Clonogenic assay showed the same results; colony formation capacity was decreased when treated with siBeclin1 and BTZ combination, compared to treatment with single factor in 8226 EV/PFN1OE cells (Figure 5E). Furthermore, treatment with Beclin1 complex inhibitor 3‐MA showed a similar result in 8226 EV/PFN1OE cell lines (Figure S2C). These results demonstrated that PFN1 participated in the process of autophagy through interacting with Beclin1 complex, and silencing of Beclin1 could decrease the drug resistance caused by PFN1.
Figure 5.
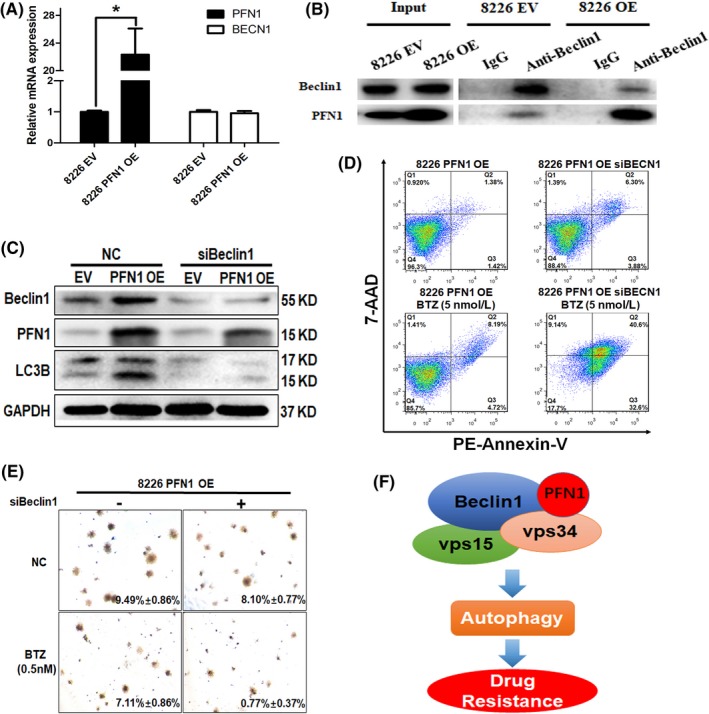
Blocking the interaction between profilin 1 (PFN1) and BECN1 complex could inhibit autophagy and reverse bortezomib (BTZ) resistance in multiple myeloma (MM). A, PFN1 and Beclin1 mRNA expression was detected by q‐PCR in 8226 EV/PFN1 OE cells. GAPDH was used as a control. B, Co‐immunoprecipitation (co‐IP) was adopted to investigate the interaction of PFN1 with BECN1. Co‐IP was carried out using an anti‐BECN1 antibody in lysate from cells transfected or not transfected with PFN1 and subjected for western blotting. The blot was then probed with an anti‐PFN1 and BECN1 antibody. C, 8226 PFN1 OE cells were transfected with siBeclin1 to knock down Beclin1. PFN1, autophagy, and apoptosis‐related proteins were detected by western blot. GAPDH was used as a loading control. D, 8226 PFN1 OE cells were transfected with siBeclin1 to block autophagy, then treated with or without bortezomib for 24 h. Apoptosis was then detected by flow cytometry. E, 8226 PFN1 OE cells were transfected with BECN1 siRNA, and then treated with or without bortezomib in plates with bilayer agar cultures for 2 wks to observe clone formation. F, Working model of our hypothesis. PFN1 binds Beclin1 complex to promote the process of autophagy and induce drug resistance. EV, empty vector; OE, overexpression vector; NC, negative control; PE, phycoerythrin.
4. DISCUSSION
Profilin 1 is involved in almost every aspect of cellular function, such as cell motility, endocytosis, membrane trafficking, mRNA regulation and transcription, playing a very important role in proliferation, cell survival and migration in physiological and pathological processes. The 3 binding domains have their own independent functions, but they can also affect each other with synergistic or antagonistic effects.12, 13, 14 PFN1 knockout mice showed embryonic lethality at the 2‐cell stage which demonstrated that PFN1 is indispensable in embryonic proliferation and cell survival.15 Attenuated expression of PFN1 confers protection from atherosclerotic plaque formation16 and, in endothelial cells, knockdown of PFN1 can also inhibit proliferation, and migration.17 However, involvement of PFN1 can induce vascular smooth muscle cell proliferation.18 Together, this suggests that PFN1 may play a critical part in the growth of vascular cells.
In recent years, many studies have discovered that PFN1 has effects on the progression of cancer. However, the underlying mechanism is still not clear. Some studies consider PFN1 to be an oncogene; phosphorylation of PFN1 can inhibit degradation of hypoxia‐inducible factor‐1‐alpha (HIF‐1α), which can promote tumor progression in glioblastoma.19 In renal cell carcinoma (RCC), Karamchandani et al reported that PFN1 overexpression correlated with both lower disease‐free survival and lower overall survival rates.20 Similarly, high levels of PFN1 are implicated in aggressive bladder cancer, whereas knockdown of PFN1 could reduce cell motility.21 Meanwhile, other researchers see it as a tumor suppressor gene, and found that PFN1 was down‐regulated in a few different types of cancer (breast, liver, pancreas, bladder).22, 24, 25 and that low expression of PFN1 can promote metastasis of breast cancer.25 In our present work, expression of PFN1 was high in partial cells of MM patients, and increased with the progression of MM in GEP data. PFN1 expression was significantly increased in the subgroup of PR and MF, which was related to MM proliferation and prognosis. These results suggest that PFN1 may be an oncogene in MM, and related to the progression of myeloma. Overexpression of PFN1 in MM cell lines can obviously increase cell viability; the S and G2/M phases are also increased in PFN1 overexpression cell lines, which indicates that PFN1 is correlated with cell proliferation in MM cells. In some types of normal cells, as in vascular smooth muscle cells, it was proved that overexpression of PFN1 could improve cell proliferation. However, the function of PFN1 in cell proliferation in tumors has not yet been studied. We found that p‐p38 MAPK and p‐JNK, which are important genes related to cell proliferation and to the cell cycle, were increased as PFN1 was overexpressed in 8226 and 8226 R10R cell lines, but how PFN1 regulates and affects p38 MAPK and p‐JNK is still unknown. Increase of the G2/M phase was previously observed in Hela cells, but the rise in the G2/M population in wild‐type PFN1‐expressing cells was thought to result from an imbalance between high PFN1 expression and actin concentration.26 Now, we also found a similar result in MM, and we infer that the change of cell cycle may also be related to the MAPK pathway. As a result of the process of degrading and recycling organelles and proteins, autophagy caused by PFN1 may also have an impact on the cell cycle.
Autophagy is a highly conserved system that mediates the sequestration and delivery of cytoplasmic material to the lysosome for degradation. As autophagy goes from the phagophore to the autolysosome, vesicle formation, transportation and fusion occur throughout the entire process. Like phagocytosis, autophagy needs the participation of different kinds of cytoskeleton‐related proteins in the formation, transportation, and fusion of vesicles. PFN1, a cytoskeleton‐related protein in our study, showed that it can bind to lipid products of PI3‐kinase,27 and lower eukaryotes have provided ample evidence of a role for profilins in endocytosis and membrane trafficking.28, 29 In mammalian cells, it has been observed that PFN1 attaches to the Golgi apparatus and is required for the formation of constitutive transport vesicles. This suggests that PFN1 may have a relationship with the formation of intracellular and extracellular vesicles, like endosomes, phagosomes, and exosomes.30 Together, this suggests that PFN1 plays an important role in phagocytosis. Our results showed that PFN1 promotes autophagy as we hypothesized. We also found that change in PFN1 is related to change in Beclin1, which is a key gene forming a complex with vps15 and vps34 in the membrane and promotes the formation of autophagosomes in the initiation of autophagy. Results of the co‐IP assay in our work suggest that PFN1 may have an interaction with Beclin1, but the interaction is a little weak. Hence, we speculate that PFN1 participates in the formation of a Beclin1 complex, but does not directly interact with Beclin1 as there is no PLP domain on the protein of Beclin1. At the start of autophagy, a multiprotein complex with class III PI3K activity was recruited, which contains Beclin1, vps34 and vps17.31 The protein complex produces phosphatidylinositol 3‐phosphate (PIP3) to further support the expansion of autophagosomal membranes until closure.32 In our study, increasing expression of PFN1 can enhance the process of autophagy whereas the mutation of PFN1 (R88L, which is deficient in binding PIP2) cannot (data not shown). Thus, we inferred that PFN1 may have an effect on the transformation from PIP2 to PIP3 of vps34, which is an important component of the Beclin1 complex. Furthermore, we found that PFN1 was degraded by autophagy at a later stage, not through the ubiquitin‐proteasome pathway, as bortezomib could not inhibit the decrease of PFN1 caused by autophagy (data not shown).
Bortezomib is a very effective drug in the clinical therapy of multiple myeloma. However, in recent years, the number of patients resistant to bortezomib is increasing. The mechanisms of drug resistance are complicated and autophagy is one of the causes.33 Thus, targeting autophagy to overcome the drug resistance is an available strategy in MM therapy. Much research has shown remarkable results using autophagy inhibitors combined with other drugs.34, 36, 37
In the present study, PFN1 increased with the progression of MM, and overexpression of PFN1 could resist the apoptosis that resulted from bortezomib, whereas knockdown of Beclin1 by siRNA or 3‐MA could reduce drug resistance caused by PFN1 through inhibiting the formation of autophagosomes in the initiation of autophagy. The autophagy in MM maintains an adaptive level to sustain its survival, so inhibiting it in the early stage would lead to cell apoptosis, but, in some cases, excessive autophagy which exceeds the endurance capacity would also lead to cell death.37, 38 Excessive degradation of PFN1 by autophagy could inhibit cell mobility and proliferation, which also takes part in the process of autophagic cell death.
In conclusion, our results indicate that PFN1 is not simply a cytoskeleton protein that regulates cell mobility, but has many other functions in physiological and pathological processes. This research provides evidence that PFN1 participates in cell proliferation, and promotes autophagy through interaction with Beclin1 complex. In addition, we partially illustrate the mechanism of PFN1 in bortezomib resistance, supporting the therapy of autophagy inhibitors to drug resistance in MM patients, in which PFN1 may be a target point in the treatment of MM.
CONFLICTS OF INTEREST
Authors declare no conflicts of interest for this article.
Supporting information
ACKNOWLEDGMENT
This work was supported by the grants from the National Natural Science Foundation of China (NSFC, No. 81670143).
Lu Y, Wang Y, Xu H, Shi C, Jin F, Li W. Profilin 1 induces drug resistance through Beclin1 complex‐mediated autophagy in multiple myeloma. Cancer Sci. 2018;109:2706–2716. 10.1111/cas.13711
Funding information
The National Natural Science Foundation of China, (Grant / Award Number: ‘No. 81670143’)
Contributor Information
Fengyan Jin, Email: Fengyanjin@jlu.edu.cn.
Wei Li, Email: 568813101@qq.com.
REFERENCES
- 1. Kumar SK, Rajkumar V, Kyle RA, et al. Multiple myeloma. Nat Rev Dis Primers. 2017;3:17046. [DOI] [PubMed] [Google Scholar]
- 2. Moreau P, Richardson PG, Cavo M, et al. Proteasome inhibitors in multiple myeloma: 10 years later. Blood. 2012;120:947‐959. [DOI] [PMC free article] [PubMed] [Google Scholar]
- 3. Niewerth D, Jansen G, Assaraf YG, Zweegman S, Kaspers GJ, Cloos J. Molecular basis of resistance to proteasome inhibitors in hematological malignancies. Drug Resist Updat. 2015;18:18‐35. [DOI] [PubMed] [Google Scholar]
- 4. White E, Mehnert JM, Chan CS. Autophagy, metabolism, and cancer. Clin Cancer Res. 2015;21(22):5037‐5046. [DOI] [PMC free article] [PubMed] [Google Scholar]
- 5. Ying‐Jie L, Lei Y‐H, Yao N, et al. Autophagy and multidrug resistance in cancer. Chin J Cancer. 2017;36(1):52. [DOI] [PMC free article] [PubMed] [Google Scholar]
- 6. Oliva L, Cenci S. Autophagy in plasma cell pathophysiology. Front Immunol. 2014;5:103. [DOI] [PMC free article] [PubMed] [Google Scholar]
- 7. Milan E, Fabbri M, Cenci S. Autophagy in plasma cell ontogeny and malignancy. J Clin Immunol. 2016;36:18‐24. [DOI] [PMC free article] [PubMed] [Google Scholar]
- 8. Alkam D, Feldman EZ, Singh A, Kiaei M. Profilin1 biology and its mutation, actin(g) in disease. Cell Mol Life Sci. 2017;74(6):967‐981. [DOI] [PMC free article] [PubMed] [Google Scholar]
- 9. Böttcher RT, Wiesner S, Braun A, et al. Profilin 1 is required for abscission during late cytokinesis of chondrocytes. EMBO J. 2009;28(8):1157‐1169. [DOI] [PMC free article] [PubMed] [Google Scholar]
- 10. Lassing I, Lindberg U. Specific interaction between phosphatidylinositol 4,5‐bisphosphate and profilactin. Nature. 1985;314:472‐474. [DOI] [PubMed] [Google Scholar]
- 11. Zhan F, Huang Y, Colla S, et al. The molecular classification of multiple myeloma. Blood. 2006;108(6):2020‐2028. [DOI] [PMC free article] [PubMed] [Google Scholar]
- 12. Witke W. The role of profilin complexes in cell motility and other cellular processes. Trends Cell Biol. 2004;14:461‐469. [DOI] [PubMed] [Google Scholar]
- 13. Jockusch BM, Murk K, Rothkegel M. The profile of profilins. Rev Physiol Biochem Pharmacol. 2007;159:131‐149. [DOI] [PubMed] [Google Scholar]
- 14. Karlsson R, Lindberg U. Profilin, an essential control element for actin polymerization In: Lapplainen P, ed. Actin Monomer Binding Proteins. Austin, TX, USA: Landes Biosciences and Springer; 2007: 29‐44. [Google Scholar]
- 15. Witke W, Sutherland JD, Sharpe A, Arai M, Kwiatkowski DJ. Profilin I is essential for cell survival and cell division in early mouse development. Proc Natl Acad Sci USA. 2001;98:3832‐3836. [DOI] [PMC free article] [PubMed] [Google Scholar]
- 16. Romeo Giulio R, Moulton Karen S, Kazlauskas A, et al. Attenuated expression of profilin‐1 confers protection from atherosclerosis in the LDL receptor–null mouse. Circ Res. 2007;101(4):357‐367. [DOI] [PubMed] [Google Scholar]
- 17. Ding Z, Lambrechts A, Parepally M, Roy P. Silencing profilin‐1 inhibits endothelial cell proliferation, migration and cord morphogenesis. J Cell Sci. 2006;119:4127‐4137. [DOI] [PubMed] [Google Scholar]
- 18. Cheng JF, Ni GH, Chen MF, et al. Involvement of profilin‐1 in angiotensin II‐induced vascular smooth muscle cell proliferation. Vascul Pharmacol. 2011;55(1–3):34‐41. [DOI] [PubMed] [Google Scholar]
- 19. Fan Y, Potdar AA, Gong Y, et al. Profilin‐1 phosphorylation directs angiocrine expression and glioblastoma progression through HIF‐1alpha accumulation. Nat Cell Biol. 2014;16(5):445‐456. [DOI] [PMC free article] [PubMed] [Google Scholar]
- 20. Karamchandani JR, Gabril MY, Ibrahim R, et al. Profilin‐1 expression is associated with high grade and stage and decreased disease‐free survival in renal cell carcinoma. Hum Pathol. 2015;46(5):673‐680. [DOI] [PubMed] [Google Scholar]
- 21. Zoidakis J, Makridakis M, Zerefos PG, et al. Profilin 1 is a potential biomarker for bladder cancer aggressiveness. Mol Cell Proteomics. 2012;11(4):M111.009449. [DOI] [PMC free article] [PubMed] [Google Scholar]
- 22. Gronborg M, Kristiansen TZ, Iwahori A, et al. Biomarker discovery from pancreatic cancer secretome using a differential proteomic approach. Mol Cell Proteomics. 2006;5:157‐171. [DOI] [PubMed] [Google Scholar]
- 23. Wu N, Zhang W, Yang Y, et al. Profilin 1 obtained by proteomic analysis in all‐trans retinoic acid‐treated hepatocarcinoma cell lines is involved in inhibition of cell proliferation and migration. Proteomics. 2006;6:6095‐6106. [DOI] [PubMed] [Google Scholar]
- 24. Zoidakis J, Makridakis M, Zerefos PG, et al. Profilin 1 is a potential biomarker for bladder cancer aggressiveness. Mol Cell Proteomics. 2012;11:M111.009449. [DOI] [PMC free article] [PubMed] [Google Scholar]
- 25. Ding Z, Joy M, Bhargava R, et al. Profilin‐1 downregulation has contrasting effects on early vs late steps of breast cancer metastasis. Oncogene. 2014;33(16):2065‐2074. [DOI] [PMC free article] [PubMed] [Google Scholar]
- 26. Suetsugu S, Miki H, Takenawa T. Distinct roles of profilin in cell morphological changes: microspikes, membrane ruffes, stress fibers, and cytokinesis. FEBS Lett. 1999;457(3):470‐474. [DOI] [PubMed] [Google Scholar]
- 27. Lu PJ, Shieh WR, Rhee SG, Yin HL, Chen CS. Lipid products of phosphoinositide 3‐kinase bind human profilin with high affinity. Biochemistry. 1996;35:14027‐14034. [DOI] [PubMed] [Google Scholar]
- 28. Wolven AK, Belmont LD, Mahoney NM, Almo SC, Drubin DG. In vivo importance of actin nucleotide exchange catalyzed by profilin. J Cell Biol. 2000;150(4):895‐904. [DOI] [PMC free article] [PubMed] [Google Scholar]
- 29. Pearson AM, Baksa K, Rämet M, et al. Identification of cytoskeletal regulatory proteins required for efficient phagocytosis in Drosophila. Microbes Infect. 2003;5(10):815‐824. [DOI] [PubMed] [Google Scholar]
- 30. Dong J, Radau B, Otto A, Muller E‐C, Lindschau C, Westermann P. Profilin I attached to the Golgi is required for the formation of constitutive transport vesicles at the trans‐Golgi network. Biochim Biophys Acta. 2000;1497(2):253‐260. [DOI] [PubMed] [Google Scholar]
- 31. Kihara A, Kabeya Y, Ohsumi Y, Yoshimori T. Beclin‐phosphatidylinositol 3‐kinase complex functions at the trans‐Golgi network. EMBO Rep. 2001;2(4):330‐335. [DOI] [PMC free article] [PubMed] [Google Scholar]
- 32. Proikas‐Cezanne T, Takacs Z, Donnes P, Kohlbacher O. WIPI proteins: essential PtdIns3P effectors at the nascent autophagosome. J Cell Sci. 2015;128(2):207‐217. [DOI] [PubMed] [Google Scholar]
- 33. Hamouda MA, Belhacene N, Puissant A, et al. The small heat shock protein b8 (hspb8) confers resistance to bortezomib by promoting autophagic removal of misfolded proteins in multiple myeloma cells. Oncotarget. 2014;5(15):6252‐6266. [DOI] [PMC free article] [PubMed] [Google Scholar]
- 34. Zeng R, Chen Y, Zhao S, Cui GH. Autophagy counteracts apoptosis in human multiple myeloma cells exposed to oridonin in vitro via regulating intracellular ros and sirt1. Acta Pharmacol. 2012;33(1):91‐100. [DOI] [PMC free article] [PubMed] [Google Scholar]
- 35. Hoang B, Benavides A, Shi Y, Frost P, Lichtenstein A. Lichtenstein, EFFECT of autophagy on multiple myeloma cell viability. Mol Cancer Ther. 2009;8(7):1974‐1984. [DOI] [PubMed] [Google Scholar]
- 36. Kawaguchi T, Miyazawa K, Moriya S, et al. Combined treatment with bortezomib plus bafilomycin A1 enhances the cytocidal effect and induces endoplasmic reticulum stress in U266 myeloma cells: crosstalk among proteasome, autophagy‐lysosome and ER stress. Int J Oncol. 2011;38(3):643‐654. [DOI] [PubMed] [Google Scholar]
- 37. Lamy L, Ngo VN, Emre NC, et al. Control of autophagic cell death by caspase‐10 in multiple myeloma. Cancer Cell. 2013;23(4):435‐449. [DOI] [PMC free article] [PubMed] [Google Scholar]
- 38. Rosebeck S, Alonge MM, Kandarpa M, et al. Synergistic myeloma cell death via novel intracellular activation of caspase‐10–dependent apoptosis by carfilzomib and selinexor. Mol Cancer Ther. 2016;15(1):60‐71. [DOI] [PubMed] [Google Scholar]
Associated Data
This section collects any data citations, data availability statements, or supplementary materials included in this article.
Supplementary Materials