Abstract
Gliomas are the most common malignant tumors of the brain. Immune checkpoints have been increasingly emphasized as targets for treating malignant tumors. B7‐H3 has been identified as an immune checkpoint that shows potential value for targeting therapies. We set out to characterize the expression pattern and biological function of B7‐H3 in brain gliomas using high‐throughput data obtained from the Chinese Glioma Genome Atlas (CGGA) and the Cancer Genome Atlas (TCGA) projects. B7‐H3 was upregulated more in higher‐grade gliomas than that in lower‐grade gliomas in both CGGA and TCGA datasets. Isocitrate dehydrogenase (IDH) mutation seemed to exert significant influence on B7‐H3 expression in gliomas but led to quite different results between grade II gliomas and higher‐grade gliomas. In addition to IDH, methylation of B7‐H3 promoter and microRNA‐29 family also showed a potential regulatory effect on B7‐H3 expression. Gene ontology analysis revealed that B7‐H3 was associated with mitotic cell cycle, cell proliferation and immune response. Further investigation suggested that B7‐H3 was mostly involved in the Toll‐like receptor signaling pathway. Survival analysis indicated that B7‐H3 was an independent unfavorable prognosticator for glioma patients in both CGGA and TCGA datasets. B7‐H3 expression is regulated by multiple mechanisms and is potentially involved in the T‐cell receptor signaling pathway. Higher B7‐H3 expression indicates a worse prognosis for glioma patients, which warrants further research into the development of inhibitors for targeting this immune checkpoint, but we still need to be cautious about immune checkpoint inhibition for central nervous system tumors.
Keywords: B7‐H3, checkpoint inhibitors, glioma, immune response, outcome
1. INTRODUCTION
Gliomas are the most common malignant tumors of the brain. Even when surgically removed and patients are treated with radical combined radio‐chemo‐therapies, these notoriously infiltrative tumors invariably recur and outcomes for patients are dismal.1, 2 Accumulating evidence indicates that key components of immune response are significantly altered in gliomas, which subsequently leads to the evasion of immune surveillance of tumor cells.3, 4, 5 Immune checkpoints are thought to play a critical role in tumor immune escape.6, 7 The dysregulation of immune checkpoints has attracted the attention of numerous scientific researchers and drug companies who have sought to develop inhibitors against these immune checkpoints in the tumor environment. PD‐1 and PD‐L1 are the most popular immune checkpoints that have been investigated and inhibitors against them have been subject to late‐stage clinical testing or approved for clinical treatment for some other malignant tumors, such as lung cancer, melanoma and breast cancer.8, 9, 10
B7‐H3, also known as CD276, is an immune checkpoint, which belongs to the immunoglobulin superfamily, and is thought to participate in the regulation of T cell‐mediated immune response. Studies been carried out on B7‐H3 in many other cancers, including ovarian cancer,11 colon cancer,12 prostate cancer13 and hepatocellular carcinomas14. It is reported that B7‐H3 is universally expressed at a relatively higher level in more malignant tumor entities than in less malignant or benign tumors. These studies suggested that B7‐H3 expression was associated with the extent of tumor malignancy, rationalizing the development of inhibitors against B7‐H3.
Enoblituzumab, also referred to as MGA271, is a humanized IgG1κ monoclonal antibody recognizing B7‐H3, which is reported to exhibit potent antitumor activity in B7‐H3‐expressing xenograft models of renal cell and bladder carcinomas.15 Enoblituzumab is also used being used in clinical trials to treat refractory cancers, and has the potential to impact significantly on the clinical management of those diseases.
To the best of our knowledge, the molecular and clinical pattern of B7‐H3 expression has not been fully characterized in gliomas of all grades. In this study, we set out to comprehensively delineate the molecular pattern and clinical relevance of B7‐H3 in gliomas, using RNA‐Seq data from the Chinese Glioma Genome Atlas (CGGA) dataset. RNA‐Seq data for glioma samples from the TCGA dataset were used as a validation cohort. This is the first comprehensive study characterizing the molecular and clinical pattern of B7‐H3 expression in whole grade gliomas.
2. MATERIALS AND METHODS
2.1. Sample and data collection
From the CGGA dataset, we collected RNA‐Seq data (RPKM value) for 325 samples, ranging from WHO grade II to grade IV.16 In the TCGA dataset, RNA‐Seq data (level 3, RSEM normalized data) were available for 669 samples. Upon analyzing the RNA‐Seq data, the RPKM value of the CGGA dataset and the RSEM value of the TCGA dataset were all log2 transformed. Written informed consent was obtained from patients for the CGGA project. This study was approved by the Ethics Committee of Beijing Tiantan Hospital, Capital Medical University, Beijing, China.
2.2. Detection of isocitrate dehydrogenase mutation
Isocitrate dehydrogenase (IDH) gene mutations are increasingly being recognized as the earliest mutation event in the development of diffuse gliomas and have been included in the most recent updated WHO classification of brain tumors.17 IDH1/2 mutations are the most common genotype in gliomas, especially in lower‐grade gliomas and secondary glioblastomas, which develop from lower‐grade lesions. In the CGGA cohort, IDH1/2 mutations were detected by pyrosequencing as described in our previous study.18 For the TCGA cohort, IDH mutation data were obtained from whole exon sequencing data or pyrosequencing.
2.3. Definition of immune pathways
Immune pathways were defined with specific or groups of related gene ontology terms. Regulation of the T‐cell receptor signaling pathway was defined with the term GO:0050856. Negative regulation of the T‐cell receptor signaling pathway was defined with the term GO:0050860. Positive regulation of the T‐cell receptor signaling pathway was defined with the term GO:0050862. B‐cell activation involved in immune response was defined with the terms GO:0002312, GO:0002314 GO:0002315, GO:0002316, GO:0002317, GO:0002322, GO:0048295, GO:0048297, GO:0048298, GO:0048302, GO:0048304, GO:1900100 and GO:2000572. Activation of innate immune response was defined with the terms GO:0045087 and GO:0002218. Toll‐like receptor signaling pathway was defined with term GO:0002224. Natural killer (NK) cell‐related immune response was defined with the term GO:0002860. Interferon‐related response was defined with the terms GO:0034340, GO:0034341, GO:0034342, GO:0042267, GO:0042269, GO:0060330, GO:0060332, GO:0060333, GO:0060337, GO:0060338, GO:0060340 and GO:0071346.
2.4. Statistical analysis
R language was used for performing statistical analysis and graphical work.19 The HTSAnalyzeR package was used to perform gene ontology and pathway analysis.20 Kaplan‐Meier plots were generated with the survival package,21 and the log‐rank test was used to compare survival curves. The gene sets enrichment analysis (GSVA) package was used to calculate the enrichment status in certain immune response pathways.22 Multiple covariates Cox proportional hazard analysis was performed using the coxph function embedded in the survival package with the Efron approximation method for tie handling, taking gender, age, grade, IDH, B7‐H3 expression, radiotherapy and/or chemotherapy into account. Figures were generated with various R packages, such as ggplot2,23 pheatmap, circlize 24 and corrgram. Student's t test was used to obtain the statistical significance between binary groups. A P‐value <.05 is considered statistically significant. All statistical tests were 2‐sided.
3. RESULTS
3.1. B7‐H3 expression pattern in WHO grades and molecular subtypes
First, we investigated the expression pattern of B7‐H3 across grades and subtypes defined by expression clusters by the TCGA workgroup.25 As expected, higher B7‐H3 expression was correlated with higher grade, which indicated a malignant biological property in both CGGA and TCGA cohorts (Student's t test, Figure 1A& B). To validate what we found, another 2 independent cohorts, CGGA microarray dataset and GSE16011 dataset, were also enrolled in this study and similar results were yielded (Figure S1A&B). Moreover, compared to normal brain tissues, tumor samples demonstrated significantly upregulated B7‐H3 expression (Student's t test), suggesting the adverse role of this checkpoint in glioma development and progression. In subtypes, B7‐H3 was upregulated in classical and mesenchymal subtypes, especially in mesenchymal subtypes in both CGGA and TCGA subtypes (Student's t test, Figure 1C&D). This particular pattern of expression has been reported in our previous study,7 in which we established the relationship between B7‐H3 and PD‐L1 expressions. The synergistic expression pattern of checkpoints further demonstrated the serious dysregulation of immune response in B7‐H3/PD‐L1 high‐expression tumors. In addition, we used the receiver operating characteristic (ROC) curve for B7‐H3 for predicting mesenchymal subtype and found that B7‐H3 could serve as a potential marker for mesenchymal subtype with area under the curve (AUC) of 80.8% and 88.0% in CGGA and TCGA cohorts, respectively (Figure S2A&B).
Figure 1.
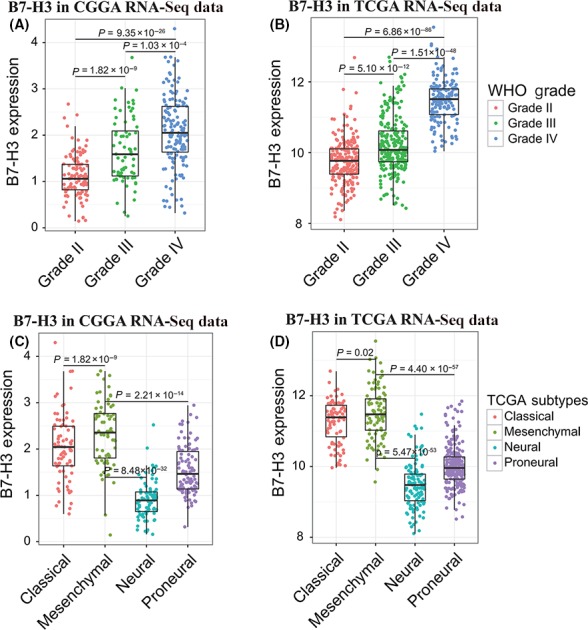
B7‐H3 expression pattern in Chinese Glioma Genome Atlas (CGGA) and the Cancer Genome Atlas (TCGA) dataset according to WHO grade (A,B) and expression subtypes (C,D). In the CGGA dataset, the log2 transformed RPKM value was used while in the TCGA dataset, the log2 transformed RSEM value was used as expression values, and it is the same case in the following figures. Student's t test was used to obtain the statistical difference between binary groups
3.2. B7‐H3 expression is significantly associated with IDH isocitrate dehydrogenase mutation in high‐grade gliomas
Isocitrate dehydrogenase mutation has been widely acknowledged as the earliest genetic alteration in glioma development. To investigate the influence that IDH may exert on B7‐H3 expression, we analyzed the expression pattern of B7‐H3 in IDH‐mutant type and wild‐type gliomas. In the CGGA dataset, when taking grade into account, significant difference was observed only in grade IV gliomas (Student's t test), while in grade III gliomas (anaplastic gliomas), B7‐H3 also showed a trend of higher expression in IDH wild‐type tumors. In the TCGA dataset, B7‐H3 was profoundly upregulated in both grade III and IV gliomas (Student's t test), which verified what we revealed in grade III and IV gliomas of the CGGA dataset (Figures 2A&B, S3). To our surprise, a different expression pattern was observed in grade II gliomas in both CGGA and TCGA datasets, which precluded the probability of coincidence (Figures 2A&B, S3).
Figure 2.
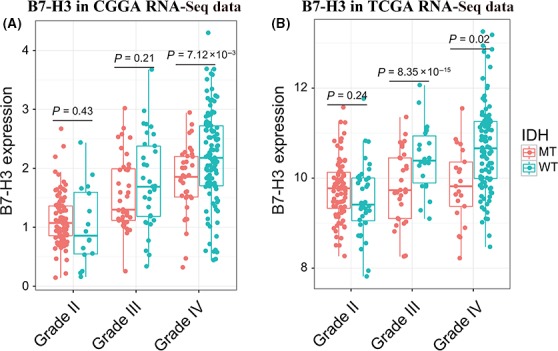
Relationship between B7‐H3 expression and IDH mutation in Chinese Glioma Genome Atlas (A) and the cancer genome atlas (B) dataset. The orange dots indicate IDH‐mutant samples, and cyan dots indicate IDH wild‐type samples, respectively
3.3. B7‐H3 is possibly regulated by methylation and microRNA‐29 family at different stages, respectively
To elucidate the puzzle outlined in the above paragraph, we obtained methylation data and microRNA sequencing data for the TCGA lower‐grade gliomas (LGG) samples. Among the 15 methylation probes designed for B7‐H3 from Infinium HumanMethylation450 BeadChip, cg10586317 methylation exhibited the most powerful negative association with expression of B7‐H3 (Pearson test, R = −.6335, P‐value < 2.2 × 10⁻¹⁶). As the IDH mutation exerted great influence on the methylation of the whole genome, we analyzed the relationship between B7‐H3 and cg10586317 methylation status separately for IDH‐wild and IDH‐mutant gliomas. As Figure 3A shows, in IDH‐wild gliomas, methylation of cg10586317 was much lower than that of IDH‐mutant tumors, as expected (Student's t test, P = 4.067 × 10−127). However, in IDH‐wild gliomas, methylation of cg10586317 seemed to show stronger inverse correlation with B7‐H3 than that of IDH‐mutant gliomas (Pearson test, R = −.5935 and −.3130, respectively, Figure 3A). The microRNA‐29 family was also reported to inversely regulate B7‐H3 expression.26, 27 We further examined the correlation between expression of B7‐H3 and the microRNA‐29 family. As shown in Figure 3B&C, the microRNA‐29 family seemed to display a stronger effect on B7‐H3 expression than that in glioblastoma (Pearson tests, Figure 3B&C). These results suggested that methylation at cg10586317 loci was the potential regulatory element at higher B7‐H3 expression levels in GBM, while microRNA‐29 family members are the potential regulators for B7‐H3 in low‐grade gliomas.
Figure 3.
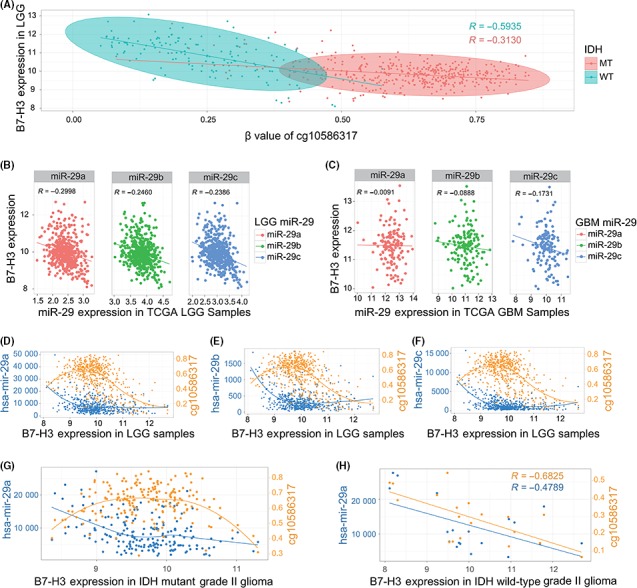
Regulation of B7‐H3 by methylation and microRNA‐29 family. A, Relationship between B7‐H3 and methylation status at promoter region (cg10586317 loci) in the cancer genome atlas (TCGA) LGG samples. The orange dots indicate IDH‐mutant samples, and cyan dots indicate IDH wild‐type samples, respectively. The orange line and cyan line indicate linear regression between B7‐H3 expression and cg10586317 methylation in IDH‐mutant samples and IDH wild‐type samples, respectively. B, Relationship between microRNA‐29 family and B7‐H3 expression in TCGA LGG. MiR‐29 expression values were obtained from TCGA microRNA‐Seq and were log10 transformed to get better correlation pattern. C, Relationship between microRNA‐29 family and B7‐H3 expression in TCGA GBMs. MiR‐29 expression values were obtained from TCGA microRNA microarray data. D‐F, Integrated pattern of B7‐H3 expression and epigenetic factors (microRNA‐29 family and methylation at cg10586317 loci) in TCGA LGG. MiR‐29 values were obtained from TCGA microRNA sequencing which has been normalized while releasing. (G, H) Comparing pattern of B7‐H3 expression and epigenetic factors (microRNA‐29 family and methylation at cg10586317 loci) between IDH mutant group and IDH wild‐type group in grade II gliomas
To further clarify the regulatory relationship of microRNA‐29 and methylation of cg10586317, we integrated 2 factors in Figure 3D, E and F. As the figures show, methylation of cg10586317 exhibited a 2‐sided correlation on B7‐H3 expression. At a lower level of B7‐H3 expression, methylation of cg10586317 showed a positive relationship with B7‐H3 expression, while the microRNA‐29 family showed a negative regulatory effect, in concordance with what we reveal in Figure 3A‐B. In samples with higher B7‐H3 expression, the microRNA‐29 family seemed to express at a very low level and showed a limited relationship with B7‐H3 expression, in line with what we demonstrate in Figure 3C. These results provided a clue for the puzzle in Figure 2. In IDH‐mutant grade II gliomas, methylation on cg10586317 seemed to exert 2 side effects on B7‐H3 expression and microRNA‐29a showed a potentially negative regulatory effect (Figure 3G), while in IDH‐wild grade II gliomas, B7‐H3 expression seemed to be downregulated by both methylation on cg10586317 and microRNA‐29a (Figure 3H), rationalizing the paradox in grade II gliomas with wild‐type IDH.
3.4. B7‐H3 was associated with malignant biological process
As a checkpoint, high expression of B7‐H3 was expected to confer additional malignancy to tumor cells. To explore the associated biological function, we performed GSEA network analysis using the HTSAnalyzeR package of R language. The 25 most associated biological processes and KEGG pathways were generated (Figure 4A‐D). For the CGGA dataset, DNA‐templated transcription, mitotic cell cycle and pathways in cancer were the most enriched biological functions. For the TCGA dataset, DNA‐templated transcription and metabolic pathway were the most enriched biological functions.
Figure 4.
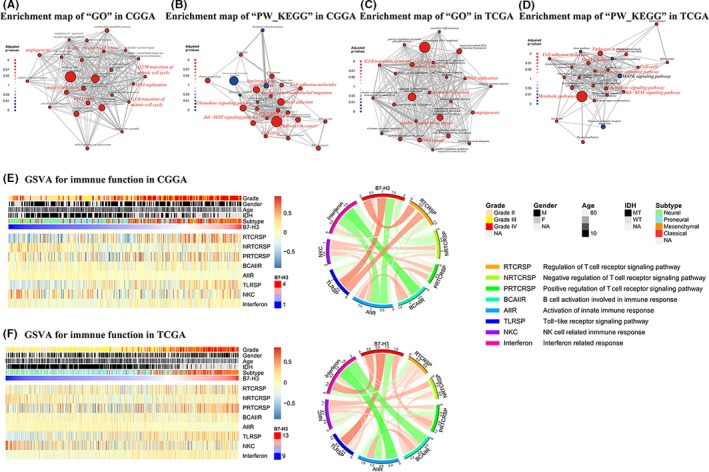
Top 25 B7‐H3 most related biological processes and KEGG pathways in whole grade glioma in Chinese glioma genome atlas (CGGA) (A,B) and the cancer genome atlas (TCGA) dataset (C,D). In the enrichment map for GSEA, nodes are colored by the sign of the enrichment scores (red: +, blue: −). The sizes of nodes are in proportion to the sizes of gene sets, while the width of edges is proportionate to Jaccard coefficients. B7‐H3 related immune function in glioma. GSVA for immune function and relationship between B7‐H3 expression and specific immune pathways in CGGA dataset and (E) and TCGA dataset (F)
Comparison of biological functions in CGGA and TCGA datasets revealed that B7‐H3 was highly correlated with mitotic cell cycle (Figure S5A&E), cell proliferation (Figure S5B&F), angiogenesis (Figure S5C&G), and upregulated immune response (Figure S5D&H). The situation was similar when we took glioblastomas as an isolated entity (Figures S4 & S5I‐N). These results implied that B7‐H3 was associated with higher malignancy and might be involved in the development and/or progression of gliomas.
3.5. B7‐H3 is positively associated with the Toll‐like receptor signaling pathway
Dysregulated inflammatory response is a key characteristic of malignancies. Usually immune response is very complex, and many immune cells and molecules are involved in the process of antitumor effects and help tumor cells escape the immune system. In this study, B7‐H3‐related immune function was explored. Several classical gene ontology terms were obtained from ENSEMBL. Enrichment scores for each term were calculated using Gene Set Variation Analysis (GSVA). A heatmap for enrichment scores was depicted along with clinical and molecular factors, such as grade, gender, age, IDH mutation and B7‐H3 expression (Figure 4E&F). To obtain a better view of the relationship between B7‐H3 and certain immune biological terms, a circos plot was generated with the circlize package. The term most related to B7‐H3 was Toll‐like receptor signaling pathway and the term that was least related was activation of innate immune response. We also noticed that B7‐H3 expression was negatively associated with NK cell‐related immune response, consistent with the results reported by Lee et al. (2012).28
3.6. B7‐H3 predicts significantly worse survival for glioma patients
As B7‐H3 was revealed to be associated with increased malignancy and mitigated innate immune response, we calculated the prognostic value of B7‐H3 in CGGA and TCGA datasets. When taking all gliomas as a whole, higher B7‐H3 expression indicated significantly worse survival (Figure 5A&D), and this was still the case when divided by IDH mutation status. Although in IDH‐mutant gliomas of the TCGA dataset the impact was not significant, patients with higher B7‐H3 expression tended to experience a shorter life expectancy. We also performed survival analysis for glioblastoma patients (Figure 5B&E), and Kaplan‐Meier curves suggested that B7‐H3 remained a prognosticator in glioblastomas, and the prognostic value became stronger when IDH‐mutant glioblastomas were excluded (Figure 5C&F). Furthermore, the Cox proportional hazard model was generated in both CGGA and TCGA datasets. Cox regression analysis suggested that B7‐H3 was an independent prognosticator for glioma patients (Table 1).
Figure 5.
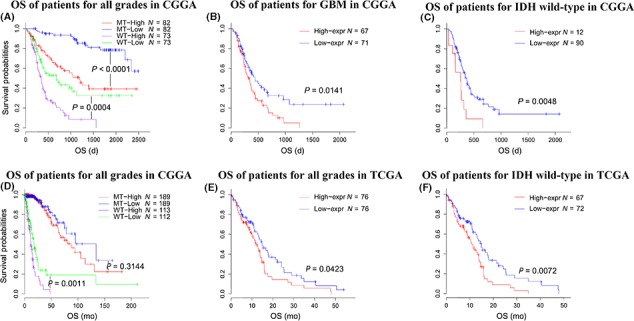
Survival analysis for B7‐H3 in all glioma, GBM, and IDH wild‐type gliomas. Survival analysis for B7‐H3 in Chinese glioma genome atlas dataset (A,B,C) and the cancer genome atlas dataset (D,E,F)
Table 1.
Multivariates Cox proportional hazards regression model for B7‐H3 in Chinese glioma genome atlas (CGGA) and the Cancer Genome Atlas (TCGA) datasets
| CGGA | TCGA | |||||
|---|---|---|---|---|---|---|
| Coefficient | Exp(coef) | P‐value | Coefficient | Exp(coef) | P‐value | |
| Gender | .1635 | 1.178 | .4100 | .113 | 1.12 | .5000 |
| Age | −.0114 | .989 | .2400 | .0398 | 1.041 | 5.70 × 10−08 |
| Grade | 1.008 | 2.74 | 1.00 × 10−09 | .5657 | 1.761 | 1.80 × 10−03 |
| IDH | −.7316 | .481 | 2.80 × 10−03 | −1.2236 | .294 | 4.20 × 10−05 |
| B7‐H3 | .322 | 1.38 | .0170 | .3105 | 1.364 | .0210 |
| Radio | −.7612 | .467 | 1.20 × 10−04 | −.5963 | .551 | 7.10 × 10−03 |
| Chemo | −.4509 | .637 | 2.90 × 10−03 | NA | NA | NA |
Exp(coef): Odds Ratio.
4. DISCUSSION
Recent progress in next‐generation sequencing technologies has fueled the discovery of dysregulated immune function in malignant tumors. Taking advantage of the huge amount of data obtained from CGGA and TCGA projects, we performed a comprehensive analysis for B7‐H3 expression in gliomas and this is, to our best knowledge, the first study characterizing B7‐H3 in whole grade gliomas. Lemke et al29 report on the role of B7‐H3 in glioblastoma, and theirs is an important attempt to decipher the mechanism of B7‐H3 in the deadliest type of glioma. In this study, we expanded our insights into B7‐H3 by taking all diffuse gliomas as a whole into account and investigating its relationship with key molecular alterations in gliomas.
Similar to most immune checkpoints, B7‐H3 expression was significantly upregulated along with tumor grade, suggesting the dysregulation of immune response in higher‐grade gliomas. In molecular subtypes, we also discovered a similar expression pattern of B7‐H3 to PD‐L1, which was described in our previous study.7 Moreover, the ROC curve indicated that B7‐H3 can serve as a marker for mesenchymal subtype, reflecting the most profound inflammatory response in mesenchymal subtype tumors.
In the present study, we accidentally found that in grade II gliomas, B7‐H3 expression was almost the same or even higher in tumors bearing IDH mutation than those that did not. This paradox was confusing, given the recent report that IDH mutation causes immunosuppression in gliomas. In grade III and grade IV gliomas, B7‐H3 showed significantly lower expression in IDH‐mutant tumors than that in IDH wild‐type tumors, consistent with the consensus of an immunosuppression effect of IDH mutation. Subsequent analysis revealed that when B7‐H3 expression was low in the genetic background of wild‐type IDH, methylation at the promoter region (cg10586317) showed the most profound negative correlation with B7‐H3. In tumors with low abundance of B7‐H3 in the background of mutant type IDH, microRNA‐29 family tended to be the potential regulator targeting 3′‐UTR of B7‐H3, while hypermethylation of cd10586317 played a trivial role. This result provided us a clue to the underlying mechanisms of B7‐H3 regulation and that dominant regulators of B7‐H3 expression may vary during the development and progression of gliomas; this may account for the paradox of B7‐H3 expression in grade II gliomas to some extent.
Upon analyzing B7‐H3‐related immune functions, we found that higher expression of B7‐H3 was positively correlated with the Toll‐like receptor signaling pathway, which is a kind of innate immune pathway. When we analyzed the status of innate immune response and found that B7‐H3 was inversely correlated with the activation of the innate immune response, suggesting that in B7‐H3 high‐expression gliomas, innate immune response is generally suppressed, but the Toll‐like receptor signaling pathway is aberrantly activated.
As expected, B7‐H3 was significantly associated with a malignant property of gliomas. Upregulation of B7‐H3 indicated that the tumor was involved in dysregulated immune response and the outcome for glioma patients was dismal. The Cox proportional hazard model revealed that B7‐H3 was a prognosticator independent of a series of molecular and clinical factors in both CGGA and TCGA datasets, which provided more evidence that B7‐H3 may exert a strong anti‐immune effect in the tumor immune microenvironment.
A recent study30 reported that lung adenocarcinoma in ever‐smoking patients is associated with high B7‐H3 expression and that high B7‐H3 expression is associated with poor survival in ever‐smoking patients, but not in nonsmoking patients. Due to a lack of smoking information in our database and TCGA database, we were not able to examine the association of smoking with B7‐H3 expression and other factors of glioma. However, smoking may exert negative effects on B7‐H3 expression in gliomas and quitting smoking would be of benefit to patients.
There are some limitations in our paper. First, due to the lack of methylation data and microarray data for microRNA, we were not able to validate what we found in the TCGA dataset. Second, in subtyping patients (e.g. IDH wild‐type grade II gliomas), the sample size was relatively small, which may have led to sample bias.
In past decades, the outcome of glioma patients has been improved little due to the lack of effective treatments. However, immune checkpoints, including PD‐1/PD‐L1, B7‐H3, have emerged as promising immune treatment targets in the treatment of gliomas. We expand our knowledge of B7‐H3 by characterizing this marker at transcriptional level using vast amounts of clinical and molecular data, and offer new insight into the molecular mechanisms that underlie B7‐H3 regulation, providing the basis for the development of novel therapeutic strategies.
In summary, B7‐H3 expression is regulated by multiple mechanisms and is mainly involved in the T‐cell receptor signaling pathway. Higher B7‐H3 expression indicates a worse prognosis for glioma patients, which warrants further research into the development of inhibitors for targeting this immune checkpoint. However, we still need to be cautious about immune checkpoint inhibition for central nervous system tumors.
CONFLICT OF INTERESTS
The authors declare no conflict of interests.
Supporting information
ACKNOWLEDGMENT
We would like to thank Yuling Yang and Chengyin Liu from Beijing Neurosurgical Institute for collecting tumor samples and clinical patient follow‐up. Furthermore, we appreciate the generosity of TCGA for sharing the huge amount of RNA‐Seq data.
Wang Z, Wang Z, Zhang C, et al. Genetic and clinical characterization of B7‐H3 (CD276) expression and epigenetic regulation in diffuse brain glioma. Cancer Sci. 2018;109:2697–2705. 10.1111/cas.13744
Funding information
This work was supported by grants from: The National Key Research and Development Plan (No. 2016YFC0902500); the National Natural Science Foundation of China (No. 81773208, 81672479, 81402052, 81502495, 81702460); the Beijing Science and Technology Plan (No. Z131100006113018); the National Key Technology Research and Development Program of the Ministry of Science and Technology of China (No. 2014BAI04B02); and the Capital Medical Development Research Fund (2016‐1‐1072).
REFERENCES
- 1. Van Meir EG, Hadjipanayis CG, Norden AD, Shu HK, Wen PY, Olson JJ. Exciting new advances in neuro‐oncology: the avenue to a cure for malignant glioma. CA Cancer J Clin. 2010;60(3):166‐193. [DOI] [PMC free article] [PubMed] [Google Scholar]
- 2. Jiang T, Mao Y, Ma W, et al. CGCG clinical practice guidelines for the management of adult diffuse gliomas. Cancer Lett. 2016;375(2):263‐273. [DOI] [PubMed] [Google Scholar]
- 3. Gomez GG, Kruse CA. Mechanisms of malignant glioma immune resistance and sources of immunosuppression. Gene Ther Mol Biol. 2006;10(A):133‐146. [PMC free article] [PubMed] [Google Scholar]
- 4. Razavi SM, Lee KE, Jin BE, Aujla PS, Gholamin S, Li G. Immune evasion strategies of glioblastoma. Front Surg. 2016;3:11. [DOI] [PMC free article] [PubMed] [Google Scholar]
- 5. Sengupta S, Marrinan J, Frishman C, Sampath P. Impact of temozolomide on immune response during malignant glioma chemotherapy. Clin Dev Immunol. 2012;2012:831090. [DOI] [PMC free article] [PubMed] [Google Scholar]
- 6. Noguchi T, Ward JP, Gubin MM, et al. Temporally distinct PD‐L1 expression by tumor and host cells contributes to immune escape. Cancer Immunol Res. 2017;5(2):106‐117. [DOI] [PMC free article] [PubMed] [Google Scholar]
- 7. Wang Z, Zhang C, Liu X, et al. Molecular and clinical characterization of PD‐L1 expression at transcriptional level via 976 samples of brain glioma. Oncoimmunology. 2016;5(11):e1196310. [DOI] [PMC free article] [PubMed] [Google Scholar]
- 8. Gibson J. Anti‐PD‐L1 for metastatic triple‐negative breast cancer. Lancet Oncol. 2015;16(6):e264. [DOI] [PubMed] [Google Scholar]
- 9. Atkins MBKR, Sznol M. Phase 2, multicenter, safety and efficacy study of pidilizumab in patients with metastatic melanoma. J Clin Oncol. 2014;32(suppl; abstr 9001):5s. [Google Scholar]
- 10. Ohaegbulam KC, Assal A, Lazar‐Molnar E, Yao Y, Zang X. Human cancer immunotherapy with antibodies to the PD‐1 and PD‐L1 pathway. Trends Mol Med. 2015;21(1):24‐33. [DOI] [PMC free article] [PubMed] [Google Scholar]
- 11. Fauci JM, Straughn JM Jr, Ferrone S, Buchsbaum DJ. A review of B7‐H3 and B7‐H4 immune molecules and their role in ovarian cancer. Gynecol Oncol. 2012;127(2):420‐425. [DOI] [PubMed] [Google Scholar]
- 12. Ingebrigtsen VA, Boye K, Tekle C, Nesland JM, Flatmark K, Fodstad Ø. B7‐H3 expression in colorectal cancer: nuclear localization strongly predicts poor outcome in colon cancer. Int J Cancer. 2012;131(11):2528‐2536. [DOI] [PubMed] [Google Scholar]
- 13. Barach YS, Lee JS, Zang X. T cell coinhibition in prostate cancer: new immune evasion pathways and emerging therapeutics. Trends Mol Med. 2011;17(1):47‐55. [DOI] [PMC free article] [PubMed] [Google Scholar]
- 14. Kang FB, Wang L, Li D, Zhang YG, Sun DX. Hepatocellular carcinomas promote tumor‐associated macrophage M2‐polarization via increased B7‐H3 expression. Oncol Rep. 2015;33(1):274‐282. [DOI] [PubMed] [Google Scholar]
- 15. Loo D, Alderson RF, Chen FZ, et al. Development of an Fc‐enhanced anti‐B7‐H3 monoclonal antibody with potent antitumor activity. Clin Cancer Res. 2012;18(14):3834‐3845. [DOI] [PubMed] [Google Scholar]
- 16. Bao ZS, Chen HM, Yang MY, et al. RNA‐seq of 272 gliomas revealed a novel, recurrent PTPRZ1‐MET fusion transcript in secondary glioblastomas. Genome Res. 2014;24(11):1765‐1773. [DOI] [PMC free article] [PubMed] [Google Scholar]
- 17. Louis DN, Perry A, Reifenberger G, et al. The 2016 World Health Organization Classification of tumors of the central nervous system: a summary. Acta Neuropathol. 2016;131(6):803‐820. [DOI] [PubMed] [Google Scholar]
- 18. Yan W, Zhang W, You G, et al. Correlation of IDH1 mutation with clinicopathologic factors and prognosis in primary glioblastoma: a report of 118 patients from China. PLoS ONE. 2012;7(1):e30339. [DOI] [PMC free article] [PubMed] [Google Scholar]
- 19. Team RC . R: A Language and Environment for Statistical Computing. Vienna, Austria: R Foundation for Statistical Computing; 2015. [Google Scholar]
- 20. Wang X, Terfve C, Rose JC, Markowetz F. HTSanalyzeR: an R/Bioconductor package for integrated network analysis of high‐throughput screens. Bioinformatics. 2011;27(6):879‐880. [DOI] [PMC free article] [PubMed] [Google Scholar]
- 21. T T . A Package for Survival Analysis in S. version 2.38. 2015.
- 22. Hanzelmann S, Castelo R, Guinney J. GSVA: gene set variation analysis for microarray and RNA‐seq data. BMC Bioinformatics. 2013;14:7. [DOI] [PMC free article] [PubMed] [Google Scholar]
- 23. Wickham H. ggplot2: Elegant Graphics for Data Analysis. New York, NY: Springer‐Verlag; 2009. [Google Scholar]
- 24. Gu Z, Gu L, Eils R, Schlesner M, Brors B. circlize implements and enhances circular visualization in R. Bioinformatics. 2014;30(19):2811‐2812. [DOI] [PubMed] [Google Scholar]
- 25. Verhaak RGW, Hoadley KA, Purdom E, et al. Integrated genomic analysis identifies clinically relevant subtypes of glioblastoma characterized by abnormalities in PDGFRA, IDH1, EGFR, and NF1. Cancer Cell. 2010;17(1):98‐110. [DOI] [PMC free article] [PubMed] [Google Scholar]
- 26. Xu H, Cheung IY, Guo HF, Cheung NK. MicroRNA miR‐29 modulates expression of immunoinhibitory molecule B7‐H3: potential implications for immune based therapy of human solid tumors. Cancer Res. 2009;69(15):6275‐6281. [DOI] [PMC free article] [PubMed] [Google Scholar]
- 27. Wang Y, Zhang X, Li H, Yu J, Ren X. The role of miRNA‐29 family in cancer. Eur J Cell Biol. 2013;92(3):123‐128. [DOI] [PubMed] [Google Scholar]
- 28. Lee YH, Martin‐Orozco N, Zheng P, et al. Inhibition of the B7‐H3 immune checkpoint limits tumor growth by enhancing cytotoxic lymphocyte function. Cell Res. 2017;27(8):1034‐1045. [DOI] [PMC free article] [PubMed] [Google Scholar]
- 29. Lemke D, Pfenning PN, Sahm F, et al. Costimulatory protein 4IgB7H3 drives the malignant phenotype of glioblastoma by mediating immune escape and invasiveness. Clin Cancer Res. 2012;18(1):105‐117. [DOI] [PubMed] [Google Scholar]
- 30. Inamura K, Yokouchi Y, Kobayashi M, et al. Tumor B7‐H3 (CD276) expression and smoking history in relation to lung adenocarcinoma prognosis. Lung Cancer. 2017;103:44‐51. [DOI] [PubMed] [Google Scholar]
Associated Data
This section collects any data citations, data availability statements, or supplementary materials included in this article.
Supplementary Materials


