Abstract
Serum circulating microRNAs (c‐miRNAs) are serving as useful biomarkers for cancer diagnosis. Here, we describe the development of a one‐step branched rolling circle amplification (BRCA) method to measure serum c‐miRNAs levels for early diagnosis of breast cancer. Four c‐miRNAs, c‐miRNA16 (c‐miR‐16), c‐miRNA21 (c‐miR‐21), c‐miRNA155 (c‐miR‐155), and c‐miRNA195 (c‐miR‐195) were isolated from the serum of 49 breast cancer patients (stages I‐IV) and 19 healthy controls, and analyzed using one‐step BRCA. The serum levels of c‐miR16, c‐miR21, c‐miR155, and c‐miR195 were higher (P < 0.0001) in stage I breast cancer patients than healthy controls. These levels were also higher in several breast cancer molecular subtypes (HER‐2 over‐expression, Luminal A, Luminal B, and triple negative breast cancer) than in healthy control subjects. The diagnostic accuracy of c‐miR16, c‐miR21, c‐miR155, and c‐miR195 for early diagnosis of breast cancer was confirmed by receiver operating characteristic (ROC) curve assay. These results show that the BRCA method can be used to measure serum c‐miRNAs levels, and that this method has high accuracy, sensitivity, and specificity. Moreover, both BRCA approach and quantitative real‐time PCR (qRT‐PCR) method show that the serum levels of c‐miR16, c‐miR21, c‐miR155, and c‐miR195 could be used as biomarkers to improve the early diagnosis of breast cancer, and distinguish different breast cancer molecular subtypes.
Keywords: biomarkers, branched rolling circle amplification, breast cancer early detection, breast cancer screening, circulating microRNAs
1. INTRODUCTION
All over the world, there are more than 1.3 million women diagnosed with breast cancer every year, which makes it the second most common cancer.1, 2, 3 Although breast cancer diagnostic techniques have greatly improved in recent years, the lack of specific biomarkers limits the early diagnosis of breast cancer.4, 5 Most importantly, early diagnosis of breast cancer is central to reduce the morbidity and mortality, and is one of the major challenges in the struggle against this disease.6, 7
Circulating microRNAs (c‐miRNAs) are a class of endogenous, non‐coding RNA, which regulate the expression of over 60% of target genes, and can circulate in plasma, serum, and whole blood samples. Their discovery in cancer patients making c‐miRNAs have enormous potential for using as specific and non‐invasive cancer biomarkers.8, 9 In breast cancer patients, the levels of serum c‐miRNA16 (c‐miR‐16) are significantly higher compared with healthy controls.10, 11 Serum c‐miRNA21 (c‐miR‐21) is one of the most up‐regulated c‐miRNAs in breast cancer patients, indicating that it may serve as an important biomarker for breast cancer detection and progression.12, 13 The expression of serum c‐miRNA155 (c‐miR155) is also increased in breast cancer patients compared with healthy controls.14, 15, 16 In addition, the expression of c‐miRNA195 (c‐miR‐195) is increased in breast cancer patients, but not in other cancers, indicating that it might be used as a breast cancer specific biomarker.17, 18 However, to our knowledge, no previous studies have evaluated the diagnostic performance of the above four c‐miRNAs in breast cancer early‐stage detection.
Analytical methods of c‐miRNAs have been hindered by measurement‐associated inconveniency.19 Some conventional techniques have been used for c‐miRNA detection, such as northern blotting, microarrays, and quantitative real‐time PCR (qRT‐PCR).20, 21, 22 However, these methods have low sensitivity, low selectivity, and labor‐intensive steps, which limit their practical application. With the purpose of improving the sensitivity, specificity, and simplicity of c‐miRNA analysis, many novel techniques have been developed. Among them, rolling circle amplification (RCA) is a simple and efficient isothermal enzymatic process that uses unique DNA or RNA polymerases to generate long single‐stranded DNA (ssDNA) or RNA (ssRNA) with tens to hundreds of tandem repeats by continuously adding nucleotides (nt) to a primer of the circular template.23, 24, 25 Unlike qRT‐PCR, which not only needs two‐step reactions (reverse transcription and polymerase chain reaction) but also requires a thermal cycler and thermostable DNA polymerases, RCA can be produced at an isothermal temperature from room temperature to 37°C by one‐step reaction.26 In addition, branched RCA (BRCA) is an exponential nucleic acid amplification method, where the products of RCA can be used as the template for further amplification by the addition of second and third primers.27, 28 Moreover, in principle, in one form or the other, BRCA has been used to detect miRNAs, including c‐miRNAs in serum.29, 30, 31
Here, we have developed, for the first time, a simple and specific BRCA method for a rapid and convenient detection of c‐miR16, c‐miR21, c‐miR155, and c‐miR195 levels in human serum specimens. The BRCA products are long double‐stranded DNAs (dsDNAs) that can be easily detected by EvaGreen dye, which is non‐fluorescent by itself, but exhibits a great fluorescence enhancement upon binding to dsDNA. Furthermore, we used the BRCA method to determine the diagnostic performance of the four c‐miRNAs to distinguish breast cancer patients with different histological tumor grades and molecular subtypes from healthy controls.32, 33 Meanwhile, we also used the conventional qRT‐PCR method as a secondary independent assay to verify that the four c‐miRNAs could serve as biomarkers.
2. MATERIALS AND METHODS
2.1. Reagents and consumables
The phi29 DNA polymerase, adenosine 5′‐triphosphate solution (ATP), and deoxynucleotide solution mixture (dNTPs) were purchased from New England Biolabs (NEB, Beijing, China). RNase‐free water, T4 Polynucleotide Kinase, T4 DNA Ligase were purchased from TaKaRa Biotechnology Co.,Ltd (Dalian, China). EvaGreen Dye (20× in water) was purchased from Biotium Inc. (Hayward, CA, USA). The oligonucleotides used in this study were synthesized by Invitrogen Biotechnology Co., Ltd (Shanghai, China). All of the pipette tips and centrifuge tubes were DNase and RNase‐free, which were purchased from Axygen, Inc. (Union, CA, USA).
2.2. Human serum specimens
The human blood specimens of breast cancer patients and healthy donors were obtained from the Peking University Shenzhen Hospital (Shenzhen, China), and the Shenzhen People's Hospital (Shenzhen, China) between March 2017 and May 2018. All cancer patients and healthy control donors were Chinese. Control blood specimens (n = 19) were collected from healthy volunteers with no history of breast cancer. Patient blood specimens (n = 49, women, aged 25‐64) were collected at the time of diagnosis, before surgery. As shown in Table 1, patients' histopathological results and clinicopathological features were confirmed by surgical resection of the tumors and clinical immunohistochemical technical.
Table 1.
The clinicopathological features of breast cancer patients
| Characteristics | Number of patients, n (%) |
|---|---|
| Age range: 25‐64 | |
| Mean age: 43 | |
| Median age: 43 | |
| ER statusa | |
| Positive | 39 (79.6) |
| Negative | 8 (16.3) |
| Unknown | 2 (4.1) |
| PR statusa | |
| Positive | 31 (63.2) |
| Negative | 16 (32.7) |
| Unknown | 2 (4.1) |
| HER‐2 statusb | |
| Positive | 20 (40.8) |
| Negative | 24 (49.0) |
| Unknown | 5 (10.2) |
| Ki‐67 proteinc | |
| High (>14%) | 45 (91.8) |
| Low | 2 (4.1) |
| Unknown | 2 (4.1) |
| Tumor sized | |
| Tis | 3 (6.1) |
| T1 | 19 (38.8) |
| T2 | 20 (40.8) |
| T3 | 6 (12.2) |
| Unknown | 1 (2.0) |
| Lymph nodese | |
| N0 | 34 (69.4) |
| N1 | 8 (16.3) |
| N2 | 5 (10.2) |
| Unknown | 2 (4.1) |
| Metastasisf | |
| M0 | 45 (91.8) |
| M1 | 2 (4.1) |
| Unknown | 2 (4.1) |
| Histological tumor grade | |
| Tis (0) | 3 (6.1) |
| I | 16 (32.7) |
| II | 20 (40.8) |
| III | 6 (12.2) |
| IV | 3 (6.1) |
| Unknown | 1 (2.0) |
| Molecular subtypes | |
| HER‐2 over‐expression | 7 (14.3) |
| Luminal A | 4 (8.2) |
| Luminal B | 31 (63.3) |
| Triple negative | 2 (4.1) |
| Unknown | 5 (10.2) |
ER (estrogen receptor)/PR (progesterone receptor) negative: Immunoreactive score (IRS) ≤2; ER/PR positive: IRS >2 but ≤12.
HER‐2 (human epidermal growth factor 2) negative: IHC‐score ≤1; HER‐2 positive: IHC‐score >3.
Ki‐67 protein is a cellular marker for proliferation.
Tis: tumor in situ; T1: Tumor ≤2 cm; T2: Tumor >2 cm but ≤5 cm; T3: Tumor >5 cm.
N0: No regional lymph node metastasis; N1: Metastasis to movable ipsilateral lymph node(s); N2: Metastasis in ipsilateral axillary lymph node(s) fixed or matted, or in clinically apparent ipsilateral internal mammary nodes in the absence of clinically evident axillary lymph node metastasis.
M0: No distant metastasis; M1: Metastasis to distant organs (beyond regional lymph nodes).
2.3. Isolation of serum circulating microRNAs
Human serums were obtained from freshly drawn blood, which were collected by standard phlebotomy in vacuum blood tubes without clot activator, kept at 4°C for 2 h to clot, and then rotate at 300 g for 5 min at 4°C. The serum was transferred into RNase‐free tubes, and stored at −80°C. Circulating microRNAs were extracted from serum using the miRCURY™ RNA Isolation Kit‐Biofluids (EXIQON, Woburn, MA, USA) according to the manufacturer's protocol as shown in Doc. S1.
2.4. Analysis of serum circulating miRNAs using BRCA approach
The main goal of this study was to use the BRCA method to detect serum levels of c‐miRNAs that could be used for early‐stage diagnosis in breast cancer patients. The study consisted of two parts: The first part was the isolation of serum circulating microRNAs, and the second part was the analysis of c‐miR16 (5′‐UAGCAGCACGUAAAUAUUGGCG‐3′), c‐miR21 (5′‐UAGCUUAUCAGACUGAUGUUGA‐3′), c‐miR155 (5′‐UUAAUGCUAAUCGUGAUAGGGGU‐3′), and c‐miR195 (5′‐UAGCAGCACAGAAAUAUUGGC‐3′) serum levels by BRCA (Figure 1).
Figure 1.
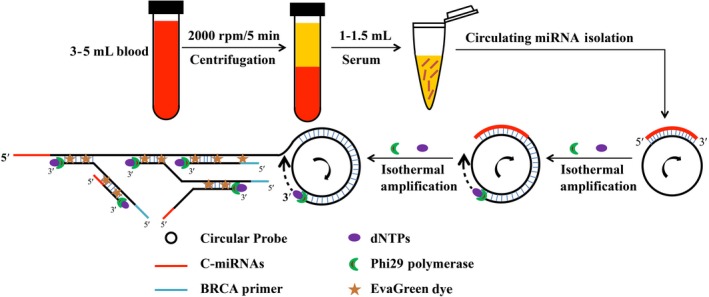
Schematic illustration of serum circulating microRNA detection based on branched rolling circle amplification for breast cancer early‐stage diagnosis
The c‐miRNAs intended for detection are isothermally amplified using BRCA,the DNA circular probes (miR‐16 probe: 5′‐ACGTGCTGCTAACACATCAAAGCCCATACTACAACAACTACAACACGCCATATTT‐3′, miR‐21 probe: 5′‐TGATAAGCTAACACATCAA AGCCCATACTACAACAACTACAACATCAACATCAGTC‐3′, miR‐155 probe: 5′‐GATTAGCATTAAACACATCAAAGCCCATACTACAACAACTACAACAACCCCTATCAC‐3′, and miR‐195 probe:5′‐CTGTGCTGCTAACACATCAAAGCCCATACTACAACAACTACAACAGCCAATATTT‐3′) are partially complementary to the target c‐miRNA. In the presence of target c‐miRNA, RCA is initiated by phi29 DNA polymerase that has exceptional strand displacement and processive synthesis properties, using the DNA circular probe as the template. As a result, a long ssDNA sequence is synthesized, generating multiple copies of the circular probe sequences. The resulting RCA products are used as the template for further amplification using the BRCA primer (5′‐ATCAAAGCCCATACTACA‐3′). The BRCA products are long dsDNAs that can be easily detected by the fluorescent EvaGreen Dye. Conversely, in the absence of target c‐miRNA, the long dsDNA is not synthesized, resulting in a low background for the c‐miRNA detection.
The biosynthesis of DNA circular probe is shown in Figure S1. The circular template serving as the padlock probe DNA, which was designed to be complementary to the both ends of the ligation template. Then, the circular template would hybridize by the ligation template and the circularization is accomplished with the T4 DNA ligase.
The assay was carried out in 50 μL solution containing 5 μL of miR‐16 probe, miR‐21 probe, miR‐155 probe or miR‐195 probe (10 μM), 5 μL of total serum c‐miRNAs (various concentrations), 5 μL of dNTPs (10 mM), 0.5 μL of phi29 DNA polymerase (10 U/μL), 5 μL of RCA buffer (10×), 5 μL of BRCA primer (10 μM), 2.5 μL of EvaGreen Dye (20×), and 22 μL of RNase‐free water. The mixture was incubated at 30°C for 5 h. Subsequently, 5 μL of RCA buffer (10 × ), 2.5 μL of EvaGreen Dye (20×), and 42.5 μL of ddH2O were added to yield a total volume of 100 μL for fluorescence measurement. The apparatus of fluorescence measurement is shown in Doc. S1.
2.5. Statistical analyses
Before statistical comparisons, the specimens were divided into multiple comparison groups including health controls, different histological tumor grades, and different molecular subtypes. C‐miR‐16, c‐miR‐21, c‐miR‐155, and c‐miR‐195 expression profiles were compared using F test, Student's t test, and multiple comparison groups. Bonferroni‐corrected P < 0.05 was considered statistically significant and Bonferroni‐corrected P < 0.01 was considered statistically extremely significant.34, 35, 36
Receiver operating characteristic (ROC) assay was carried out for determining the diagnostic performance of c‐miR‐16, c‐miR‐21, c‐miR‐155, and c‐miR‐195 expression in patients with breast cancer from healthy controls. Sensitivity against (1‐specificity) was plotted at each cutoff threshold, and the area under the curve (AUC) values that reflect the probability of correctly identifying breast cancer patients from healthy controls were calculated. This process was repeated 1000 times, and resulting mean values (95% confidence interval)37 for sensitivity and specificity were calculated.38, 39 All statistical analyses were performed using the Origin version 8.6 (Hampton, MA, USA), IBM SPSS Statistics version 19.0 (Armonk, NY, USA), and MedCalc version 15.8 (Acacialaan, Ostend, Belgium) softwares.
3. RESULTS
3.1. Optimization of detection system
We optimized a series of experiments to achieve the optimal detection conditions, such as the reaction temperature and the reaction time of BRCA. Firstly, as shown in Figure S2A, we optimized the temperature of BRCA (25‐40°C range), the (F‐F 0)/F 0 achieved a maximum value at 30°C, where F and F 0 are the fluorescence intensity (λex = 485 nm, λem = 528 nm) with and without the target c‐miRNA, respectively. Next, we optimized the time of BRCA reaction (Figure S2B), the value of (F‐F 0)/F 0 increased distinctly from 1 to 5 h, and achieved a plateau after 5 h. Thus, the reaction temperature of 30°C and the BRCA reaction time of 5 h were applied for the following experiments.
3.2. Sensitivity of the serum circulating miRNA assay
We further assessed the sensitivity of BRCA approach with the addition of various concentrations of miR‐21. Allowing with the increase of miR‐21 concentrations from 0 to 1 μM, a dramatic rise of the fluorescence intensity was obtained, which reached a plateau after 5 μM (Figure 2A). As shown in Figure 2B, the value of fluorescence intensity has a linear correlation with the logarithm of miR‐21 concentrations over the range from 1 pM to 1 nM. The regression equation is Yfluorescence intensity = 1778.9 + 232.8 lgCmiR‐21 with a correlation coefficient of 0.997. The detection system has a wider linear range (4 orders of magnitude), which the limit of detection is 1 pM. Meanwhile, we have estimated the lowest measurement concentrations of total serum c‐miRNAs and c‐miR‐21 isolated from four human serum specimens by this detection system, we found the lowest total c‐miRNA measurement concentration is 0.001 ng/μL, and the lowest c‐miR‐21 measurement concentration is 4 pM as shown in Table S1.
Figure 2.
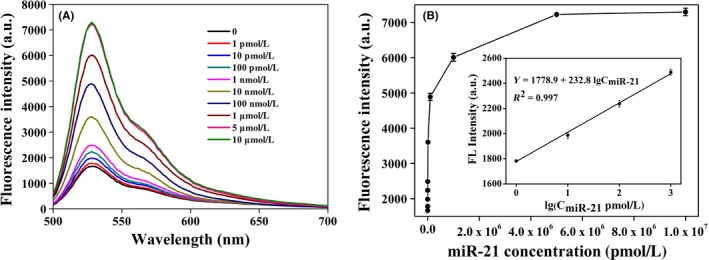
A, The fluorescence emission spectra for various concentrations of miR‐21. From bottom to top: 0, 1, 10, 100 pM, 1, 10, 100 nM, 1, 5, 10 μM. B, The calibration curve between the fluorescence intensity and the logarithm of concentrations of miR‐21. Experimental conditions: RCA temperature 30°C and RCA time 5 h. The error bars represent the standard deviations of three independent experiments
3.3. Selectivity of the serum circulating miRNA assay
In order to estimate the specificity of the proposed four serum c‐miRNA BRCA systems (c‐miR‐16, c‐miR‐21, c‐miR‐155, and c‐miR‐195 BRCA system), we carried out a series of contrast experiments by using miR‐16, miR‐21, miR‐155, and miR‐195 as perfectly matched miRNAs or control sequences, meanwhile, using miR‐10B (5′‐UACCCUGUAGAACCGAAUUUGUG‐3′) and miR‐222 (5′‐AGCUACAUCUGGCUACUGGGU‐3′) as the control sequences respectively. As shown in Figure 3A‐D, these comparisons clearly show that the four serum c‐miRNA BRCA systems have higher selectivity in distinguishing discrepant miRNAs and have huge potential for discriminating the target c‐miRNAs from their family members and other interference sequences.
Figure 3.
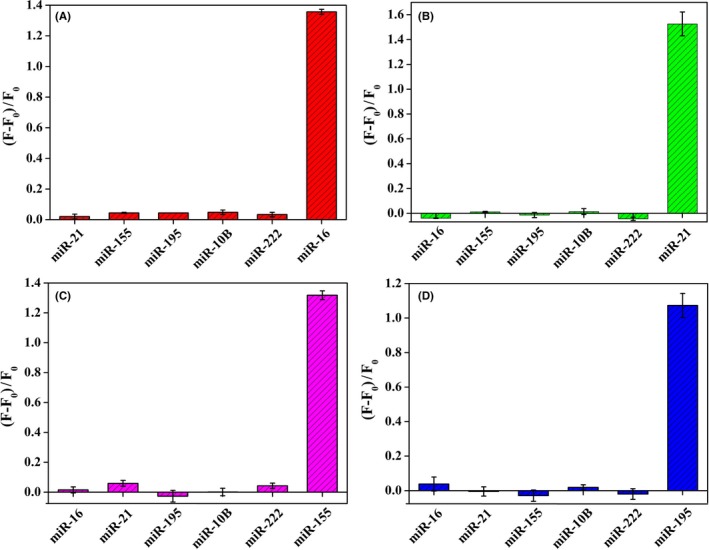
The specificity of the four serum circulating miRNA BRCA systems, miR‐16 BRCA system (A), miR‐21 BRCA system (B), miR‐155 BRCA system (C), and miR‐195 BRCA system (D). Experimental conditions: RCA temperature 30°C and RCA time 5 h. The error bars represent the standard deviations of three independent experiments
3.4. Identification of breast cancer patients using serum c‐miRNA detection by BRCA
Breast cancer patients of different histological tumor grades (stages I‐IV) and healthy controls were enrolled to validate the diagnostic ability of c‐miR‐16, c‐miR‐21, c‐miR‐155, and c‐miR‐195. In comparison with healthy controls, the serum levels of c‐miR‐16, c‐miR‐21, c‐miR‐155, and c‐miR‐195 (all P < 0.0001) were significantly increased in patients with early‐stage breast cancer (stage I or II), as shown in Figure 4A‐D. Furthermore, the serum levels of c‐miR‐16, c‐miR‐21, c‐miR‐155, and c‐miR‐195 (all P < 0.01) were significantly increased in patients with stage III or IV compared to healthy controls.
Figure 4.
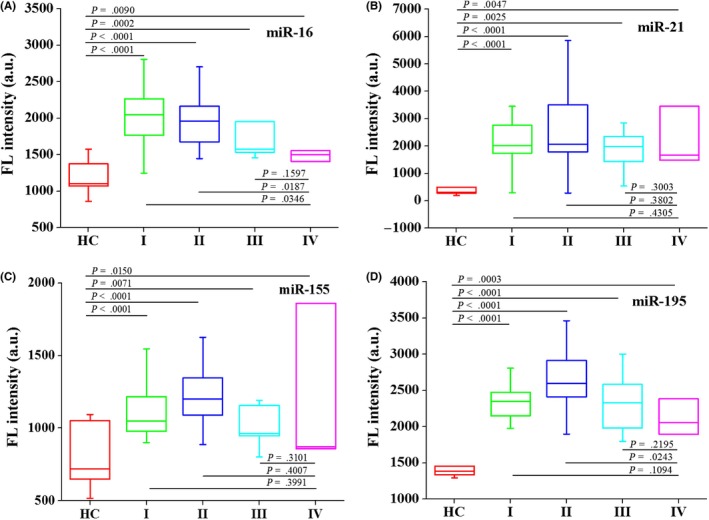
The levels of serum c‐miR‐16 (A), c‐miR‐21 (B), c‐miR‐155 (C), and c‐miR‐195 (D) compared between healthy controls (n = 15) and breast cancer patients with different histological tumor grades: stage I (n = 12), stage II (n = 20), stage III (n = 6), and stage IV (n = 3). HC, healthy controls; I, breast cancer patients at stage I; II, breast cancer patients at stage II; III, breast cancer patients at stage III; IV, breast cancer patients at stage IV. The F test and Student's t test were performed for comparisons between groups
Next, we used different molecular subtypes of breast cancer patients, HER‐2 over‐expression (HER‐2 OE), Luminal A (LA), Luminal B (LB), and triple negative breast cancer (TN), and healthy controls to determine the diagnostic ability of c‐miR‐16, c‐miR‐21, c‐miR‐155, and c‐miR‐195. In comparison with healthy controls, the serum levels of c‐miR‐16, c‐miR‐21, and c‐miR‐155 were significantly increased in patients with LB, TN, HER‐2 OE, and LA (Figure 5A‐C). Moreover, the breast cancer specific biomarker c‐miR‐195 (P < 0.0001) was significantly increased in patients with HER‐2 OE, LA, LB, and TN, compared with healthy controls (Figure 5D).
Figure 5.
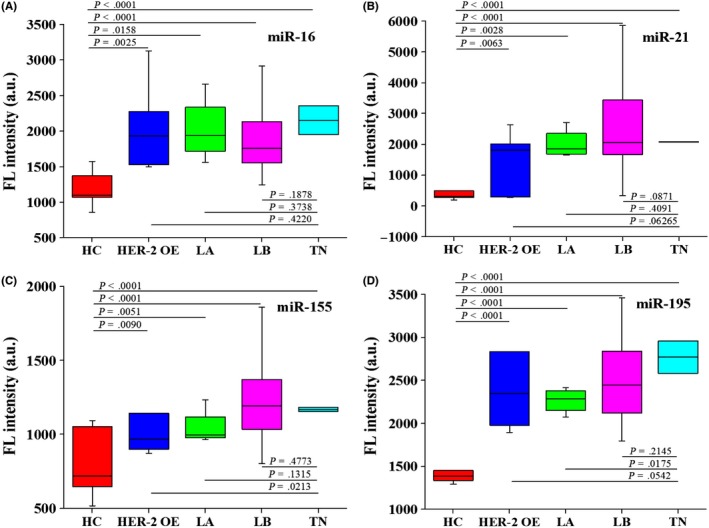
The levels of serum c‐miR‐16 (A), c‐miR‐21 (B), c‐miR‐155 (C), and c‐miR‐195 (D) compared between healthy controls (n = 15) and breast cancer patients with different molecular subtypes: HER‐2 over‐expression (n = 7), Luminal A (n = 4), Luminal B (n = 27), and triple negative breast cancer (n = 2). HER‐2 OE, HER‐2 over‐expression breast cancer patients; LA, breast cancer patients with Luminal A subtype; LB, breast cancer patients with Luminal B subtype; TN, triple negative breast cancer patients. The F test and Student's t test were performed for comparisons between groups
Finally, we used ROC curves to evaluate the performance of the four c‐miRNAs as serum biomarkers for the diagnosis of early breast cancer (Figure 6A‐E). AUC values for serum c‐miR‐16, c‐miR‐21, c‐miR‐155, and c‐miR‐195 in distinguishing patients with breast cancer from healthy controls were 0.936 (95% CI, 0.842‐0.983; sensitivity at 97.78%, specificity at 80.00%), 0.884 (95% CI, 0.776‐0.953; sensitivity at 93.33%, specificity at 80.00%), 0.793 (95% CI, 0.668‐0.886; sensitivity at 100.00%, specificity at 60.00%), and 0.964 (95% CI, 0.881‐0.995; sensitivity at 100.00%, specificity at 80.00%), respectively. Furthermore, combination of the four c‐miRNAs maintained high diagnostic accuracy for patients with breast cancer AUC 0.936 (95% CI, 0.842‐0.983; sensitivity at 88.89%, specificity at 86.67%).
Figure 6.
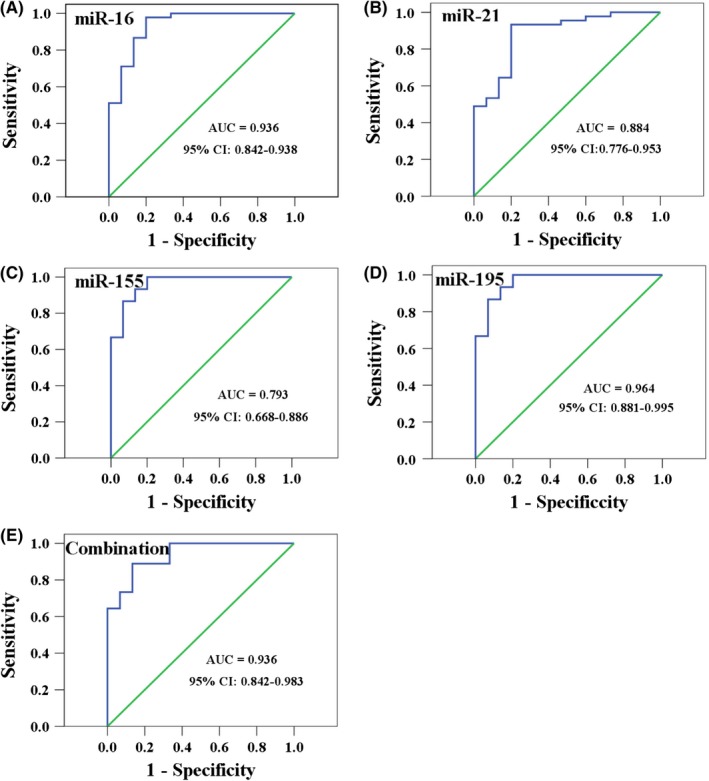
ROC curves for serum c‐miR‐16, c‐miR‐21, c‐miR‐155, c‐miR‐195, and the combination of the four c‐miRNAs in distinguishing patients with breast cancer from healthy controls, AUC values are shown from A to E
3.5. Quantitative real‐time PCR assay
To validate BRCA approach for the detection of c‐miRNAs in human serum, we used the conventional quantitative real‐time PCR (qRT‐PCR) as a secondary independent assay in which the levels of c‐miRNA concentrations are verified. C‐miRNAs were quantified by a commercial qRT‐PCR kit (Doc. S1). The relative fluorescence units (RFU) and the threshold cycle (C t) value were obtained on the 7500 Real‐time PCR system (Applied Biosystems™, Bedford, OH, USA) and analyzed by 7500 Sequence Detection System software version 1.5.1 (Applied Biosystems™).
The fold change of c‐miRNA expression in breast cancer serum specimens compared with healthy controls was calculated based on the C t value using the fold change = 2−ΔΔCt method, where ΔΔC t = (C t miRNAs) breast cancer specimens ‐ (Ct miRNAs) healthy controls. As shown in Figure 7A‐D, the serum levels of c‐miR‐16, c‐miR‐21, c‐miR‐155, and c‐miR‐195 (all P < 0.05) were significantly increased in patients with early‐stage breast cancer (stage I) compared with healthy controls, which verify that the four c‐miRNAs could serve as breast cancer biomarkers.
Figure 7.
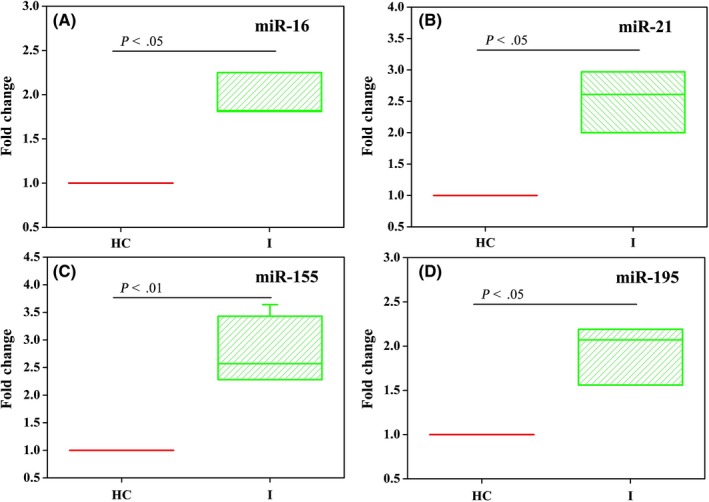
The fold change of c‐miR‐16 (A), c‐miR‐21 (B), c‐miR‐155 (C), and c‐miR‐195 (D) serum levels compared between healthy controls (n = 4) and breast cancer patients at stage I (n = 4). The F test was performed for comparisons between groups
3.6. Comparison of BRCA approach with qRT‐PCR method
For comparison, we used the commercial kit of qRT‐PCR to detect a series of miR‐21 concentrations to establish a calibration curve (Figure 8), then, the calibration curve was applied to detect the concentration of miR‐21 in human serum specimens by qRT‐PCR method. Here, 10% human serums were injected with three different concentrations of miR‐21 at 100 pM, 1 nM, and 10 nM were measured. The result (Table 2) can be clearly shown that BRCA approach exhibits a better recovery rates of standard addition from 101.5% to 104.7% compared with qRT‐PCR method from 91.4% to 110.4%, which indicated that BRCA technology shows stronger anti‐interference ability in clinical diagnosis of cancers compared with conventional qRT‐PCR method.
Figure 8.
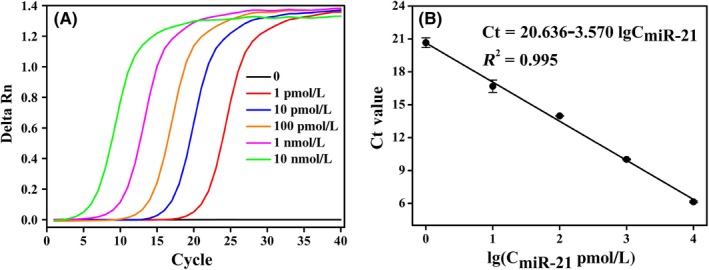
A, The fluorescence monitoring of quantitative real‐time PCR amplification reaction triggered by various concentrations of miR‐21 (0, 1, 10, 100 pM, 1, 10 nM). B, The calibration curve between threshold cycle value (C t) and the logarithm of the different concentrations of miR‐21. The error bars show the standard deviation of three replicate determinations. C t defined as the fractional cycle number where the fluorescence passes the fixed threshold value
Table 2.
Detection of miR‐21 in human serum specimens compared with qRT‐PCR
| Specimen | BRCA assay | qRT‐PCR assay | ||||||
|---|---|---|---|---|---|---|---|---|
| Added/(nM) | Mean Founda/(nM) | Mean Recoveryb(%) | RSDc | Added/(nM) | Mean Found/(nM)a | Mean Recovery (%)b | RSDc | |
| 1 | 0.1 | 0.103 | 102.659 | 0.045 | 0.1 | 0.110 | 110.440 | 1.249 |
| 2 | 1 | 1.043 | 104.328 | 0.355 | 1 | 0.914 | 91.401 | 0.162 |
| 3 | 10 | 10.153 | 101.527 | 1.155 | 100 | 0.938 | 93.787 | 0.172 |
Mean concentration of three replicates.
Mean recovery(%) = (C mean found/C added) × 100%.
Relative standard deviation of three determinations.
4. DISCUSSION
In this study, we analyzed a cohort of 68 serum specimens including 49 breast cancer patients (stages I‐IV) and 19 healthy controls, which found that the serum levels of c‐miR‐16, c‐miR‐21, c‐miR‐155, and c‐miR‐195 could identify patients with early breast cancer, and distinguish them from healthy controls using one‐step BRCA and qRT‐PCR. To our knowledge, it is the first study that demonstrates the detection of c‐miRNA biomarkers by the one‐step BRCA method in clinical serum specimens.
Our study has demonstrated that the levels of c‐miR‐21, c‐miR‐155, and c‐miR‐195 were higher in breast cancer patients than healthy subjects by BRCA approach and conventional qRT‐PCR method. Moreover, we also have verified that the serum c‐miR‐16 levels are not consistent during breast cancer progression, and are influenced by breast cancer status, which is consistent with previous studies.10 In addition, the serum levels of c‐miR‐16, c‐miR‐21, c‐miR‐155, and c‐miR‐195 can not only distinguish early‐stage breast cancer patients (stage I or II) from healthy controls, but also can distinguish different molecular breast cancer subtypes from healthy controls.
In conclusion, it is the first study that demonstrates that the BRCA assay can be used to measure the serum levels of c‐miRNAs to screen and detect early breast cancer. The results demonstrate that the serum levels of c‐miR‐16, c‐miR‐21, c‐miR‐155, and c‐miR‐195 can identify patients with early breast cancer, and distinguish them from healthy controls. Most importantly, our research highlights the value of BRCA in the analysis of c‐miRNAs in clinical serum specimens, and validates serum c‐miRNAs as biomarkers for early breast cancer detection.
CONFLICT OF INTEREST
The authors have no potential conflict of interest to disclose.
Supporting information
ACKNOWLEDGMENTS
The authors thank the State Key Laboratory of Chemical Oncogenomics, Key Laboratory of Chemical Biology, the Graduate School at Shenzhen, Tsinghua University for providing article research platform. They also thank the Peking University Shenzhen Hospital and the Shenzhen People's Hospital for providing serum specimens.
Fan T, Mao Y, Sun Q, et al. Branched rolling circle amplification method for measuring serum circulating microRNA levels for early breast cancer detection. Cancer Sci. 2018;109:2897–2906. 10.1111/cas.13725
Funding information
This work was supported by the National Natural Science Foundation of China (No. 21402105), The ShenZhen Municipal Government SZSITIC (CXB201104210013), and Shenzhen Science and Technology Innovation Committee (JCY J20150403101028189).
Contributor Information
Yu Mao, Email: maoyu@hfut.edu.cn.
Yuyang Jiang, Email: jiangyy@sz.tsinghua.edu.cn.
REFERENCES
- 1. Jemal A, Bray F, Center MM, Ferlay J, Ward E, Forman D. Global cancer statistics. CA Cancer J Clin. 2011;61:69‐90. [DOI] [PubMed] [Google Scholar]
- 2. Maxmen A. The hard facts. Nature. 2012;485:S50‐S51. [DOI] [PubMed] [Google Scholar]
- 3. Molina‐Montes E, Pollan M, Payer T, Molina E, Davila‐Arias C, Sanchez MJ. Risk of second primary cancer among women with breast cancer: a population‐based study in Granada (Spain). Gynecol Oncol. 2013;130:340‐345. [DOI] [PubMed] [Google Scholar]
- 4. Moon PG, Lee JE, Cho YE, et al. Identification of developmental endothelial locus‐1 on circulating extracellular vesicles as a novel biomarker for early breast cancer detection. Clin Cancer Res. 2016;22:1757‐1766. [DOI] [PubMed] [Google Scholar]
- 5. Henry NL, Hayes DF. Cancer biomarkers. Mol Oncol. 2012;6:140‐146. [DOI] [PMC free article] [PubMed] [Google Scholar]
- 6. Cuk K, Zucknick M, Heil J, et al. Circulating microRNAs in plasma as early detection markers for breast cancer. Int J Cancer. 2013;132:1602‐1612. [DOI] [PubMed] [Google Scholar]
- 7. Inns J, James V. Circulating microRNAs for the prediction of metastasis in breast cancer patients diagnosed with early stage disease. Breast. 2015;24:364‐369. [DOI] [PubMed] [Google Scholar]
- 8. Montani F, Marzi MJ, Dezi F, et al. miR‐Test: a blood test for lung cancer early detection. J Natl Cancer Inst. 2015;107:djv063. [DOI] [PubMed] [Google Scholar]
- 9. Wang X, Ivan M, Hawkins SM. The role of MicroRNA molecules and MicroRNA‐regulating machinery in the pathogenesis and progression of epithelial ovarian cancer. Gynecol Oncol. 2017;147:481‐487. [DOI] [PMC free article] [PubMed] [Google Scholar]
- 10. Hu Z, Dong J, Wang LE, et al. Serum microRNA profiling and breast cancer risk: the use of miR‐484/191 as endogenous controls. Carcinogenesis. 2012;33:828‐834. [DOI] [PubMed] [Google Scholar]
- 11. Stuckrath I, Rack B, Janni W, Jager B, Pantel K, Schwarzenbach H. Aberrant plasma levels of circulating miR‐16, miR‐107, miR‐130a and miR‐146a are associated with lymph node metastasis and receptor status of breast cancer patients. Oncotarget. 2015;6:13387‐133401. [DOI] [PMC free article] [PubMed] [Google Scholar]
- 12. Asaga S, Kuo C, Nguyen T, Terpenning M, Giuliano AE, Hoon DS. Direct serum assay for microRNA‐21 concentrations in early and advanced breast cancer. Clin Chem. 2011;57:84‐91. [DOI] [PubMed] [Google Scholar]
- 13. Garzon R, Calin GA, Croce CM. MicroRNAs in cancer. Annu Rev Med. 2009;60:167‐179. [DOI] [PubMed] [Google Scholar]
- 14. Roth C, Rack B, Muller V, Janni W, Pantel K, Schwarzenbach H. Circulating microRNAs as blood‐based markers for patients with primary and metastatic breast cancer. Breast Cancer Res. 2010;12:R90. [DOI] [PMC free article] [PubMed] [Google Scholar]
- 15. Pimentel F, Bonilla P, Ravishankar YG, et al. Technology in microRNA profiling: circulating microRNAs as noninvasive cancer biomarkers in breast cancer. J Lab Autom. 2015;20:574‐588. [DOI] [PubMed] [Google Scholar]
- 16. Mattiske S, Suetani RJ, Neilsen PM, Callen DF. The oncogenic role of miR‐155 in breast cancer. Cancer Epidemiol Biomark Prev. 2012;21:1236‐1243. [DOI] [PubMed] [Google Scholar]
- 17. Heneghan HM, Miller N, Lowery AJ, Sweeney KJ, Newell J, Kerin MJ. Circulating microRNAs as novel minimally invasive biomarkers for breast cancer. Ann Surg. 2010;251:499‐505. [DOI] [PubMed] [Google Scholar]
- 18. Heneghan HM, Miller N, Kelly R, Newell J, Kerin MJ. Systemic miRNA‐195 differentiates breast cancer from other malignancies and is a potential biomarker for detecting noninvasive and early stage disease. Oncologist. 2010;15:673‐682. [DOI] [PMC free article] [PubMed] [Google Scholar]
- 19. Fan T, Mao Y, Liu F, Zhang W, Yin J, Jiang Y. Dual signal amplification strategy for specific detection of circulating microRNAs based on thioflavin T. Sens Actuators B Chem. 2017;249:1‐7. [Google Scholar]
- 20. Valoczi A, Hornyik C, Varga N, Burgyan J, Kauppinen S, Havelda Z. Sensitive and specific detection of microRNAs by northern blot analysis using LNA‐modified oligonucleotide probes. Nucleic Acids Res. 2004;32:e175. [DOI] [PMC free article] [PubMed] [Google Scholar]
- 21. Li W, Ruan K. MicroRNA detection by microarray. Anal Bioanal Chem. 2009;394:1117‐1124. [DOI] [PubMed] [Google Scholar]
- 22. Yan J, Zhang N, Qi C, Liu X, Shangguan D. One‐step real time RT‐PCR for detection of microRNAs. Talanta. 2013;110:190‐195. [DOI] [PubMed] [Google Scholar]
- 23. Hamblin GD, Carneiro KM, Fakhoury JF, Bujold KE, Sleiman HF. Rolling circle amplification‐templated DNA nanotubes show increased stability and cell penetration ability. J Am Chem Soc. 2012;134:2888‐2891. [DOI] [PubMed] [Google Scholar]
- 24. Mao Y, Liu M, Tram K, et al. Optimal DNA templates for rolling circle amplification revealed by in vitro selection. Chemistry. 2015;21:8069‐8074. [DOI] [PubMed] [Google Scholar]
- 25. Konry T, Smolina I, Yarmush JM, Irimia D, Yarmush ML. Ultrasensitive detection of low‐abundance surface‐marker protein using isothermal rolling circle amplification in a microfluidic nanoliter platform. Small. 2011;7:395‐400. [DOI] [PMC free article] [PubMed] [Google Scholar]
- 26. Chen C, Ridzon DA, Broomer AJ, et al. Real‐time quantification of microRNAs by stem‐loop RT‐PCR. Nucleic Acids Res. 2005;33:e179. [DOI] [PMC free article] [PubMed] [Google Scholar]
- 27. Cheng Y, Zhang X, Li Z, Jiao X, Wang Y, Zhang Y. Highly sensitive determination of microRNA using target‐primed and branched rolling‐circle amplification. Angew Chem Int Ed Engl. 2009;48:3268‐3272. [DOI] [PubMed] [Google Scholar]
- 28. Ali MM, Li F, Zhang Z, et al. Rolling circle amplification: a versatile tool for chemical biology, materials science and medicine. Chem Soc Rev. 2014;43:3324‐3341. [DOI] [PubMed] [Google Scholar]
- 29. Li Y, Liang L, Zhang CY. Isothermally sensitive detection of serum circulating miRNAs for lung cancer diagnosis. Anal Chem. 2013;85:11174‐11179. [DOI] [PubMed] [Google Scholar]
- 30. Zhang LR, Zhu G, Zhang CY. Homogeneous and label‐free detection of microRNAs using bifunctional strand displacement amplification‐mediated hyperbranched rolling circle amplification. Anal Chem. 2014;86:6703‐6709. [DOI] [PubMed] [Google Scholar]
- 31. Hong C, Baek A, Hah SS, Jung W, Kim DE. Fluorometric detection of microRNA using isothermal gene amplification and graphene oxide. Anal Chem. 2016;88:2999‐3003. [DOI] [PubMed] [Google Scholar]
- 32. Liedtke C, Rody A, Gluz O, et al. The prognostic impact of age in different molecular subtypes of breast cancer. Breast Cancer Res Treat. 2015;152:667‐673. [DOI] [PubMed] [Google Scholar]
- 33. Cheng H‐T, Huang T, Wang W, et al. Clinicopathological features of breast cancer with different molecular subtypes in Chinese women. J Huazhong Univ Sci Technol Med Sci. 2013;33:117‐121. [DOI] [PubMed] [Google Scholar]
- 34. Toiyama Y, Takahashi M, Hur K, et al. Serum miR‐21 as a diagnostic and prognostic biomarker in colorectal cancer. J Natl Cancer I. 2013;105:849‐859. [DOI] [PMC free article] [PubMed] [Google Scholar]
- 35. Shimomura A, Shiino S, Kawauchi J, et al. Novel combination of serum microRNA for detecting breast cancer in the early stage. Cancer Sci. 2016;107:326‐334. [DOI] [PMC free article] [PubMed] [Google Scholar]
- 36. Freres P, Wenric S, Boukerroucha M, et al. Circulating microRNA‐based screening tool for breast cancer. Oncotarget. 2016;7:5416‐5428. [DOI] [PMC free article] [PubMed] [Google Scholar]
- 37. Koperski L, Kotlarek M, Swierniak M, et al. Next‐generation sequencing reveals microRNA markers of adrenocortical tumors malignancy. Oncotarget. 2017;8:49191‐49200. [DOI] [PMC free article] [PubMed] [Google Scholar]
- 38. Yamada A, Horimatsu T, Okugawa Y, et al. Serum miR‐21, miR‐29a, and miR‐125b are promising biomarkers for the early detection of colorectal neoplasia. Clin Cancer Res. 2015;21:4234‐4242. [DOI] [PMC free article] [PubMed] [Google Scholar]
- 39. Werner S, Krause F, Rolny V, et al. Evaluation of a 5‐marker blood test for colorectal cancer early detection in a colorectal cancer screening setting. Clin Cancer Res. 2016;22:1725‐1733. [DOI] [PubMed] [Google Scholar]
Associated Data
This section collects any data citations, data availability statements, or supplementary materials included in this article.
Supplementary Materials


