Abstract
Programmed cell death ligand‐1 (PD‐L1) detection assays have not been standardized for patients with colorectal cancer, and the prognostic value of PD‐L1 expression is unclear. We compared the PD‐L1 expression patterns in colorectal cancer samples using various immunohistochemical assays using 3 primary PD‐L1 antibodies (assay 1, MIH1; assay 2, E1L3; and assay 3, 22C3) and investigated the prognostic implication of PD‐L1 expression using each. Additionally, PD‐L1 gene amplification was evaluated using FISH. The percentage scorings and positivity rates of the 3 assays differed; the degrees of correlation and concordance between assays 2 and 3 were relatively high, whereas assay 1 was an outlier. Multivariate analyses indicated that PD‐L1 positivity in tumor cells and its negativity in tumor‐infiltrating lymphocytes were independent predictors of poorer overall and disease‐free survival in patients with colorectal cancer. PD‐L1 gene amplification was found in 2 patients (PD‐L1/CEP ratio, 5.60 and 5.84, respectively); both had strong PD‐L1 expression according to immunohistochemistry. Overall, our study showed that PD‐L1 expression status in tumor and immune cells is an independent prognostic factor in patients with colorectal cancer. Standardizations of both PD‐L1 detection using immunohistochemistry and the cut‐off for positivity are necessary. Finally, PD‐L1 gene amplification was found in a small fraction of samples, suggesting the possibility of an ancillary test for PD‐L1 evaluation.
Keywords: colorectal cancer, FISH, immunohistochemistry, prognosis, programmed cell death ligand‐1
1. INTRODUCTION
The immune system plays an important role in eradicating cancer cells. However, in the setting of a malignancy, there are multiple mechanisms of immune system suppression that prevent effective antitumor immunity, one of which is immune checkpoint system suppression of the antitumor T cell‐mediated immune response. The programmed cell death‐1 (PD‐1)/programmed cell death ligand‐1 (PD‐L1) pathway is a major immune checkpoint mechanism. Programmed cell death‐1 expressed by tumors or tumor‐infiltrating immune cells interacts with PD‐1 receptors on activated antitumor CD8+ cytotoxic tumor‐infiltrating lymphocytes (TILs), inhibiting T‐cell receptor signaling and blocking the antitumor immune response.1 Programmed cell death ligand‐1 is upregulated in certain solid tumors; such overexpression can be detected using various immunohistochemical (IHC) assays that recognize different epitopes of PD‐L1. As the role of the PD‐1/PD‐L1 axis in tumor biology has been confirmed, and evidence has emerged that responsiveness to PD‐1/PD‐L1 inhibitors can be predicted by the intensity of PD‐L1 expression, PD‐L1 staining using IHC has become a pivotal diagnostic technique. In fact, some PD‐L1 IHC assays have been approved by the US FDA as companion or complementary diagnostic tools for the selection of cancer patient candidates eligible for PD‐1/PD‐L1 inhibitor therapy, including patients with lung and urinary bladder cancer.
The prognostic implication of PD‐L1 expression has also been widely researched; its positivity in gastric, esophageal, and pancreatic cancers; glioblastoma; and renal cell carcinoma is reportedly associated with poor clinical outcomes.2, 3, 4, 5, 6, 7 However, there are conflicting reports regarding the prognostic role of PD‐L1 expression in melanomas, lung cancer, and colorectal cancer (CRC).3, 8, 9, 10, 11, 12 These discrepant results could be attributed, at least partially, to the IHC assays themselves, including the various antibodies and methodologies used in different studies, the absence of a standard cut‐off value denoting positivity, and tumor heterogeneity for PD‐L1 expression. Amplification of the CD274 gene on chromosome 9p24.1, which encodes PD‐L1, has been detected in subgroups of patients with certain malignancies such as Hodgkin's lymphoma, gastric cancer, and triple‐negative breast cancer,13, 14, 15 suggesting that gene amplification might be another method of detecting PD‐L1 upregulation.
In this study, we evaluated the prognostic implication of PD‐L1 overexpression in CRC. To investigate the methodological variations inherent to IHC assays, 3 different assays and multiple cut‐off values for positivity were applied. We aimed to compare the PD‐L1 expression patterns across the 3 different IHC assays. Finally, we evaluated the CD274/PD‐L1 gene copy number in CRCs using FISH.
2. MATERIALS AND METHODS
2.1. Patients and tissue samples
A total of 336 tissue samples from patients who underwent CRC resection between 2008 and 2009 were collected from the records of the Department of Pathology at Seoul National University Bundang Hospital (Seongnam, Korea). The inclusion criteria were as follows: histologically proven adenocarcinoma, availability of paraffin blocks of the resected specimens, and availability of follow‐up data. Histopathologic and clinical data were obtained from the patients’ pathological reports and medical records. All CRCs included in our study were diagnosed by a pathologist specializing in lower gastrointestinal tract diseases at our institution (LHS). The presence of lymphatic and vascular invasion was initially evaluated using H&E staining, and equivocal cases were re‐evaluated with IHC for CD34 and D2‐40. Pathologic stage was determined per the 7th edition of the American Joint Committee on Cancer grading system. Patients had not previously undergone neoadjuvant chemotherapy or radiotherapy and were followed through to November 1, 2015. The patients’ characteristics are detailed in Table 1.
Table 1.
Clinicopathologic characteristics of patients with colorectal cancer
| Age (years) | |
| Mean ± SD (range) | 63.1 ± 12.5 (32‐89) |
| Gender | |
| Female | 135 (40.2) |
| Male | 201 (59.8) |
| Location | |
| Right colon | 96 (28.6) |
| Left colon | 240 (71.4) |
| Tumor size (cm) | |
| Mean ± SD (range) | 4.8 ± 2.1 (0.7‐13.0) |
| MSI status | |
| MSI high | 18 (5.1) |
| MSI low | 30 (8.9) |
| MSS | 288 (85.7) |
| Differentiation | |
| Well differentiated | 15 (4.5) |
| Moderately differentiated | 304 (90.5) |
| Poorly differentiated | 17 (5.1) |
| T status | |
| pTis | 4 (1.2) |
| pT1 | 16 (4.8) |
| pT2 | 46 (13.7) |
| pT3 | 223 (66.4) |
| pT4a | 32 (9.5) |
| pT4b | 15 (4.5) |
| N status | |
| N0 | 162 (48.2) |
| N1 | 95 (28.3) |
| N2 | 79 (23.5) |
| M status | |
| M0 | 303 (90.2) |
| M1 | 33 (9.8) |
| TNM stage | |
| 0 | 4 (1.2) |
| I | 53 (15.8) |
| II | 104 (31.0) |
| III | 146 (43.6) |
| IV | 28 (8.4) |
| Lymphatic invasion | |
| Present | 110 (32.7) |
| Not identified | 226 (67.3) |
| Vascular invasion | |
| Present | 45 (13.4) |
| Not identified | 291 (86.6) |
| Perineural invasion | |
| Present | 102 (30.4) |
| Not identified | 234 (69.6) |
Data are shown as mean ± SD (range) or N (%).MSI, microsatellite instability; MSS, microsatellite stability.
This study was approved by the Institutional Review Board for Research Using Human Subjects at the Seoul National University Bundang Hospital (IRB No. B‐1711‐438‐302).
2.2. Construction of tissue microarrays
Slides previously stained with H&E were retrospectively reviewed, and representative formalin‐fixed, paraffin‐embedded archival blocks were selected for each case. Two cores (2 mm in diameter) extracted from different areas of the tumor were sampled from each tumor specimen using a trephine apparatus. Trephined paraffin tissue cores were consecutively placed into recipient (tissue microarray [TMA]) blocks.
2.3. Immunohistochemistry for PD‐L1
Three 4‐μm‐thick sections were cut from each paraffin TMA block, mounted on positively charged slides, dried, deparaffinized, and rehydrated. Three different PD‐L1 IHC staining assays were carried out on each TMA slide set as follows: assay 1, staining with the MIH1 clone antibody (monoclonal, 1:30; eBioscience, San Diego, CA, USA) on a Ventana Benchmark platform (Ventana Medical Systems, Tucson, AZ, USA); assay 2, staining with the E1L3N clone antibody (monoclonal, 1:50; Cell Signaling Technology, Danvers, MA, USA) on a Ventana Benchmark platform; and assay 3, staining with the 22C3 clone antibody (monoclonal, ready to use; Dako, Carpinteria, CA, USA) on a Dako Autostainer Link 48 platform. For the Ventana Benchmark platform, heat epitope retrieval was carried out in the autostainer using EDTA. The samples were incubated with each primary antibody (MIH1 and E1L3N) at 37°C for 1 hour and then treated with the UltraView Universal DAB detection kit (Ventana Medical Systems). In the Dako Autostainer Link 48 platform, antigen retrieval was carried out using the EnVision FLEX Target Retrieval Solution (Dako), and primary antibody (pharmDx assay, 22C3; Dako) was applied by the autostainer. The EnVision FLEX Visualization System was used as part of the staining protocol. The MIH1 clone antibody was validated by successfully demonstrating positive expression in the syncytial trophoblast layer of the placenta but not in the stroma, according to the verification test recommended by the manufacturer. The manufacturer of the 22C3 and E1L3N clone antibodies recommended formalin‐fixed, paraffin‐embedded tonsil tissue as a positive control. Strong membrane staining in the crypt epithelium and weak‐to‐moderate membrane staining of the follicular macrophages in the germinal centers represented successful validation of these antibodies; the lymphocytes, endothelium, and fibroblasts were negative as expected (Figure S1).
2.4. Programmed cell death ligand‐1 IHC evaluation
The percentages of PD‐L1‐positive tumor cells and immune cells (taking membranous staining into account) were semiquantitatively scored. Staining intensity was graded as: 0, no staining; 1, equivocal; 2, weak to moderate; and 3, strong. The percentage of positive tumor cells of the 2 TMA cores was averaged; if the staining intensities of the cores were different, the predominant staining pattern was chosen. Evaluation of PD‐L1 was carried out by 2 qualified pathologists (LKS and SE) who were blinded to the clinical and pathological data. Any disagreements in evaluating staining results were resolved by consensus.
Five cut‐off values used in current anti‐PD‐L1 immunotherapy trials (1%, 5%, 10%, 25%, and 50%) were applied when scoring the PD‐L1 positivity of tumor cells to compare staining profiles and positivity rates among the 3 assays. ThePD‐L1 expression rates in tumor cells according to these 5 cut‐off values were used as parameters for survival analysis. Multiple tests revealed that the 1% cut‐off point produced the most significant differences in overall survival (OS) and disease‐free survival (DFS); therefore, it was selected for analyses of survival and correlation between PD‐L1 expression and clinicopathological parameters using all 3 IHC assays. A cut‐off of 5% was used to assess PD‐L1 positivity in immune cells (TILs).
2.5. Programmed cell death ligand‐1 FISH and copy number assessment
Dual color FISH analysis was undertaken on TMA sections. Representative whole tissue sections from the 12 samples that showed immunohistochemical expression of PD‐L1 with 2+ or 3+ intensity scores were also subjected to FISH analysis. Four‐micrometer sections were cut from paraffin blocks, deparaffinized, dehydrated in 100% alcohol, and air dried. The CD274 (PD‐L1)/CEN9q dual color probe (Abnova, Taipei City, Taiwan) was used for in situ hybridization. Dual color probe is a mixture of a red fluorochrome‐labeled SPEC CD274 probe that is specific for the CD274 genes on chromosome 9p24.1 and a green fluorochrome‐labeled CEN9 probe that is specific for the classical satellite III region of chromosome 9 (D9Z3) at 9q12. At least 50 nuclei per sample were counted. Programmed cell death ligand‐1 amplification was defined as a PD‐L1/CEP9 ratio ≥2.0; high‐level amplification was defined as ≥4.0, and low‐level amplification was defined as ≥2.0 and ≤4.0. Polysomy was defined as an average PD‐L1 copy number of >3 signals/cell.
2.6. Statistical analysis
All statistical analyses were undertaken using the spss version 21.0 software package (IBM, Armonk, NY, USA), and plots were constructed using SigmaPlot (version 6.0) (Merck, Darmstadt, Germany). Differences between the mean percentage scores of the 3 assays were evaluated using Pearson's χ2‐test, and Spearman's tests were used to evaluate correlations between the assays. The magnitude of concordance among the 3 assays according to each cut‐off was evaluated using the McNemar test. Interobserver agreement between the pathologists was assessed using Cohen's kappa coefficient. The χ2‐test was used to analyze the correlation between PD‐L1 protein expression and clinicopathological parameters. Survival curves were constructed using the Kaplan‐Meier method, differences among which were determined using the log‐rank test. Multivariate analysis was carried out using Cox's proportional hazards regression model with the backward stepwise selection method. All statistics were 2‐sided, and statistical significance was defined as P < .05.
3. RESULTS
3.1. Staining pattern of PD‐L1 by different IHC assays
Representative photographs of PD‐L1 staining in CRC cells with different intensity scores using the 3 different assays are shown in Figure 1. None of the samples stained using assay 1 had intensity scores of 3+; intensity scores of 2+ and 3+ were considered positive. The numbers of samples showing positive PD‐L1 expression regardless of the percentage score were 49/336 (14.6%), 19/336 (5.7%), and 15/336 (4.5%) using assays 1, 2, and 3, respectively. The detailed distribution of positivity rates in each percentage scoring category for each assay is presented in Figure 2A. The mean percentage scoring indexes of the 3 assays were significantly different; the highest mean percentage score was observed using assay 1 (Figure 2B).
Figure 1.
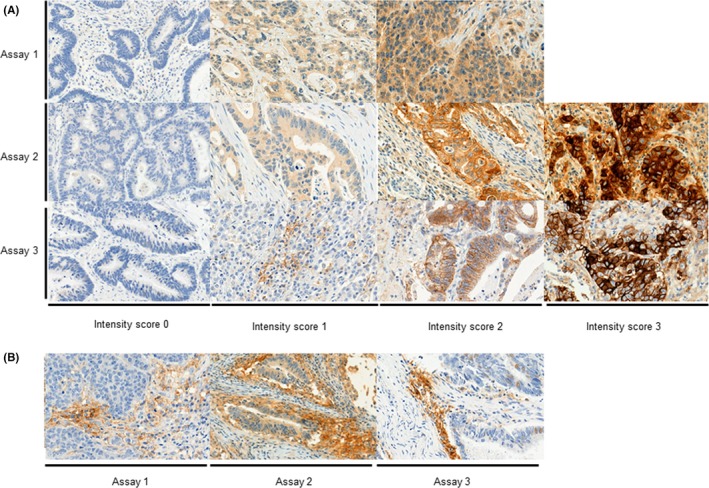
Immunohistochemical expression of programmed cell death ligand‐1 in colorectal cancer cells (A) and tumor‐infiltrating lymphocytes (B) using 3 different assays (original magnification, × 400)
Figure 2.
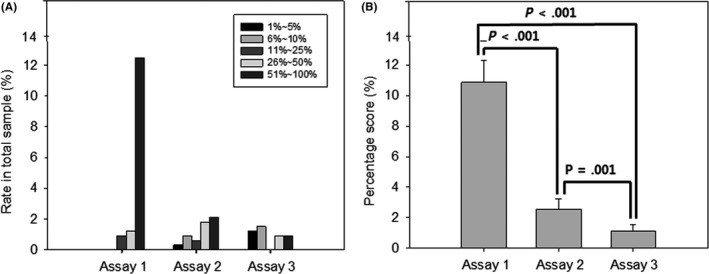
Percentage scoring of programmed cell death ligand‐1 in tumor cells according to each assay. A, Distribution of rates in each categorical percentage scoring for each assay. B, Comparison between the mean percentage scorings of the 3 assays
Correlations between the 3 assays are shown in Figure 3. The Spearman correlation coefficients all showed positive values; however, the absolute correlations between assay 1 and the others were relatively low, whereas the correlation coefficient between assays 2 and 3 was high.
Figure 3.
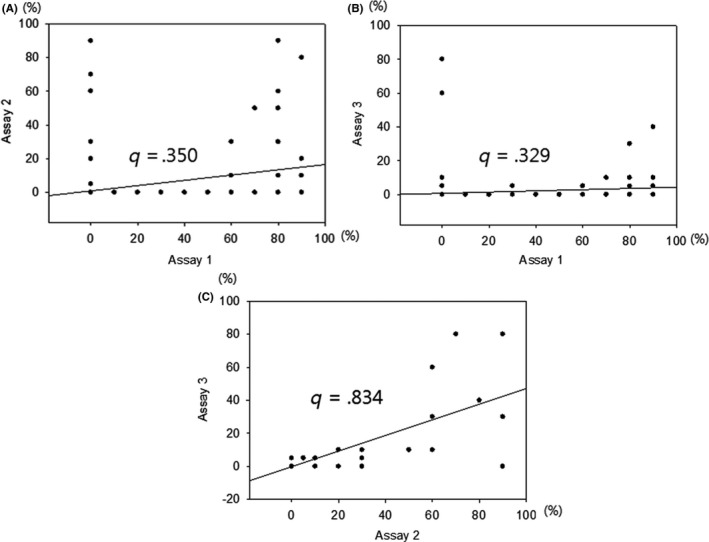
Spearman correlation coefficients for the scores of 3 assays of expression of programmed cell death ligand‐1 in colorectal cancer cells
Cytoplasmic expression of PD‐L1 was also observed in CRC cells with frequencies of 75.4%, 45.2%, and 0.9% using assays 1, 2, and 3, respectively, with a cut‐off value of 1%.
3.2. Comparison of positivity rates in the 3 assays according to different cut‐off values
Table 2 shows the level of concordance between the 3 assays according to different percentage scoring cut‐off values. Concordance between assays 1 and 2 as well as between assays 1 and 3 was >85% when lower cut‐off values (0%, 5%, or 10%) were applied. The concordance between assays 2 and 3 was >95% using any of the cut‐off values. The McNemar test indicated that the positive rates of assays 2 and 3 showed no significant difference when the applied cut‐off values were >0% or >50% (P = .125 each); however, the remaining combinations showed significant differences in their positivity rates (Figure 4).
Table 2.
Level of concordance between 3 assays to assess programmed cell death ligand‐1 expression patterns in colorectal cancer samples, according to different cut‐offs
| Applied cut‐off | Assay 1 | Concordance | P‐value | |||
|---|---|---|---|---|---|---|
| Negative | Positive | |||||
| A | ||||||
| TC > 0% | Assay 2 | Negative | 280 | 37 | 86.9 | <0.001a |
| Positive | 7 | 12 | ||||
| TC > 5% | Assay 2 | Negative | 281 | 37 | 87.2 | <0.001a |
| Positive | 6 | 12 | ||||
| TC > 10% | Assay 2 | Negative | 281 | 40 | 86.3 | <0.001a |
| Positive | 6 | 9 | ||||
| TC > 25% | Assay 2 | Negative | 119 | 204 | 38.7 | <0.001a |
| Positive | 2 | 11 | ||||
| TC > 50% | Assay 2 | Negative | 167 | 162 | 51.8 | <0.001a |
| Positive | 0 | 7 | ||||
| B | ||||||
| TC > 0% | Assay 3 | Negative | 282 | 39 | 86.9 | <0.001a |
| Positive | 5 | 10 | ||||
| TC > 5% | Assay 3 | Negative | 283 | 42 | 86.3 | <0.001a |
| Positive | 4 | 7 | ||||
| TC > 10% | Assay 3 | Negative | 284 | 46 | 85.4 | <0.001a |
| Positive | 3 | 3 | ||||
| TC > 25% | Assay 3 | Negative | 121 | 209 | 37.8 | <0.001a |
| Positive | 0 | 6 | ||||
| TC > 50% | Assay 3 | Negative | 167 | 166 | 5.6 | <0.001a |
| Positive | 0 | 3 | ||||
| Applied cut‐off | Assay 2 | Concordance | P‐value | |||
|---|---|---|---|---|---|---|
| Negative | Positive | |||||
| C | ||||||
| TC > 0% | Assay 3 | Negative | 282 | 39 | 98.8 | 0.125 |
| Positive | 5 | 10 | ||||
| TC > 5% | Assay 3 | Negative | 283 | 42 | 97.9 | 0.016a |
| Positive | 4 | 7 | ||||
| TC > 10% | Assay 3 | Negative | 284 | 46 | 97.3 | 0.004a |
| Positive | 3 | 3 | ||||
| TC > 25% | Assay 3 | Negative | 121 | 209 | 97.9 | 0.016a |
| Positive | 0 | 6 | ||||
| TC > 50% | Assay 3 | Negative | 167 | 166 | 98.8 | 0.125 |
| Positive | 0 | 3 | ||||
Statistically significant difference (P < .05).
TC, tumor cell.
Figure 4.
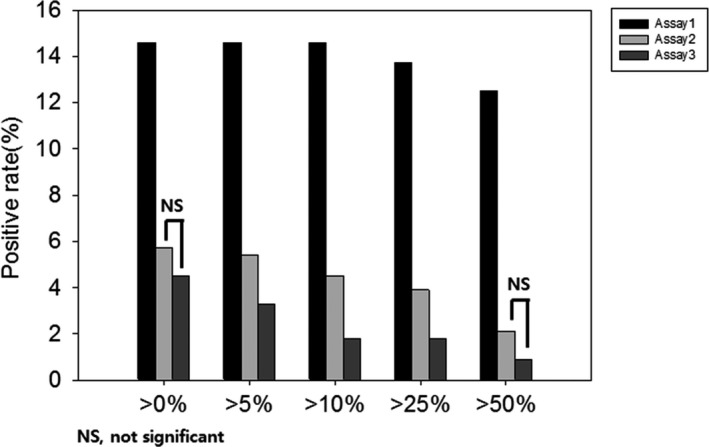
Comparison between programmed cell death ligand‐1 positivity rates of 3 assays according to different cut‐off values in colorectal cancer cells. The 3 assays show significantly different rates of positivity across all cut‐off values, except assays 2 and 3 when using 0% and 50% as cut‐off values. NS, not significant
When using assay 3, Kappa concordance between the 2 pathologists was high (0.647‐0.699) irrespective of the cut‐off applied. The concordance was relatively fair with assay 2; however, the kappa coefficient decreased to 0.259 and 0.246 when applying the high cut‐off values of 25% and 50%, respectively. Assay 1 showed the lowest interobserver concordance (0.237‐0.394) (Table S1).
3.3. Expression of PD‐L1 in TILs
Representative photographs of PD‐L1 staining in TILs using the 3 assays are shown in Figure 1. A cut‐off of 5% was adopted to denote positive staining, as described in a previous study.16 The PD‐L1 positivity rates were 10.3%, 53.7%, and 45.9% when using assays 1, 2, and 3, respectively. The McNemar test revealed significant differences between the positive rates (Figure 5). Expression of PD‐L1 in immune and tumor cells was significantly and inversely correlated when using any of the 5 cut‐off values in assays 2 and 3, whereas no association was found when using assay 1 (data not shown).
Figure 5.
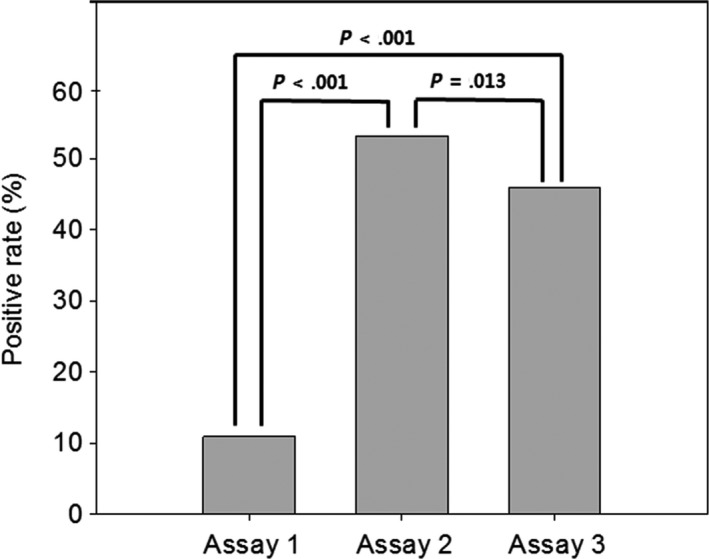
Comparison between the mean percentage programmed cell death ligand‐1 positivity scores of 3 assays in immune cells
3.4. PD‐L1 gene amplification
We further explored the copy number status of the CD274/PD‐L1 gene locus using FISH. PD‐L1 FISH analysis was carried out in TMA blocks; 1 case had high‐level amplification. Subsequently, 12 whole section blocks from CRC samples with intensity scores of 2+ or 3+ in at least 1 of the 3 assays were tested for CD274/PD‐L1 gene amplification; this revealed 1 other sample with high gene amplification (PD‐L1/CEP ratios = 5.60 and 5.84 in the first and second samples, respectively). Both cases showed strong PD‐L1 expression (intensity score = 3+ using both assays 2 and 3) (Figure 6). There were no cases of polysomy.
Figure 6.
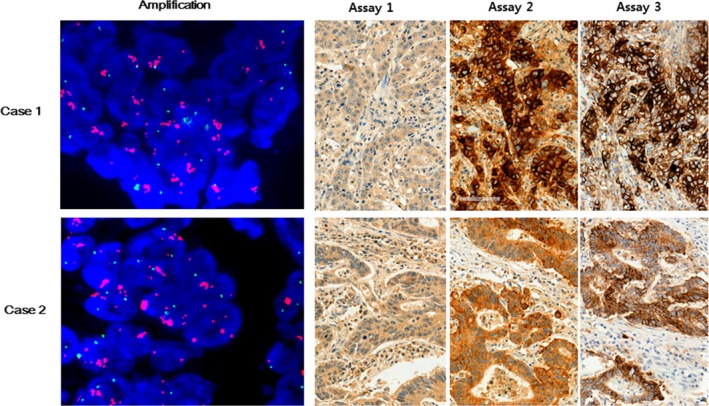
CD274/PD‐L1 gene amplification by FISH analysis from 2 patients with colorectal cancer. CD274 (red) and CEN9 (green) on chromosome p24.1 (magnification, ×1000). Representative images obtained from the same patients show programmed cell death ligand‐1 protein expression in tumor cells (intensity scores: assay 1, 2+; assays 2 and 3, 3+) (magnification, ×200)
3.5. Correlation between PD‐L1 expression and clinicopathologic parameters
Expression of PD‐L1 (assay 3) in CRC tumor cells was correlated with right‐side tumor location, high microsatellite instability (MSI‐H) status, poorer differentiation, higher pathologic T stage, presence of distance metastasis, higher TNM stage, lymphatic invasion, and perineural invasion (P‐values: .015, .026, <.001, .026, .002, .006, .008, and .001, respectively) (Table 3). Expression of PD‐L1 in TILs was associated with lower pathologic T and N stage, the absence of distance metastasis, lower TNM stage, and the absence of lymphatic, vascular, and perineural invasion (P‐values: .006, <.001, .005, <.001, .014, .001, and .002, respectively) (Table 3).
Table 3.
Association between expression of programmed cell death ligand‐1 (PD‐L1) in colorectal cancer samples and clinicopathologic parameters
| PD‐L1 in TC | PD‐L1 in IC | |||
|---|---|---|---|---|
| N (%) | P‐value | N (%) | P‐value | |
| Sex | ||||
| Female | 8/135 (5.9) | .296 | 63/134 (47.0) | .822 |
| Male | 7/201 (3.5) | 89/197 (45.2) | ||
| Location | ||||
| Right | 9/96 (9.4) | .015a | 41/96 (42.7) | .468 |
| Left | 6/240 (2.5) | 111/235 (47.2) | ||
| MSI status | ||||
| MSS | 10/288 (3.5) | .026a | 124/283 (43.8) | .057 |
| MSI low | 2/30 (6.7) | 15/30 (50.0) | ||
| MSI high | 3/18 (16.7) | 13/18 (72.2) | ||
| Differentiation | ||||
| WD | 0/15 (0.0) | <.001a | 9/14 (64.3) | .366 |
| MD | 9/304 (3.0) | 135/300 (45.0) | ||
| PD | 6/17 (35.3) | 8/17 (47.1) | ||
| T status | ||||
| pTis | 0/4 (0.0) | .026a | 3/3 (100.0) | .006a |
| pT1 | 0/16 (0.0) | 11/16 (68.8) | ||
| pT2 | 0/46 (0.0) | 23/44 (52.3) | ||
| pT3 | 9/223 (4.0) | 104/223 (46.6) | ||
| pT4a | 5/32 (15.6) | 7/31 (22.6) | ||
| pT4b | 1/15 (6.7) | 4/14 (28.6) | ||
| N status | ||||
| pN0 | 4/162 (2.5) | .176 | 93/159 (58.5) | <.001a |
| pN1 | 5/95 (5.3) | 39/94 (41.5) | ||
| pN2 | 6/79 (7.6) | 20/78 (25.6) | ||
| M status | ||||
| M0 | 9/303 (3.0) | .002a | 145/299 (48.5) | .005a |
| M1 | 6/33 (18.2) | 7/32 (21.9) | ||
| TNM stage | ||||
| 0 | 0/4 (0.0) | .006a | 3/3 (100.0) | <.001a |
| I | 0/53 (0.0) | 31/52 (59.6) | ||
| II | 4/104 (3.8) | 58/103 (56.3) | ||
| III | 6/146 (4.1) | 53/145 (36.6) | ||
| IV | 5/28 (17.9) | 6/27 (22.2) | ||
| Lymphatic invasion | ||||
| Not identified | 5/226 (2.2) | .008a | 113/226 (50.7) | .014a |
| Present | 10/110 (9.1) | 39/108 (36.1) | ||
| Vascular invasion | ||||
| Not identified | 11/291 (3.8) | .126 | 142/286 (49.7) | .001a |
| Present | 4/45 (8.9) | 10/45 (22.2) | ||
| Perineural invasion | ||||
| Not identified | 4/234 (1.7) | .001a | 119/230 (51.7) | .002a |
| Present | 11/102 (10.8) | 33/101 (32.7) | ||
Statistically significant difference (P < .05).
IC, immune cell; MD, moderately differentiated; MSI, microsatellite instability; MSS, microsatellite stability; PD, poorly differentiated; TC, tumor cell; WD, well differentiated.
3.6. Correlation between PD‐L1 expression and OS
The mean OS of patients with CRC was 52 months (range, 1‐86 months). Among the clinicopathologic parameters, gross type, disease stage, and lymphatic, vascular, and perineural invasion were associated with the patients’ OS (P = .005, <.001, <.001, <.001, and <.001, respectively). The expression of PD‐L1 in tumor cells was associated with poorer OS (Figure 7A‐C), whereas the expression of PD‐L1 in TILs according to assays 2 and 3 was correlated with longer OS (Figure 7D‐F). These correlations were maintained when excluding the 18 patients with MSI‐H.
Figure 7.
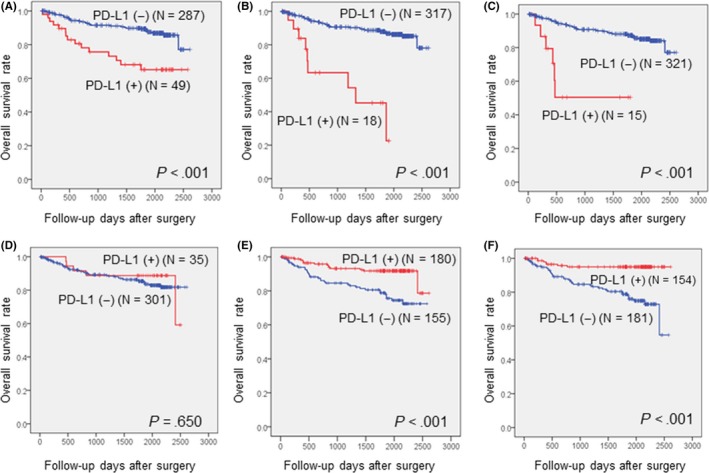
Overall survival curves according to immunohistochemical expression of programmed cell death ligand‐1 (PD‐L1) in tumor cells using assay 1 (A), assay 2 (B), and assay 3 (C) and in immune cells using assay 1 (D), assay 2 (E), and assay 3 (F)
On multivariate analysis, high disease stage, lymphatic invasion, positive expression of PD‐L1 (assay 3), and negative expression of PD‐L1 (assay 3) in TILs were independent predictors of poorer OS in patients with CRC (P‐values: <.001, .025, .007, and .004, respectively) (Table 4).
Table 4.
Univariate and multivariate analysis for overall survival among colorectal cancer patients
| Univariate | Multivariate | |||
|---|---|---|---|---|
| P‐value | HR | 95% CI | P‐value | |
| Gross type | ||||
| Polypoid | .005a | |||
| Ulcerofungating | ||||
| Ulceroinfiltrative | ||||
| Stage | ||||
| 0/I | <.001a | 1.000 | <.001a | |
| II | 1.593 | 0.439‐5.813 | ||
| III | 1.048 | 0.287‐3.824 | ||
| IV | 8.325 | 2.148‐32.268 | ||
| Lymphatic invasion | ||||
| Absent | <.001a | 1.000 | .025a | |
| Present | 1.774 | 0.812‐3.873 | ||
| Vascular invasion | ||||
| Absent | <.001a | |||
| Present | ||||
| Perineural invasion | ||||
| Absent | <.001a | |||
| Present | ||||
| PD‐L1 in TC | ||||
| Negative | <.001a | 1.000 | .007a | |
| Positive | 3.785 | 1.447‐9.898 | ||
| PD‐L1 in IC | ||||
| Negative | <.001a | 3.428 | 1.467‐8.012 | .004a |
| Positive | 1.000 | |||
CI, confidence interval; HR, hazard ratio; IC, immune cell; PD‐L1, programmed cell death ligand‐1; TC, tumor cell.
Statistically significant difference (P < .05).
Cytoplasmic expression of PD‐L1 had no association with patients’ OS (data not shown).
3.7. Correlation between PD‐L1 expression and DFS
The mean DFS of patients with CRC was 49 months (range, 1‐85 months). Among the clinicopathologic parameters, gross type, disease stage, and lymphatic, vascular, and perineural invasion were associated with DFS (P‐values: .008, <.001, <.001, <.001, and <.001, respectively). On univariate analysis, the expression of PD‐L1 in tumor cells was associated with shorter DFS when using assays 2 and 3; the differences were statistically significant (Figure 8A‐C). The expression of PD‐L1 in TILs was correlated with longer DFS when applying assays 2 and 3 (Figure 8D‐F). These correlations were maintained when excluding patients with MSI‐H.
Figure 8.
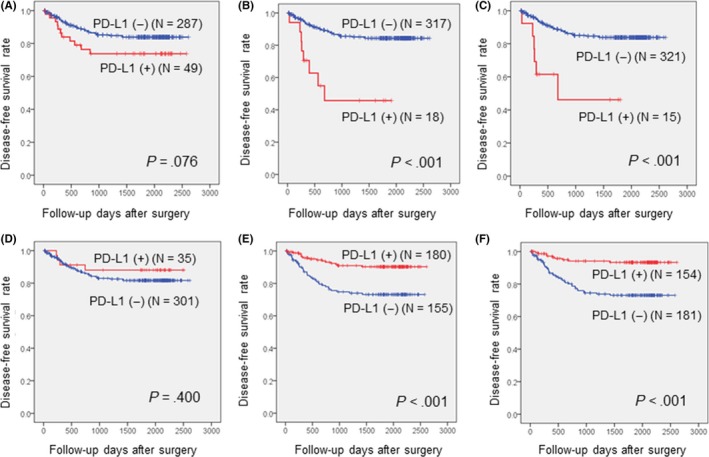
Disease‐free survival curve according to immunohistochemical expression of programmed cell death ligand‐1 (PD‐L1) in tumor cells using assay 1 (A), assay 2 (B), and assay 3 (C) and in immune cells using assay 1 (D), assay 2 (E), and assay 3 (F)
Multivariate analysis indicated that a high disease stage, positive expression of PD‐L1 (assay 3) in tumor cells, and negative expression of PD‐L1 (assay 3) in TILs were associated with shorter DFS (P‐values: <.001, .005, and .002, respectively) (Table 5).
Table 5.
Univariate and multivariate analysis for disease‐free survival among colorectal cancer patients
| Univariate | Multivariate | |||
|---|---|---|---|---|
| P‐value | HR | 95% CI | P‐value | |
| Gross type | ||||
| Polypoid | .008a | |||
| Ulcerofungating | ||||
| Ulceroinfiltrative | ||||
| Stage | ||||
| 0/I | <.001a | 1.000 | <.001a | |
| II | 4.620 | 0.585‐36.500 | ||
| III | 8.053 | 1.087‐59.679 | ||
| IV | 37.240 | 4.711‐294.377 | ||
| Lymphatic invasion | ||||
| Absent | <.001a | |||
| Present | ||||
| Vascular invasion | ||||
| Absent | <.001a | |||
| Present | ||||
| Perineural invasion | ||||
| Absent | <.001a | |||
| Present | ||||
| PD‐L1 in TC | ||||
| Negative | <.001a | 1.000 | .005a | |
| Positive | 3.504 | 1.461‐8.406 | ||
| PD‐L1 in IC | ||||
| Negative | <.001a | 3.425 | 1.572‐7.461 | .002a |
| Positive | 1.000 | |||
Statistically significant difference (P < .05)
CI, confidence interval; HR, hazard ratio; IC, immune cell; PD‐L1, programmed cell death ligand‐1; TC, tumor cell.
Cytoplasmic expression of PD‐L1 had no association with the patients’ DFS (data not shown).
4. DISCUSSION
Previous studies revealed an association between unfavorable clinical outcomes and tumoral PD‐L1 expression in patients with CRC,11, 17, 18 whereas other studies found no such associations.9, 19 Some researchers suggested that the prognostic implication of PD‐L1 expression might depend on the mismatch repair status,8, 10 but the outcomes were inconsistent. Our own survival analysis showed that the expression of PD‐L1 was correlated with poorer clinical outcomes in patients with CRC. However, the statistical significance of the association between PD‐L1 expression and patient outcome changed according to the type of IHC assay and the cut‐off value applied. These results suggested that variability between assays might be one of the causes of the conflicting results. However, despite the fluctuation in P‐values, the overall trend of our data was that PD‐L1 expression was associated with poorer clinical outcome in patients with CRC regardless of the type of assay used or the cut‐off value. Thus, we can postulate that other confounding factors, such as the composition of the study population or variations in treatment, might also play a role in the conflicting results in previous studies on this topic.
In our study, PD‐L1 expression in TILs was strongly associated with favorable clinical outcomes, which was in direct contrast to PD‐L1 expression in tumor cells. The published data remain equivocal, as both favorable and unfavorable outcomes have been associated with TIL PD‐1 or PD‐L1 positivity in patients with cancer.20, 21, 22, 23, 24, 25 Considering the role of PD‐1 and PD‐L1 in tumor biology, the favorable prognostic effects of PD‐L1‐positive TILs found in our study, as well as others that investigated urothelial carcinoma, ovarian serous carcinoma, and breast cancer, are unexpected.20, 24, 25 These findings might be attributed to a bystander effect of TIL infiltration; in fact, the number of PD‐L1‐positive TILs was associated with TIL density, implying that PD‐L1‐positive immune cells increased proportionally to the intratumoral immune reaction.24, 25 However, Darb‐Esfahani et al24 reported that positive prognoses associated with PD‐L1‐positive TILs are independent of the number of T cells; in our previous study, there was no evidence that PD‐L1 expression was related to the density of TILs.19 The complex interaction between immune effector cells and the tumor microenvironment very likely impacts the biological significance of particular immune markers and also appears to be dependent on the tumor type.
We compared the staining patterns of 3 different primary antibodies in CRC tissues and used various cut‐off values for positivity. Although the percentage scores and positivity rates of the 3 assays were significantly different, the degree of correlation and concordance rate between assays 2 and 3 were relatively high. This was similar to the results of Rimm et al.26 However, the degrees of correlation between assay 1 and the other assays were low; moreover, the concordance rates between assays 1 and 2 or between assays 1 and 3 decreased when applying higher cut‐off values. Assay 1 was also an outlier in terms of percentage scores and positivity rates. The PD‐L1 positivity rates in CRCs varied in previous studies; a study using MIH1 as the primary PD‐L1 antibody found very high PD‐L1 positivity rates in CRC tumor cells but concluded that there was no prognostic significance for PD‐L1 expression.9 Similarly, we found a lower level of statistical significance between PD‐L1 expression and prognosis when applying assay 1. The cytoplasmic expression levels in each of the 3 assays were also different, and interobserver discrepancies in membranous staining were high for assays 1 and 2, which showed higher frequencies of cytoplasmic expression, implying that the cytoplasmic staining pattern might distort the interpretation of membranous staining. These results revealed the influence of the type of IHC assay on outcomes.
Recent attempts have been made to validate and compare multiple PD‐L1 IHC assays, especially for the diagnosis of non‐small‐cell lung cancer, which requires application of PD‐L1 IHC assay as a companion or complementary diagnostic tool. The researchers showed that different PD‐L1 antibodies and staining techniques produced varying positivity rates.27, 28 As each PD‐L1 antibody is generated using different immunogens leading to a unique epitope, different PD‐L1 conformations or isoforms may cause discordant staining results. Location of the domain where the antibody binds has been known to affect the expression pattern.29
To our knowledge, the prevalence and significance of PD‐L1 gene copy number gains in CRC have yet to be investigated. We observed that a very small fraction of CRCs showed amplification of the PD‐L1 gene. Even though this rate was much lower than that in other malignant tumors,13, 14, 15, 30, 31 our results suggest that, in some CRC patients, PD‐L1 gene amplification definitely contributes to the upregulation of the PD‐1/PD‐L1 axis. Upregulation of PD‐L1, which is the target molecule of PD‐1/PD‐L1 inhibitors, might improve the efficacy of such inhibitors. In fact, IHC expression of PD‐L1 is an FDA‐approved biomarker for PD‐L1 inhibitor use in patients with non‐small‐cell lung cancer and urothelial carcinoma. However, in CRC, the evidence for an association between PD‐L1 expression on IHC and PD‐1/PD‐L1 inhibitor response is lacking, and MSI‐H status is considered the sole deciding factor for prescribing these inhibitors. Copy number gains could be responsible for increased expression levels of genes located at the gained locus; in the present study, both cases with PD‐L1 gene amplification diffusely and strongly (3+) expressed PD‐L1, suggesting that PD‐L1 gene amplification was closely associated with a marked overexpression of PD‐L1. Therefore, the PD‐L1 FISH test, which has an advantage over IHC in terms of reproducibility, might provide a strict and objective guideline for using PD‐1/PD‐L1 inhibitors. Similarly, the FISH test for HER‐2 amplification is used for determining trastuzumab candidates in gastric and breast cancers when HER‐2 expression is inconclusive on IHC. It might be worthwhile to determine whether PD‐L1 copy numbers are associated with clinical improvement following anti‐PD‐1/PD‐L1 therapy in CRC patients.
There were some limitations in our study. First, we had no outcome data as our patients were not treated with PD‐1/PD‐L1 inhibitor therapy; hence, the direct relationship between PD‐L1 expression and response to such inhibitors could not be evaluated. Second, the number of CRC cases with MSI‐H in our cohort was relatively small, and none of the patients with MSI‐H died during the follow‐up period. Thus, evaluating the clinical implication of PD‐L1 expression in patients with MSI‐H was not possible. Finally, the possibility of bias from intratumoral heterogeneity was not completely ruled out, although 2 cores per tumor were acquired.
In conclusion, we showed that PD‐L1 expression in tumors and TILs are independent prognostic predictors in patients with CRC using multiple IHC platforms and cut‐off values. The percentage scorings and positivity rates of the 3 assays were different, and the degrees of correlation and concordance rates varied per assay. Thus, validated assay methods and cut‐off criteria are necessary for the clinical consideration of PD‐L1 expression in CRC. To the best of our knowledge, we are the first to show that PD‐L1 gene amplification in a small fraction of CRC samples and strong PD‐L1 expression on IHC appear to be related to the amplification of the PD‐L1 gene. Therefore, PD‐L1 FISH might be considered an ancillary test for PD‐L1 evaluation.
CONFLICT OF INTEREST
The authors have no conflict of interest to declare.
Supporting information
ACKNOWLEDGMENTS
This research was funded by the Seoul National University Bundang Hospital Research Fund (Grant No. 14‐2016‐007).
Lee KS, Kim BH, Oh H‐K, et al. Programmed cell death ligand‐1 protein expression and CD274/PD‐L1 gene amplification in colorectal cancer: Implications for prognosis. Cancer Sci. 2018;109:2957‐2969. 10.1111/cas.13716
REFERENCES
- 1. Postow MA, Callahan MK, Wolchok JD. Immune checkpoint blockade in cancer therapy. J Clin Oncol. 2015;33(17):1974‐1982. [DOI] [PMC free article] [PubMed] [Google Scholar]
- 2. Frydenlund N, Mahalingam M. PD‐L1 and immune escape: insights from melanoma and other lineage‐unrelated malignancies. Hum Pathol. 2017;66:13‐33. [DOI] [PubMed] [Google Scholar]
- 3. Wang X, Teng F, Kong L, Yu J. PD‐L1 expression in human cancers and its association with clinical outcomes. Onco Targets Ther. 2016;9:5023‐5039. [DOI] [PMC free article] [PubMed] [Google Scholar]
- 4. Gu L, Chen M, Guo D, et al. PD‐L1 and gastric cancer prognosis: a systematic review and meta‐analysis. PLoS ONE. 2017;12(8):e0182692. [DOI] [PMC free article] [PubMed] [Google Scholar]
- 5. Birnbaum DJ, Finetti P, Lopresti A, et al. Prognostic value of PDL1 expression in pancreatic cancer. Oncotarget. 2016;7(44):71198‐71210. [DOI] [PMC free article] [PubMed] [Google Scholar]
- 6. Lee KS, Lee K, Yun S, et al. Prognostic relevance of programmed cell death ligand 1 expression in glioblastoma. J Neurooncol. 2017;136:453‐461. [DOI] [PubMed] [Google Scholar]
- 7. Iacovelli R, Nole F, Verri E, et al. Prognostic role of PD‐L1 expression in renal cell carcinoma. a systematic review and meta‐analysis. Target Oncol. 2016;11(2):143‐148. [DOI] [PubMed] [Google Scholar]
- 8. Droeser RA, Hirt C, Viehl CT, et al. Clinical impact of programmed cell death ligand 1 expression in colorectal cancer. Eur J Cancer. 2013;49(9):2233‐2242. [DOI] [PubMed] [Google Scholar]
- 9. Masugi Y, Nishihara R, Yang J, et al. Tumour CD274 (PD‐L1) expression and T cells in colorectal cancer. Gut. 2017;66(8):1463‐1473. [DOI] [PMC free article] [PubMed] [Google Scholar]
- 10. Lee LH, Cavalcanti MS, Segal NH, et al. Patterns and prognostic relevance of PD‐1 and PD‐L1 expression in colorectal carcinoma. Mod Pathol 2016;29(11):1433‐1442. [DOI] [PMC free article] [PubMed] [Google Scholar]
- 11. Liang M, Li J, Wang D, et al. T‐cell infiltration and expressions of T lymphocyte co‐inhibitory B7‐H1 and B7‐H4 molecules among colorectal cancer patients in northeast China's Heilongjiang province. Tumour Biol. 2014;35(1):55‐60. [DOI] [PubMed] [Google Scholar]
- 12. Li Y, Liang L, Dai W, et al. Prognostic impact of programed cell death‐1 (PD‐1) and PD‐ligand 1 (PD‐L1) expression in cancer cells and tumor infiltrating lymphocytes in colorectal cancer. Mol Cancer. 2016;15(1):55. [DOI] [PMC free article] [PubMed] [Google Scholar]
- 13. Green MR, Monti S, Rodig SJ, et al. Integrative analysis reveals selective 9p24.1 amplification, increased PD‐1 ligand expression, and further induction via JAK2 in nodular sclerosing Hodgkin lymphoma and primary mediastinal large B‐cell lymphoma. Blood. 2010;116(17):3268‐3277. [DOI] [PMC free article] [PubMed] [Google Scholar]
- 14. Cancer Genome Atlas Research N . Comprehensive molecular characterization of gastric adenocarcinoma. Nature. 2014;513(7517):202‐209. [DOI] [PMC free article] [PubMed] [Google Scholar]
- 15. Barrett MT, Anderson KS, Lenkiewicz E, et al. Genomic amplification of 9p24.1 targeting JAK2, PD‐L1, and PD‐L2 is enriched in high‐risk triple negative breast cancer. Oncotarget. 2015;6(28):26483‐26493. [DOI] [PMC free article] [PubMed] [Google Scholar]
- 16. Kim JH, Park HE, Cho NY, Lee HS, Kang GH. Characterisation of PD‐L1‐positive subsets of microsatellite‐unstable colorectal cancers. Br J Cancer. 2016;115(4):490‐496. [DOI] [PMC free article] [PubMed] [Google Scholar]
- 17. Shi SJ, Wang LJ, Wang GD, et al. B7‐H1 expression is associated with poor prognosis in colorectal carcinoma and regulates the proliferation and invasion of HCT116 colorectal cancer cells. PLoS ONE. 2013;8(10):e76012. [DOI] [PMC free article] [PubMed] [Google Scholar]
- 18. Song M, Chen D, Lu B, et al. PTEN loss increases PD‐L1 protein expression and affects the correlation between PD‐L1 expression and clinical parameters in colorectal cancer. PLoS ONE. 2013;8(6):e65821. [DOI] [PMC free article] [PubMed] [Google Scholar]
- 19. Lee KS, Kwak Y, Ahn S, et al. Prognostic implication of CD274 (PD‐L1) protein expression in tumor‐infiltrating immune cells for microsatellite unstable and stable colorectal cancer. Cancer Immunol Immunother. 2017;66(7):927‐939. [DOI] [PMC free article] [PubMed] [Google Scholar]
- 20. Bellmunt J, Mullane SA, Werner L, et al. Association of PD‐L1 expression on tumor‐infiltrating mononuclear cells and overall survival in patients with urothelial carcinoma. Ann Oncol. 2015;26(4):812‐817. [DOI] [PubMed] [Google Scholar]
- 21. Muenst S, Soysal SD, Gao F, Obermann EC, Oertli D, Gillanders WE. The presence of programmed death 1 (PD‐1)‐positive tumor‐infiltrating lymphocytes is associated with poor prognosis in human breast cancer. Breast Cancer Res Treat. 2013;139(3):667‐676. [DOI] [PMC free article] [PubMed] [Google Scholar]
- 22. Badoual C, Hans S, Merillon N, et al. PD‐1‐expressing tumor‐infiltrating T cells are a favorable prognostic biomarker in HPV‐associated head and neck cancer. Cancer Res. 2013;73(1):128‐138. [DOI] [PubMed] [Google Scholar]
- 23. Thompson RH, Dong H, Lohse CM, et al. PD‐1 is expressed by tumor‐infiltrating immune cells and is associated with poor outcome for patients with renal cell carcinoma. Clin Cancer Res. 2007;13(6):1757‐1761. [DOI] [PubMed] [Google Scholar]
- 24. Darb‐Esfahani S, Kunze CA, Kulbe H, et al. Prognostic impact of programmed cell death‐1 (PD‐1) and PD‐ligand 1 (PD‐L1) expression in cancer cells and tumor‐infiltrating lymphocytes in ovarian high grade serous carcinoma. Oncotarget. 2016;7(2):1486‐1499. [DOI] [PMC free article] [PubMed] [Google Scholar]
- 25. Denkert C, von Minckwitz G, Brase JC, et al. Tumor‐infiltrating lymphocytes and response to neoadjuvant chemotherapy with or without carboplatin in human epidermal growth factor receptor 2‐positive and triple‐negative primary breast cancers. J Clin Oncol. 2015;33(9):983‐991. [DOI] [PubMed] [Google Scholar]
- 26. Rimm DL, Han G, Taube JM, et al. A prospective, multi‐institutional, pathologist‐based assessment of 4 immunohistochemistry assays for PD‐L1 expression in non‐small cell lung cancer. JAMA Oncol. 2017;3(8):1051‐1058. [DOI] [PMC free article] [PubMed] [Google Scholar]
- 27. Sheffield BS, Fulton R, Kalloger SE, et al. Investigation of PD‐L1 biomarker testing methods for PD‐1 axis inhibition in non‐squamous non‐small cell lung cancer. J Histochem Cytochem. 2016;64(10):587‐600. [DOI] [PMC free article] [PubMed] [Google Scholar]
- 28. McLaughlin J, Han G, Schalper KA, et al. Quantitative assessment of the heterogeneity of PD‐L1 expression in non‐small‐cell lung cancer. JAMA Oncol. 2016;2(1):46‐54. [DOI] [PMC free article] [PubMed] [Google Scholar]
- 29. Mahoney KM, Sun H, Liao X, et al. PD‐L1 antibodies to its cytoplasmic domain most clearly delineate cell membranes in immunohistochemical staining of tumor cells. Cancer Immunol Res. 2015;3(12):1308‐1315. [DOI] [PMC free article] [PubMed] [Google Scholar]
- 30. Ansell SM, Lesokhin AM, Borrello I, et al. PD‐1 blockade with nivolumab in relapsed or refractory Hodgkin's lymphoma. N Engl J Med. 2015;372(4):311‐319. [DOI] [PMC free article] [PubMed] [Google Scholar]
- 31. Straub M, Drecoll E, Pfarr N, et al. CD274/PD‐L1 gene amplification and PD‐L1 protein expression are common events in squamous cell carcinoma of the oral cavity. Oncotarget. 2016;7(11):12024‐12034. [DOI] [PMC free article] [PubMed] [Google Scholar]
Associated Data
This section collects any data citations, data availability statements, or supplementary materials included in this article.
Supplementary Materials


