The global emergence of plasmid-mediated colistin resistance genes mcr-1 and mcr-3 has threatened the role of the “last-resort” drug colistin in the defense against infections caused by multidrug-resistant Gram-negative bacteria. However, functional differences between these two genes in mediating colistin resistance remain poorly understood.
KEYWORDS: mcr-3, mcr-1, colistin resistance, homology modeling, phosphatidylethanolamine
ABSTRACT
The global emergence of plasmid-mediated colistin resistance genes mcr-1 and mcr-3 has threatened the role of the “last-resort” drug colistin in the defense against infections caused by multidrug-resistant Gram-negative bacteria. However, functional differences between these two genes in mediating colistin resistance remain poorly understood. Protein sequence alignment of MCR-3 and MCR-1 was therefore conducted in Clustal Omega to identify sequence divergence. The molecular recognition of lipid A head group phosphatidylethanolamine and MCR-3 enzyme was studied by homology modeling and molecular docking, with the catalytic mechanism of MCR-3 also being explored. Thr277 in MCR-3 was validated as the key amino acid residue responsible for the catalytic reaction using site-directed mutagenesis and was shown to act as a nucleophile. Lipid A modification induced by the MCR-3 and MCR-1 enzymes was confirmed by electrospray ionization–time of flight mass spectrometry. Far-UV circular dichroism spectra of the MCR-3 and MCR-1 enzymes suggested that MCR-3 was more thermostable than MCR-1, with a melting temperature of 66.19°C compared with 61.14°C for MCR-1. These data provided molecular insight into the functional differences between mcr-3 and mcr-1 in conferring colistin resistance.
INTRODUCTION
The emergence of multidrug-resistant Gram-negative pathogenic bacteria represents one of the greatest global public health threats to date (1). Colistin is considered the last line of defense against many of these clinical multidrug-resistant microorganisms (2, 3). The antibacterial activity of colistin occurs as a result of an electrostatic interaction between the α,γ-diaminobutyric acid residue of the positively charged colistin and the phosphate groups of the negatively charged lipid A membrane. This destabilizes the lipopolysaccharide, consequently increasing the permeability of the bacterial membrane. The colistin molecule can then insert itself into the bacterial cell (2, 4). Modification of lipid A at the 1′ and 4′ head group positions with phosphoethanolamine (PEA) or 4-amino-arabinose masks the negatively charged phosphate groups on the bacterial surface, thereby preventing the interaction with cationic antimicrobial peptides such as colistin and polymyxin B (5). Plasmid-mediated mobilized colistin resistance (MCR) enzymes, encoded by mcr-1 to mcr-5 (6–10), are members of the PEA transferase family of proteins that decorate the lipid A head groups of lipopolysaccharide with PEA, thereby conferring colistin resistance.
Recently, we described a new transferable plasmid-borne colistin resistance gene, mcr-3, in an Escherichia coli isolate from pig feces (7). Subsequent epidemiological studies have shown that, similar to mcr-1, mcr-3 is widespread among various species of Enterobacteriaceae and Aeromonas (11–14). Considering the spread and prevalence of these two genes and their potential harm with regard to drug-resistant bacterial infections (15–17), this study aimed to provide molecular insights into the functional differences between mcr-3 and mcr-1. Furthermore, the molecular mechanism underlying substrate binding by mcr-3 remains to be elucidated, and there is virtually no research deciphering its role in mediating colistin resistance. To address these issues, we carried out homology modeling and examined the molecular docking of MCR-3 with the substrate, l-α-phosphatidylethanolamine (l-αPEA), from E. coli. Identifying the catalytic mechanism and possible binding sites would aid in subsequent characterization of their biological characteristics. We also expressed and purified MCR-1 and MCR-3 and determined the thermal stability and secondary structure of these two lipid A PEA transferases. These functional comparisons showed that MCR-3 was more thermostable than MCR-1.
RESULTS AND DISCUSSION
Lipid A modification mediated by mcr-3 and mcr-1 confirmed by ESI-QTOF/MS.
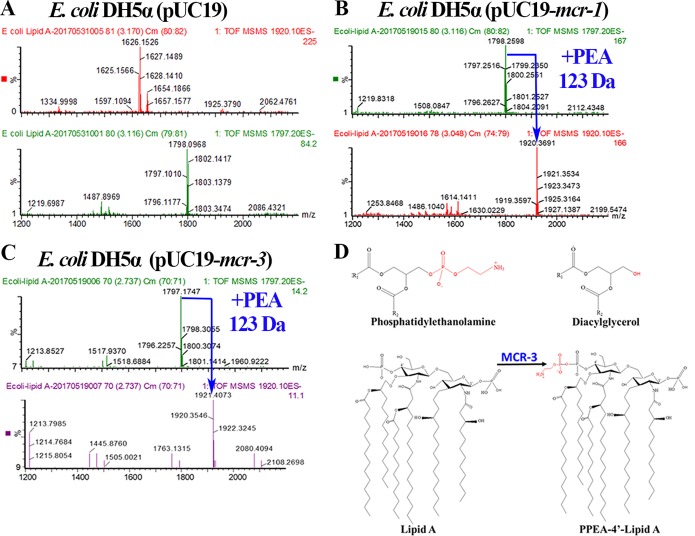
mcr-3 and mcr-1 encode PEA transferases that mediate colistin resistance in a variety of bacterial species, including E. coli, Aeromonas veronii, Salmonella enterica serovar Typhimurium, Klebsiella pneumoniae, and Citrobacter freundii (12–14). In this study, lipid A was extracted from recombinant E. coli strains W3110(pUC19-mcr-3), W3110(pUC19-mcr-1), and W3110(pUC19), and the lipid spectra were analyzed by electrospray ionization–quadrupole time of flight mass spectrometry (ESI-QTOF/MS). ESI-MS/MS spectra showed that lipid A from E. coli W3110(pUC19) had a prominent peak at m/z 1,797.10 (Fig. 1A). Upon the addition of a PEA molecule (123 Da) to the bis-phosphorylated hexa-acylated lipid A in both E. coli W3110(pUC19-mcr-1) and W3110(pUC19-mcr-3), the peak shifted to m/z 1,920 (i.e., 1,797 + 123) (Fig. 1B and C). Previous research has shown that MCR-1 can transfer PEA from phosphatidylethanolamine to the negatively charged phosphate groups of lipid A, resulting in decreased affinity for colistin (18, 19). The proposed lipid A modification catalyzed by MCR-3 is shown in Fig. 1D. Thus, we confirmed that MCR-3, like MCR-1, could modify lipid A on the bacterial cell membrane, thereby mediating colistin resistance.
FIG 1.
ESI-QTOF/MS analysis showing the PEA modification of bacterial lipid A mediated by MCR-3 and MCR-1. (A) ESI-QTOF/MS spectrum of the negative ion of lipid A extracted from the recombinant control strain E. coli W3110(pUC19). Lipid A had a prominent peak at m/z 1,797.10 but no peak at m/z 1,920, indicating no PEA modification. (B) ESI-QTOF/MS spectrum of the negative ion of lipid A extracted from the recombinant positive-control strain E. coli W3110(pUC19-mcr-1). A PEA molecule (123 Da) was added to the bisphosphorylated hexa-acylated lipid A (m/z = 1,920; i.e., 1,797 + 123). (C) ESI-QTOF/MS spectrum of lipid A extracted from the recombinant strain E. coli W3110(pUC19-mcr-3). The peak observed at m/z 1,920 was consistent with the addition of a single PEA group (123 Da) to ions represented by the prominent peak at m/z 1,797.2, corresponding to dephosphorylated lipid A. (D) Reaction catalyzed by MCR-3.
Comparison of the models of full-length MCR-3 and MCR-1.
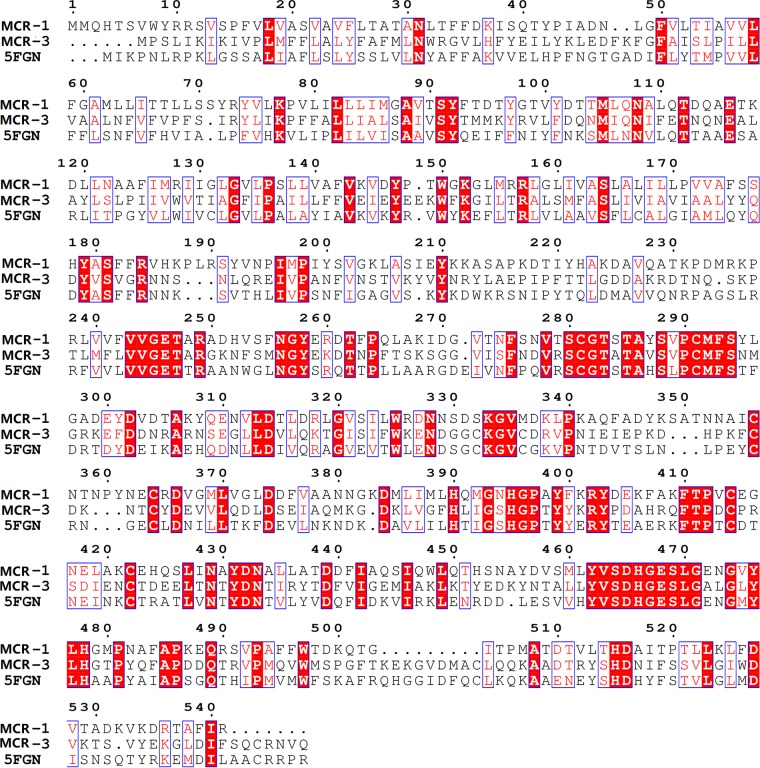
Four proteins, EptA (PDB 5FGN), LptA (PDB 4KAY and 4KAV), and MCR-1 (PDB 5K4P), were aligned to select a template for homology modeling. In general, protein crystals with higher total scores or E values of less than 1e−5 can be considered for use as templates. Both the Swiss-Model workspace and the Modweb server automatically selected full-length EptA as the template for homology modeling and returned similar modeling results (Table 1 and Fig. 2). Template 5FGN had the highest score with the target sequence, with a sequence identity of 39%. Templates 4KAY and 4KAV reached 44% sequence identity, but the sequence coverage was only 60% (Table 1), indicating that they were missing part of the structure and were not suitable as templates for building a complete protein model. 5K4P showed only 35% sequence identity with MCR-3.
TABLE 1.
Multiple-sequence alignment results of the selected homology templates for MCR-3
FIG 2.
Multiple-sequence alignment of MCR-3, MCR-1, and EptA conducted using Clustal Omega (http://www.ebi.ac.uk/Tools/msa/clustalo/).
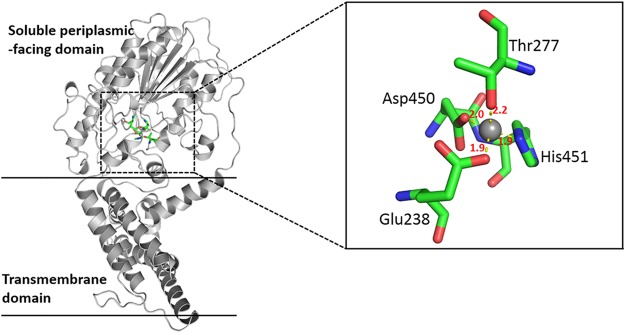
The structure of MCR-3 was composed of two folded domains: an N-terminal transmembrane (TM) domain and a C-terminal catalytic domain. The TM domain consisted of five membrane-spanning α-helices (residues 1 to 212) connected to the catalytic domain via a bridging helix (Fig. 3). There were multiple lysine and histidine residues on the membrane surface, and these basic amino acids could improve the stability of MCR-3 on the membrane to a certain extent. The soluble cytoplasmic domain had a structure similar to that of the hydrolase active site (5). The Zn2+ ions bound to the active site and formed tetrahedral coordination structures with Glu238, Thr277, Asp450, and His451, with distances of 1.9, 2.2, 2.0, and 1.9 Å, respectively. Thr277 was the key amino acid responsible for the catalytic reaction, acting as a nucleophile. In addition, disulfide bonds formed by five pairs of cysteines were distributed in this region, which stabilized the structure of the region as a whole. Furthermore, conserved residue Thr285 in the MCR-1 catalytic domain structure is believed to act as the acceptor for the PEA group during the transfer reaction (20–22). MCR-1 transfers PEA to lipid A, which is located in the nearby pocket consisting of Thr283, Ser284, Tyr287, Pro481, and Asn482 (23). It was demonstrated that a threonine residue (Thr285 for MCR-1 and Thr277 for MCR-3) in the catalytic domain played an important role in mediating colistin resistance. The rationality of the MCR-3 protein homology modeling and the structural integrity of the catalytic active center proved the reliability of the structure and could be used for subsequent molecular docking analyses to explore the catalytic mechanism of MCR-3.
FIG 3.
Three-dimensional structure of MCR-3 generated by homology modeling. The protein is shown as a gray strip model. The catalytic residues are shown as a stick model, and Zn2+ ions are shown by a gray sphere. The numbers in red indicate the distances between coordination bonds (in ångströms).
Catalytic reaction mechanism of MCR-3 deciphered by molecular docking.
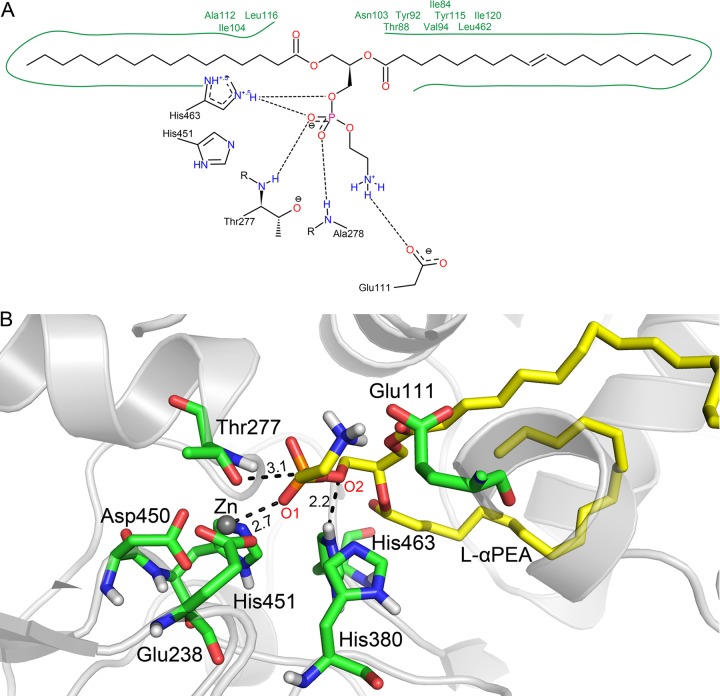
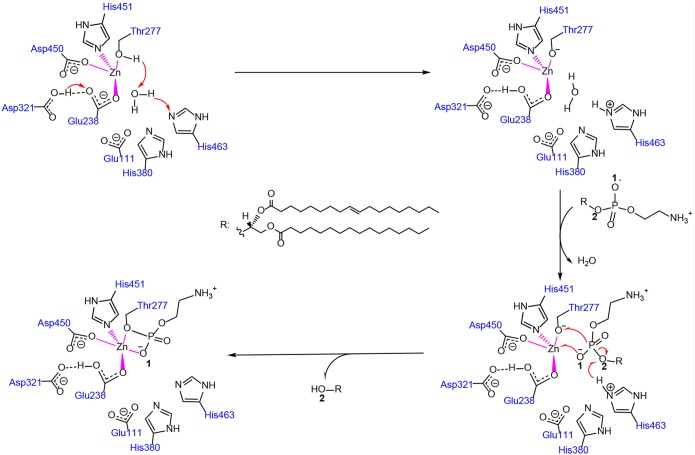
Prior to the catalytic transfer of PEA by MCR-3, the side chain hydroxyls of the catalytically active Thr277 lose their hydrogen protons, forming oxyanions by nucleophilic attack. In the MCR-3 model, the amino acid residues Glu111, His380, and His463 could receive the hydrogen proton in the vicinity of the catalytic center. The distances between the oxygen of Thr277 and the three residues were 5.3, 5.4, and 5.1 Å, respectively. It would be difficult to directly transfer the proton from these spatial distances. However, there was a water molecule between these three amino acids, which was not present in the catalytic center of the general template crystal structure of EptA. The hydrogen protons of Thr277 are therefore likely to be transferred by the water molecule to the three residues. The results of molecular docking analysis showed that PEA could bind to the catalytically active cavity of MCR-3, with a binding energy of −7.1 kcal/mol. The main driving power of PEA binding was the “head” hydrogen and the “tail” hydrophobicity (Fig. 4). The PEA moiety at the head of l-αPEA formed a hydrogen bond network with Glu111, Thr277, Ala278, His451, and His463. These hydrogen bonds would stabilize the PEA head in the catalytic center of the MCR-3 enzyme, which would be favorable for the subsequent catalytic reaction. The alkyl chain at the terminus of l-αPEA extended into the transmembrane region of the MCR-3 protein and formed strong hydrophobic bonds with the Ile84, Thr88, Val94, Asn103, Ile104, Ala112, Tyr115, Leu116, Ile120, and Leu462 residues. This hydrophobic interaction would enhance the stable binding of the PEA substrate to the active cavity of the MCR-3 enzyme.
FIG 4.
Schematic showing the interaction between l-αPEA and the amino acids around the active site of MCR-3. (A) Hydrophobic residues are indicated by the green solid line and green residue labels, while the black dashed line represents the hydrogen bond. (B) Three-dimensional model of the binding between l-αPEA and the MCR-3 active site. The protein is shown in gray, with interacting residues shown as a green stick model, l-αPEA as a yellow stick model, and zinc ions in gray spheres, with black dotted lines indicating the interactions and distances between the l-αPEA and MCR-3 molecules.
We further analyzed the binding conformations and found that the distance between the O-1 of the l-αPEA molecule and Zn2+ in the catalytic center was 2.7 Å, while the distance between the P atom of the phosphoric acid group and the O atom of the Thr277 hydroxyl was 3.1 Å. This finding demonstrated that the two pairs of atoms might be separated by the electrostatic interactions of the O-1-Zn and P-O covalent bonds, respectively. It was also noteworthy that the O-2 of the terminal alkyl side chain in l-αPEA formed a hydrogen bond with His463 at a distance of 2.2 Å, indicating that hydrogen protons on His463 might be transferred to the O-2 of l-αPEA. The P-O-2 bond then broke to form a product. We concluded that the hydrogen proton of Thr277 was likely to be transferred to the His463 residue via a water molecule. The protonated His463 could then provide hydrogen protons to the alkyl chains at the ends of l-αPEA to complete the entire catalysis reaction.
Next, we speculated on the possible mechanism of the MCR-3-catalyzed reaction (Fig. 5). The reaction was divided into two main steps. (i) The hydrogen protons on the catalytically active Thr277 side chain hydroxyls in MCR-3 were transferred to the nitrogen of the His466 residue side chains via water molecules. Thr277 was further activated to become a nucleophilic attacking group, and the protonated His463 residue was subsequently involved in the reaction as a hydrogen proton donor. (ii) At the same time, the carboxylate of Glu238 would attract the carboxyl hydrogen proton of Asp321 to Glu238, leaving the catalytic center electrically neutral. During l-αPEA binding to the catalytically active site, the O-1 of the phosphate group coordinates with Zn to form a coordinate covalent bond. P forms a covalent bond with the hydroxyl oxygen of Thr277, and the covalently linked bonds between the O-2 in the terminal alkyl side chain and P are broken, forming the Thr-PEA complexes. The Thr-PEA complex is a positively charged group, which would result in a decrease in the negative charge of the bacterial outer membrane, reducing the absorbance capacity of the bacterium for positively charged colistin, which in turn leads to bacterial resistance to colistin.
FIG 5.
Proposed reaction mechanism of l-αPEA catalyzed by MCR-3.
Mutation of Thr277 decreases MCR-3 function.
As Thr277 was considered to be the key amino acid responsible for the catalytic reaction, mutation of this amino acid would be expected to decrease the functional abilities of MCR-3. To test this hypothesis, we constructed two strains carrying plasmid pUC19-mcr-3, containing mutations within MCR-3 (Thr277Ala and Thr277Ser). We then measured the MICs of colistin and polymyxin for these strains in comparison with that for the wild type. The MIC of colistin for the strain containing pUC19-mcr-3 was 4.0 μg/ml, compared with 0.5 μg/ml for the control strain containing empty plasmid (pUC19). The strain containing a Thr277Ala substitution in MCR-3 had a colistin MIC similar to that of the control (0.5 to 1 μg/ml) (Table 2), while the Thr277Ser mutation resulted in a 4-fold decrease in the MICs of colistin and polymyxin compared with those for E. coli strain DH5α(pUC19-mcr-3) (Table 2). Taken together, these results of site-directed mutagenesis verified the importance of the Thr277 residue to the catalytic activity of lipid A.
TABLE 2.
MIC values for colistin and polymyxin against E. coli strain DH5α carrying the wild-type mcr-3 gene or either of the two mutation variants (Thr277Ala and Thr277Ser)
| E. coli strain | MIC (μg/ml) |
|
|---|---|---|
| Colistin | Polymyxin | |
| DH5α | 0.5 | 0.5 |
| DH5α(pUC19) | 0.5 | 0.5 |
| DH5α(pUC19-mcr-3) | 4 | 4 |
| DH5α(pUC19-mcr-3) (Thr277Ala) | 0.5 | 0.5 |
| DH5α(pUC19-mcr-3) (Thr277Ser) | 1 | 1 |
MCR-3 shows greater thermostability than MCR-1.
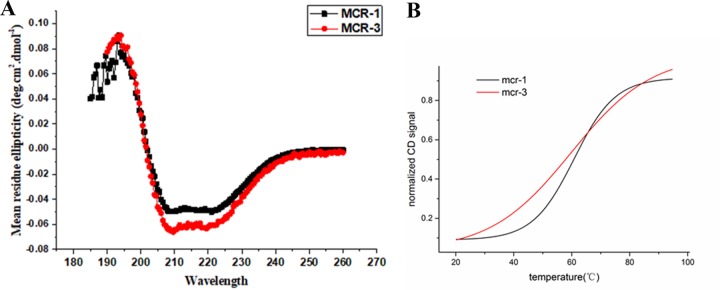
In the absence of high-resolution structures, circular dichroism (CD) is the method of choice for providing secondary structural information for proteins in solution (24). To explore the resistance mechanism of the novel MCR-3 protein and compare its structure and function with those of MCR-1, we expressed and purified the full-length MCR-3 protein. Characterization of the secondary structures of MCR-1 and MCR-3 was then achieved using CD spectra. The normalized CD spectra of MCR-1 and MCR-3 from 185 to 260 nm are shown in Fig. 6A. MCR-3 and MCR-1 were well-folded, structured proteins and presented similar structural properties with regard to α-helical and β-sheet content from the deconvolution. We also compared the thermal stability of MCR-3 and MCR-1 using temperature-dependent CD. As a result, melting temperatures (Tm) of approximately 66.19°C and 61.14°C were obtained for MCR-3 and MCR-1, respectively. The CD results showed clear differences in the thermal stabilities of the two proteins (Fig. 6B) and revealed that MCR-3 was more thermostable than MCR-1 (P < 0.05). The differences in stability with respect to thermal denaturation, with a >5°C difference in melting temperature, implied that the catalytic properties of the two proteins in mediating bacterial resistance might differ. Therefore, further investigation should focus on the association of thermodynamic stability and enzymatic function of different MCR proteins.
FIG 6.
Secondary-structure characterization of MCR-1 and MCR-3 by CD analysis. (A) Normalized CD spectra of MCR-1 and MCR-3. Data were obtained at 20°C using 10 mM phosphate buffer, with a protein concentration of ∼2.5 μM. (B) Thermal stability melting curves. Melting temperatures of MCR-1 and MCR-3 as determined by CD: MCR-1, 61.14°C; MCR-3, 66.19°C.
MATERIALS AND METHODS
Strain and plasmid construction.
mcr-3 was cloned from the genomic DNA of E. coli plasmid pWJ1 by PCR using forward (5′-GGGAATTCCATATGATGCCTTCCCTTATAAAAAT-3′) and reverse (5′-AAGGAAAAAAGCGGCCGCTTATTGAACATTACGACATTGAC-3′) primers incorporating NdeI and NotI restriction sites at the N and C termini of the coding region, respectively. The resulting PCR products were digested with the corresponding restriction enzymes and ligated into expression vector pET28a, generating pET28a-mcr-3. mcr-1 was then PCR amplified from E. coli strain SHP45 genomic DNA using forward (5′-CATGCCATGGTGATGATGCAGCATACTTCTGTGTGGTACCGACG-3′) and reverse (5′-CAAAGACCGCACCGCATTCATCCGCCTCGAGCGG-3′) primers and cloned into plasmid pET28a to generate a high-copy expression vector with an N-terminal hexahistidine tag (pET28a-mcr-1). The resulting recombinant MCR-3 and MCR-1 proteins contained a tobacco etch virus protease cleavage site followed by a 6×His tag at the N terminus. The calculated molecular masses of both the recombinant and cleaved monomeric MCR-3 and MCR-1 proteins were ∼60 kDa.
Expression and purification of full-length MCR-3 and MCR-1.
For overexpression analyses, pET28a-mcr-3 and pET28a-mcr-1 were individually transformed into E. coli BL21(DE3) pLysS chemically competent cells. The transformants were then cultured in Luria Bertani (LB) medium supplemented with 50 μg/ml kanamycin at 37°C with shaking for 3 to 4 h or to an optical density at 600 nm (OD600) of 0.5 to 0.6. Protein expression was induced by the addition of 0.4 mM isopropyl-β-d-thiogalactopyranoside and incubation at 18°C for a further 20 h. Cells were harvested by centrifugation at 10,000 × g for 10 min at 4°C and then resuspended in lysis buffer (50 mM sodium phosphate buffer, pH 8.0, containing 300 mM sodium chloride and 10 mM imidazole). Cell debris was removed by centrifugation at 12,000 × g for 20 min at 4°C, and membranes were collected by further ultracentrifugation of the supernatant at 100,000 × g for 1 h at 4°C using an ultracentrifuge (Optima XE-100; Beckman Coulter, Brea, CA, USA). The resulting pellet was homogenized in phosphate-buffered saline containing 1% n-dodecyl-β-d-maltoside (DDM) and solubilized for 2 h at 4°C on a rotational shaker at 50 rpm.
To purify the full-length MCR-1 and MCR-3, protein-containing supernatant was applied to a nickel-nitrilotriacetic acid (Ni-NTA) Superflow resin column (Qiagen, Hilden, Germany) equilibrated with binding buffer (50 mM sodium phosphate, pH 7.5, 300 mM NaCl, 10 mM imidazole). The unbound protein was washed from the column using washing buffer (50 mM sodium phosphate, pH 7.5, 300 mM NaCl, 20 mM imidazole), and the bound protein was eluted from the column using elution buffer (50 mM sodium phosphate, pH 7.5, 300 mM NaCl, 200 mM imidazole, 0.05% [wt/vol] DDM). The eluent fractions were pooled and concentrated using a Vivaspin 20 centrifugal concentrator (molecular weight cutoff [MWCO], 10,000; Sartorius, Göttingen, Germany) to a final concentration of 5 to 10 mg/ml, as determined by the absorbance at 280 nm using a NanoDrop 2000c spectrophotometer.
Isolation and mass spectrometry of lipid A.
The construction of E. coli strains W3110(pUC19), W3110(pUC19-mcr-3), and W3110(pUC19-mcr-1) was described in our previous research (6, 7). Bacterial cultures (200 ml) were incubated overnight in LB broth at 37°C, and then cells were harvested by centrifugation at 10,000 × g for 10 min. Lipid A was isolated by mild acidic hydrolysis according to the method described previously by Hankins et al. (25). Lipid A was analyzed using electrospray ionization–quadrupole time of flight mass spectrometry (ESI-QTOF/MS) (Waters Synapt HR-MS, Milford, USA) in the negative-ion mode. The ESI-QTOF/MS settings were as follows: capillary voltage, 3.0 kV; sampling cone voltage, 30 V; source temperature, 100°C; desolvation temperature, 500°C; and desolvation gas (N2), 600 liters/h.
Circular dichroism spectroscopy.
The far-UV spectra of MCR-1 and MCR-3 were measured at 20°C on a CD spectrophotometer (Jasco J-810; Jasco, Tokyo, Japan) using a 1-mm-path-length quartz cuvette. The protein sample was diluted to a concentration of 0.2 mg/ml in 5 mM sodium phosphate (pH 7.0). CD data were collected every 1 nm using a 1-nm bandwidth in the 185- to 260-nm wavelength region using an integration time of 1 s per step. Temperature-dependent CD analysis was carried out at 220 nm with a temperature range of 10 to 90°C and at a rate of 1°C/min to determine the melting temperature (Tm). The resulting spectra represented the averages for three accumulations and were buffer baseline corrected with the signal-to-noise ratio improved using the Savitzky-Golay method with a minimum convolution width of 5 data points. Analysis was conducted using Spectra Analysis software (version 1.53.07 for Windows 95/NT; Jasco Corp., Tokyo, Japan).
Molecular docking.
To provide an overview of full-length MCR-3, structural modeling was performed using two approaches: the Swiss-Model workspace and the Modweb server (26, 27). Sequence alignment of MCR-1, MCR-3, and EptA was conducted using Clustal Omega (http://www.ebi.ac.uk/Tools/msa/clustalo/). The crystal structure of EptA (PDB ID 5FGN) was used for modeling by comparing the E value and the structure total score. The EptA structure was embedded into l-αPEA from E. coli using the Swiss-Model automated homology-modeling server (https://swissmodel.expasy.org/). Procheck and Errat were used to evaluate the optimized model protein structure. A Ramachandran plot was used to illustrate the degree of rotation of the bonds between the α-carbon atoms and the carbonyl carbon atoms of the peptide bond in a peptide or peptide structure of a protein. The degree of rotation of the bond between the α-carbon atom and the nitrogen atom was mainly used to indicate permitted and impermissible conformations of amino acid residues. The structure of the protein after modeling was studied to further discuss the rationality of the model and analyze the catalytic structure of MCR-3.
The interaction between the ligand and the MCR-3 protein structure, determined by homology modeling, was investigated using AutoDock Tools 1.5.6, which generated the pdbqt files used for molecular docking analysis. Molecular docking was completed using the MolDesigner molecular simulation platform of AutoDock Vina (28). If the molecular docking results produced unreasonable atomic contacts in the spatial structure, energy-optimized methods were used to release these forces to stabilize the structure.
Construction of mcr-3 site-directed mutants.
To test the role of Thr277 in MCR-3, two different substitution-inducing mutations (Thr277Ala and Thr277Ser) were introduced into mcr-3 in pUC19-mcr-3 using a QuikChange Lightning site-directed mutagenesis kit (Agilent Technologies, Santa Clara, CA, USA) as per the manufacturer's protocol using primers Thr277Ala-F (5′-TCGTGTGGGACTGCAGCCGCTGTATCCGTCCCC-3′) and Thr277Ala-R (5′-GGGGACGGATACAGCGGCTGCAGTCCCACACGA-3′) and primers Thr277Ser-F (5′-TCGTGTGGGACTGCAAGCGCTGTATCCGTCCCC-3′) and Thr277Ser-R (5′-GGGGACGGATACAGCGCTTGCAGTCCCACACGA-3′), respectively. These primers introduced an ACC (coding for threonine) to GCC (coding for alanine) or AGC (coding for serine) mutation at residue 277 of MCR-3. Recombinant plasmids containing wild-type mcr-3 or each of the two mutations (Thr277Ala and Thr277Ser) were then transformed into host E. coli strain DH5α. Sequencing of the complete mcr-3 genes from each of the transformants was conducted to ensure that no extraneous mutations occurred. MICs of colistin and polymyxin for E. coli DH5α, DH5α(pUC19), DH5α(pUC19-mcr-3), and each of the site-directed mutants were measured by the broth microdilution method according to the Clinical and Laboratory Standards Institute guidelines (29).
ACKNOWLEDGMENTS
This work was supported by the National Natural Science Foundation of China (grant no. 31602107 and 81661138002), Capital's Funds for Health Improvement and Research (grant no. 2018-4-3017), and Medical Research Council grant DETER-XDR-CHINA (MR/P007295/1).
We declare that we have no conflicts of interest.
REFERENCES
- 1.Nation RL, Li J. 2009. Colistin in the 21st century. Curr Opin Infect Dis 22:535–543. doi: 10.1097/QCO.0b013e328332e672. [DOI] [PMC free article] [PubMed] [Google Scholar]
- 2.Trimble MJ, Mlynárčik P, Koláø M, Hancock REW. 2016. Polymyxin: alternative mechanisms of action and resistance. Cold Spring Harb Perspect Med 6:a025288. doi: 10.1101/cshperspect.a025288. [DOI] [PMC free article] [PubMed] [Google Scholar]
- 3.Landman D, Georgescu C, Martin DA, Quale J. 2008. Polymyxins revisited. Clin Microbiol Rev 21:449–465. doi: 10.1128/CMR.00006-08. [DOI] [PMC free article] [PubMed] [Google Scholar]
- 4.Poire L, Jayol A, Nordmann P. 2017. Polymyxins: antibacterial activity, susceptibility testing, and resistance mechanisms encoded by plasmids or chromosomes. Clin Microbiol Rev 30:557–596. doi: 10.1128/CMR.00064-16. [DOI] [PMC free article] [PubMed] [Google Scholar]
- 5.Anandan A, Evans GL, Condic-Jurkic K, O'Mara ML, John CM, Phillips NJ, Jarvis GA, Wills SS, Stubbs KA, Moraes I, Kahler CM, Vrielink A. 2017. Structure of a lipid A phosphoethanolamine transferase suggests how conformational changes govern substrate binding. Proc Natl Acad Sci U S A 114:2218–2223. doi: 10.1073/pnas.1612927114. [DOI] [PMC free article] [PubMed] [Google Scholar]
- 6.Liu Y-Y, Wang Y, Walsh TR, Yi L-X, Zhang R, Spencer J, Doi Y, Tian G, Dong B, Huang X, Yu L-F, Gu D, Ren H, Chen X, Lv L, He D, Zhou H, Liang Z, Liu J-H, Shen J. 2016. Emergence of plasmid-mediated colistin resistance mechanism MCR-1 in animals and human beings in China: a microbiological and molecular biological study. Lancet Infect Dis 16:161–168. doi: 10.1016/S1473-3099(15)00424-7. [DOI] [PubMed] [Google Scholar]
- 7.Yin W, Li H, Shen Y, Liu Z, Wang S, Shen Z, Zhang R, Walsh TR, Shen J, Wang Y. 2017. Novel plasmid-mediated colistin resistance gene mcr-3 in Escherichia coli. mBio 8:e00543-17. doi: 10.1128/mBio.00543-17. [DOI] [PMC free article] [PubMed] [Google Scholar]
- 8.Xavier BB, Lammens C, Ruhal R, Kumar-Singh S, Butaye P, Goossens H, Malhotra-Kumar S. 2016. Identification of a novel plasmid-mediated colistin-resistance gene, mcr-2, in Escherichia coli, Belgium, June 2016. Euro Surveill 21:1–6. https://www.eurosurveillance.org/images/dynamic/EE/V21N27/art22525.pdf. [DOI] [PubMed] [Google Scholar]
- 9.Borowiak M, Fischer J, Hammerl JA, Hendriksen RS, Szabo I, Malorny B. 2017. Identification of a novel transposon-associated phosphoethanolamine transferase gene, mcr-5, conferring colistin resistance in d-tartrate fermenting Salmonella enterica subsp enterica serovar Paratyphi B. J Antimicrob Chemother 72:3317–3324. doi: 10.1093/jac/dkx327. [DOI] [PubMed] [Google Scholar]
- 10.Carattoli A, Villa L, Feudi C, Curcio L, Orsini S, Luppi A, Pezzotti G, Magistrali CF. 2017. Novel plasmid-mediated colistin resistance mcr-4 gene in Salmonella and Escherichia coli, Italy 2013, Spain and Belgium, 2015 to 2016. Euro Surveill 22:30589 https://www.eurosurveillance.org/content/10.2807/1560-7917.ES.2017.22.31.30589. [DOI] [PMC free article] [PubMed] [Google Scholar]
- 11.Litrup E, Kiil K, Hammerum AM, Roer L, Nielsen EM, Torpdahl M. 2017. Plasmid-borne colistin resistance gene mcr-3 in Salmonella isolates from human infections, Denmark, 2009-17. Euro Surveill 22:30587 https://www.eurosurveillance.org/content/10.2807/1560-7917.ES.2017.22.31.30587. [DOI] [PMC free article] [PubMed] [Google Scholar]
- 12.Ling Z, Yin W, Li H, Zhang Q, Wang X, Wang Z, Ke Y, Wang Y, Shen J. 2017. Chromosome-mediated mcr-3 variants in Aeromonas veronii from chicken meat. Antimicrob Agents Chemother 61:e01272-17. doi: 10.1128/AAC.01272-17. [DOI] [PMC free article] [PubMed] [Google Scholar]
- 13.Liu L, Feng Y, Zhang X, McNally A, Zong Z. 2017. A new variant of mcr-3 in an extensively drug-resistant Escherichia coli clinical isolate carrying mcr-1 and blaNDM-5. Antimicrob Agents Chemother 61:e01757-17. doi: 10.1128/AAC.01757-17. [DOI] [PMC free article] [PubMed] [Google Scholar]
- 14.Roer L, Hansen F, Stegger M, Sonksen UW, Hasman H, Hammerum AM. 2017. Novel mcr-3 variant, encoding mobile colistin resistance, in an ST131 Escherichia coli isolate from bloodstream infection, Denmark, 2014. Euro Surveill 22:30584 https://www.eurosurveillance.org/content/10.2807/1560-7917.ES.2017.22.31.30584. [DOI] [PubMed] [Google Scholar]
- 15.Wang R, van Dorp L, Shaw LP, Bradley P, Wang Q, Wang X, Jin L, Zhang Q, Liu Y, Rieux A, Dorai-Schneiders T, Weinert LA, Iqbal Z, Didelot X, Wang H, Balloux F. 2018. The global distribution and spread of the mobilized colistin resistance gene mcr-1. Nat Commun 9:1179. doi: 10.1038/s41467-018-03205-z. [DOI] [PMC free article] [PubMed] [Google Scholar]
- 16.Zhang J, Chen L, Wang J, Butaye P, Huang K, Qiu H, Zhang X, Gong W, Wang C. 2018. Molecular detection of colistin resistance genes (mcr-1 to mcr-5) in human vaginal swabs. BMC Res Notes 11:143. doi: 10.1186/s13104-018-3255-3. [DOI] [PMC free article] [PubMed] [Google Scholar]
- 17.Del Bianco F, Morotti M, Pedna MF, Farabegoli P, Sambri V. 2018. Microbiological surveillance of plasmid mediated colistin resistance in human Enterobacteriaceae isolates in Romagna (Northern Italy): August 2016–July 2017. Int J Infect Dis 69:96–98. doi: 10.1016/j.ijid.2018.02.006. [DOI] [PubMed] [Google Scholar]
- 18.Gao R, Hu Y, Li Z, Sun J, Wang Q, Lin J, Ye H, Liu F, Srinivas S, Li D, Zhu B, Liu YH, Tian GB, Feng Y. 2016. Dissemination and mechanism for the MCR-1 colistin resistance. PLoS Pathog 12:e1005957. doi: 10.1371/journal.ppat.1005957. [DOI] [PMC free article] [PubMed] [Google Scholar]
- 19.Kelesidis T, Falagas ME. 2015. The safety of polymyxin antibiotics. Expert Opin Drug Saf 14:1687–1701. doi: 10.1517/14740338.2015.1088520. [DOI] [PMC free article] [PubMed] [Google Scholar]
- 20.Hinchliffe P, Yang QE, Portal E, Young T, Li H, Tooke CL, Carvalho MJ, Paterson NG, Brem J, Niumsup PR, Tansawai U, Lei L, Li M, Shen Z, Wang Y, Schofield CJ, Mulholland AJ, Shen J, Fey N, Walsh TR, Spencer J. 2017. Insights into the mechanistic basis of plasmid-mediated colistin resistance from crystal structures of the catalytic domain of MCR-1. Sci Rep 7:39392–39401. doi: 10.1038/srep39392. [DOI] [PMC free article] [PubMed] [Google Scholar]
- 21.Stojanoski V, Sankaran B, Prasad BV, Poirel L, Nordmann P, Palzkill T. 2016. Structure of the catalytic domain of the colistin resistance enzyme MCR-1. BMC Biol 14:81–90. doi: 10.1186/s12915-016-0303-0. [DOI] [PMC free article] [PubMed] [Google Scholar]
- 22.Ma G, Zhu Y, Yu Z, Ahmad A, Zhang H. 2016. High resolution crystal structure of the catalytic domain of MCR-1. Sci Rep 6:39540. doi: 10.1038/srep39540. [DOI] [PMC free article] [PubMed] [Google Scholar]
- 23.Wei P, Song G, Shi M, Zhou Y, Liu Y, Lei J, Chen P, Yin L. 2018. Substrate analog interaction with MCR-1 offers insight into the rising threat of the plasmid-mediated transferable colistin resistance. FASEB J 32:1–18. doi: 10.1096/fj.180101ufm. [DOI] [PubMed] [Google Scholar]
- 24.Micsonai A, Wien F, Kernya L, Lee YH, Goto Y, Refregiers M, Kardos J. 2015. Accurate secondary structure prediction and fold recognition for circular dichroism spectroscopy. Proc Natl Acad Sci U S A 112:E3095–E3103. doi: 10.1073/pnas.1500851112. [DOI] [PMC free article] [PubMed] [Google Scholar]
- 25.Hankins JV, Madsen JA, Needham BD, Brodbelt JS, Trent MS. 2013. The outer membrane of Gram-negative bacteria: lipid A isolation and characterization. Methods Mol Biol 966:239–258. doi: 10.1007/978-1-62703-245-2_15. [DOI] [PMC free article] [PubMed] [Google Scholar]
- 26.Biasini M, Bienert S, Waterhouse A, Arnold K, Studer G, Schmidt T, Kiefer F, Gallo Cassarino T, Bertoni M, Bordoli L, Schwede T. 2014. SWISS-MODEL: modelling protein tertiary and quaternary structure using evolutionary information. Nucleic Acids Res 42:W252–W258. doi: 10.1093/nar/gku340. [DOI] [PMC free article] [PubMed] [Google Scholar]
- 27.Eswar N. 2003. Tools for comparative protein structure modeling and analysis. Nucleic Acids Res 31:3375–3380. doi: 10.1093/nar/gkg543. [DOI] [PMC free article] [PubMed] [Google Scholar]
- 28.Trott O, Olson AJ. 2010. AutoDock Vina: improving the speed and accuracy of docking with a new scoring function, efficient optimization, and multithreading. J Comput Chem 31:455–461. doi: 10.1002/jcc.21334. [DOI] [PMC free article] [PubMed] [Google Scholar]
- 29.Clinical and Laboratory Standards Institute. 2015. Performance standards for antimicrobial disk and dilution susceptibility tests for Bacteria isolated from animals: approved standard M31-A3. VET01S, 3rd ed, 128 Clinical and Laboratory Standards Institute, Wayne, PA. [Google Scholar]


