Resistance rates for ciprofloxacin, which is labeled for treating complicated urinary tract infections in children, are rapidly rising. As there is limited knowledge on developmental pharmacology of ciprofloxacin, the primary aim of this study was to develop a population pharmacokinetic model for ciprofloxacin in children treated for complicated urinary tract infections.
KEYWORDS: ciprofloxacin, Pseudomonas aeruginosa, pediatric pharmacology, population pharmacokinetics, urinary tract infection
ABSTRACT
Resistance rates for ciprofloxacin, which is labeled for treating complicated urinary tract infections in children, are rapidly rising. As there is limited knowledge on developmental pharmacology of ciprofloxacin, the primary aim of this study was to develop a population pharmacokinetic model for ciprofloxacin in children treated for complicated urinary tract infections. Children to whom ciprofloxacin was prescribed, intravenous (10 to 15 mg/kg body weight every 12 h) or per os (15 to 20 mg/kg every 12 h), were enrolled. One hundred eight serum and 119 urine samples were obtained during 10 intravenous and 13 oral courses of ciprofloxacin in 22 patients (age range, 0.31 to 15.51 years). A one-compartment model best described our data. Fat-free mass and glomerular filtration rate (estimated by a formula using cystatin C and creatinine), standardized for body surface area, were significant covariates for ciprofloxacin clearance. In our population, ciprofloxacin clearance is 0.16 to 0.43 liter/h/kg of body weight, volume of distribution 0.06 to 2.88 liters/kg, and bioavailability 59.6%. All of our patients had a clinical cure of their infection. Based on target attainment simulations across doses, all children reached the pharmacodynamic target for Enterobacteriaceae, but on average only 53% did for Pseudomonas aeruginosa and 3% for Staphylococcus aureus, at the 15-mg/kg oral dose. For treating urinary tract infections caused by Pseudomonas aeruginosa, oral doses should be at least 20 mg/kg. Furthermore, in our population, fat-free mass and kidney function should be considered, as they prove to be significant covariates for ciprofloxacin clearance and, hence, exposure. (This study has been registered at ClinicalTrials.gov under identifier NCT02598362.)
INTRODUCTION
Up to 8% of girls and 2% of boys suffer from at least one episode of urinary tract infection (UTI) before the age of 8 years, making this the most prevalent bacterial infection in childhood (1). UTI encompasses infections of both bladder mucosa (cystitis) and the renal tissue, which is usually called pyelonephritis or febrile UTI (2). Girls and uncircumcised boys are at greatest risk for UTI, whereas children with congenital anomalies of the kidneys and urinary tract (CAKUT) and bladder bowel dysfunctions (BBD) are at risk for recurrences (3). Furthermore, CAKUT, particularly vesicoureteral reflux, is a major risk factor for complications of UTI, such as sepsis, pseudohypoaldosteronism, and renal scarring (4–7). Antibiotics are the cornerstone in treatment of UTI, and often the peroral (p.o.) route is preferred (8). Escherichia coli is the most common bacterium cultured in children suffering UTI (2) and should therefore be covered in any empirical antibiotic regimen for UTI. Other bacteria causing UTI in children, such as Klebsiella and Pseudomonas strains, usually called non-E. coli or atypical uropathogens, are more often cultured in children with abnormal urine flow, such as children with CAKUT (2). Beta-lactam antibiotics, cephalosporins, and trimethoprim-sulfamethoxazole are common empirical antibiotics for children with UTI. However, other antibiotic classes are indicated for covering atypical uropathogens. Ciprofloxacin, a fluoroquinolone, is labeled for treatment of complicated UTI in children (9, 10). Yet, resistance rates of different uropathogens for fluoroquinolones are rapidly rising, probably at least partly due to inappropriate usage (11). Fluoroquinolones are concentration-dependent bacterial killers, which implies that sufficient drug concentrations are essential both for exerting antibiotic effects and for reducing antimicrobial resistance (12, 13). Therefore, in treating UTI, sufficient concentrations of antibiotics in urine are essential for bacterial eradication. Yet, there are no reference values for urine concentrations of antibiotics. Therefore, the ratio of area under the concentration-time curve (AUC) to MIC is usually the pharmacokinetic/pharmacodynamic (PK/PD) parameter describing the antimicrobial effect of fluoroquinolones. Their PK in children has not been extensively studied, probably due to previous safety concerns, as irreversible cartilage tissue damages were observed in juvenile animals after administration of ciprofloxacin (14, 15). Yet, there is no evidence of irreversible cartilage tissue damage in children who are treated with ciprofloxacin (16). In children, PK is influenced by different disease, growth, and maturational characteristics (17, 18). Therefore, research on developmental pharmacology of ciprofloxacin is pertinent for optimization of antimicrobial therapy.
The primary aim of this study was to document serum and urine pharmacokinetics of ciprofloxacin in a population of children with complicated UTI. Furthermore, unbound concentrations and the renal markers cystatin C and creatinine were determined in plasma. Using these data, a population pharmacokinetic (PopPK) modeling approach was applied, to investigate the influence of different covariates on ciprofloxacin exposure in this special population.
RESULTS
Participants.
A total of 108 serum and 119 urine samples were obtained from 22 children. One child participated during both a p.o. and an intravenous (i.v.) course of ciprofloxacin, so data were collected during 23 courses of ciprofloxacin. Clinical characteristics of our study population are displayed in Table 1. The majority of participants had significant urinary tract comorbidities, such as any type of CAKUT (vesicoureteral reflux, duplex ureters, dysplastic kidneys) or BBD (overactive bladder, underactive bladder, voiding postponement). Escherichia coli was cultured in 10/23 of our participants, and non-E. coli bacteria were cultured in 9/23. Urine culture remained sterile in the rest of our participants; these four children had received previous courses of antibiotics. There were more girls than boys in the i.v. group. Participants who were treated p.o. usually got a syrup formulation (9/13); the others used tablets. These different oral routes were first separately tested in model development but were not found to be significantly different from each other, and thus only two routes (i.v. and p.o.) were subsequently applied.
TABLE 1.
Clinical characteristics of the study population
| Characteristic | i.v. treatment | p.o. treatment |
|---|---|---|
| No. of participants | 10 | 13 |
| No. (proportion) of females | 8 (80%) | 6 (46.2%) |
| Diagnosis, no. of cases | Acute pyelonephritis, 9 | Acute pyelonephritis, 9 |
| Cystitis with oral intolerance, 1 | Cystitis, 2 | |
| Recurrent lower UTI, 2 | ||
| Comorbidities, no. of cases | CAKUT, 3 | CAKUT, 7 |
| Neurogenic bladder, 1 | CAKUT and renal insufficiency, 1 | |
| BBD, 2 | CAKUT and BBD, 1 | |
| CAKUT and stone disease, 1 | CAKUT and stone disease, 1 | |
| None, 3 | Neurogenic bladder, 1 | |
| BBD, 1 | ||
| Stone disease, 1 | ||
| None, 1 | ||
| Median age in yr (range) | 9.86 (0.51–15.5) | 6.43 (0.31–15.4) |
| Median wt in kg (range) | 26.7 (8.21–75.30) | 18.3 (6.47–106) |
| Serum cystatin C (mg/liter) | 0.71 (0.63–0.84) | 0.86 (0.61–2.88) |
| Serum creatinine (mg/dl) | 0.49 (0.28–0.81) | 0.64 (0.38–1.54) |
| Urine culture, no. of cases | Escherichia coli, 4 | Escherichia coli, 5 |
| Pseudomonas aeruginosa, 3 | Pseudomonas aeruginosa, 4 | |
| Klebsiella pneumoniae, 1 | Klebsiella pneumoniae, 1 | |
| No growth, 2 | Proteus strains, 1 | |
| No growth, 2 | ||
| Kidney function in ml/min/1.73 m2 (Chehade equation, KF) | 98.4 (73.7–116) | 65.5 (6.75–84.6) |
Model development.
After thorough testing, a model using an allometric structure based on fat-free mass (FFM) and influence of kidney function (KF) on renal excretion was chosen as the optimal model. FFM rather than body weight (BW) was used because of its performance, and because two obese patients (a boy and a girl, both 15 years of age, with a body mass index [BMI] of 36.5 and 30.6 kg/m2, respectively) were included in the study population. FFM was calculated using age (AGE, in years), body weight (BW, in kilograms), and height (HGHT, in centimeters) using equation 1 (19):
| (1) |
KF was obtained by first calculating the body surface area (BSA)-normalized (per 1.73 m2) estimated glomerular filtration rate (GFR) using the Chehade formula (equation 2 [20]), after which this was divided by 120 ml/min (normal kidney function) to obtain a dimensionless parameter.
Equation 2, the Chehade equation for GFR calculation in children (20), is as follows.
| (2) |
No other significant covariates could be detected. The available data were used to their limits, as the absorption-related random effects could not be estimated without inflating the condition number. The final model structure and parameters are displayed in Table 2.
TABLE 2.
Final model structure, parameter estimates, and bootstrap values
| Parametera | Estimate (%RSE) | Bootstrap (90% CI) |
|---|---|---|
| F = θ1 * eη1 | 0.596 (14.5%) | 0.615 (0.467–0.773) |
| ka = θ2 * eη2 | 0.370 h−1 (8.9%) | 0.386 h−1 (0.291–0.538) |
| CLm = θ3 * (FFM/56.1)0.75 * eη3 | 7.14 liters * h−1 (21.3%) | 7.42 liters * h−1 (5.09–10.4) |
| CLr = KF * θ4 * (FFM/56.1)0.75 * eη4 | 8.76 liters * h−1 (14.5%) | 8.71 liters * h−1 (6.48–11.0) |
| V = θ5 * FFM/56.1 * eη5 | 38.8 liters (27.6%) | 41.8 liters (24.6–71.4) |
| IIV on F | 0 FIX | |
| IIV on ka | 0 FIX | |
| IIV on CLm | 68.6%a (33.4%) (13.1% shrinkage) | 57.0% (38.0–83.3) |
| IIV on CLr | 59.0% (33.0%) (10.5% shrinkage) | 59.3% (39.1–84.8) |
| IIV on V | 161% (46.8%) (11.5% shrinkage) | 153% (68.3–381) |
| Proportional residual error on plasma concentrations | 0.0503 (28.0%) | 0.0460 (0.00659–0.0946) |
| Additive residual error on plasma concentrations | 0.381 (50.4%) | 0.329 (0.0581–1.16) |
| Proportional residual error on urine concentrations | 0.198 (30.9%) | 0.182 (0.107–0.324) |
| Additive residual error on urine concentrations | 0.00530 (19.7%) | 0.00552 (0.000229–0.0159) |
F, coefficient of variation, calculated as follows: .
Model evaluation.
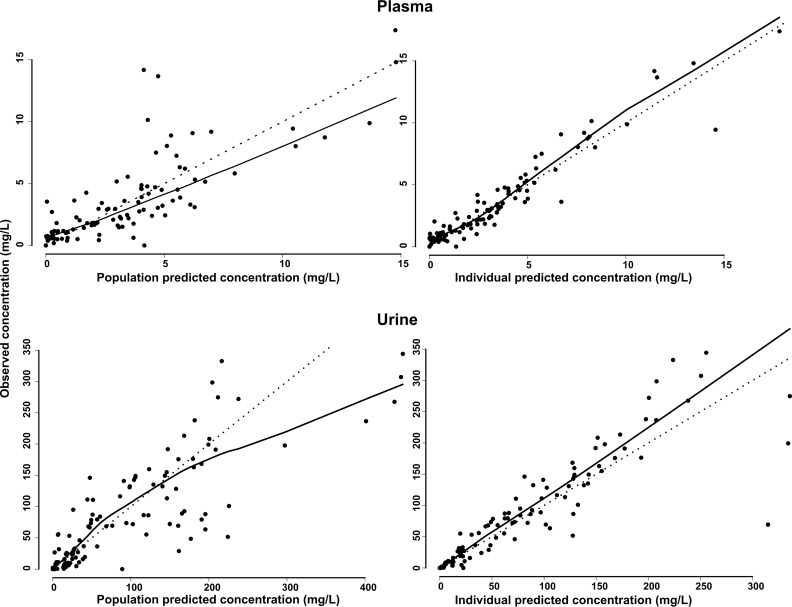
Observed plasma and urine concentrations are plotted against their corresponding population and individual predictions in Fig. 1. A Loess smoother showed slight deviations from the line of unity for the population predictions and no significant deviations for the individual predictions. The 90% confidence intervals (CIs) of the bias-corrected bootstrap with acceleration constant (BCa) analysis (987/1,000 runs completed minimization, 13 failed due to rounding errors) are included in Table 2. The bootstrap estimates on the fixed and random effects deviated between −13.4% and +6.10% from the model estimates, with an average deviation of +1.43%, indicating good agreement.
FIG 1.
Population and individual predicted plasma and urine concentrations versus observed concentrations. The dotted line represents the unity line, whereas the black line represents a Loess smoother through the data.
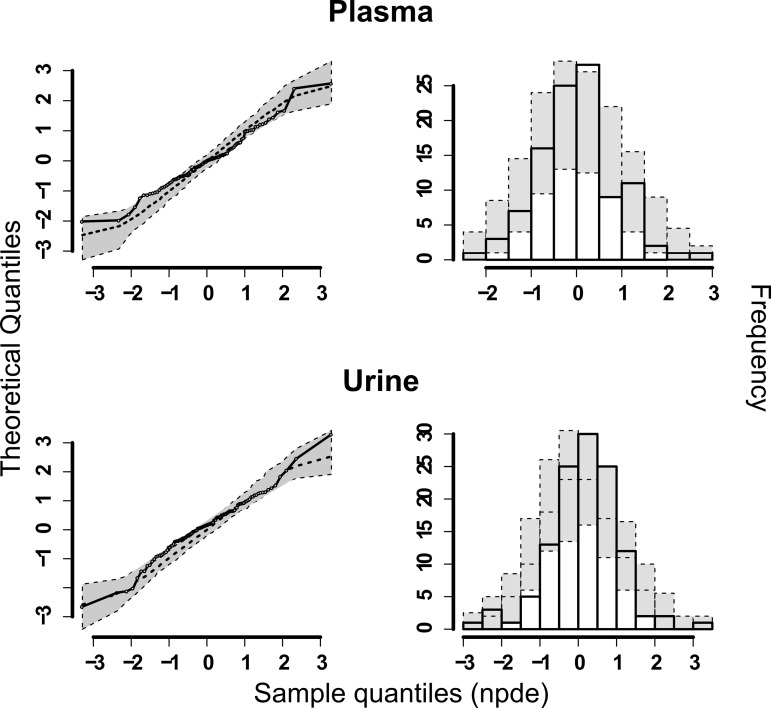
The normalized prediction distribution errors (NPDE) results for both plasma and urine predictions are shown in Fig. 2. No significant deviations from the standard normal distribution could be detected, although the value was close for plasma (global adjusted P value, 0.053 for plasma and 0.179 for urine). Judging from the above-described model diagnostics and the individual concentration-time profiles (data not shown), the model was deemed to fit the data reasonably well.
FIG 2.
NPDE plots of the final model. On the left side, QQ-plots of the NPDEs are shown, and on the right side the distribution of the NPDEs after 1,000 simulations are shown together with the theoretical standard normal distribution.
PK dosing simulations.
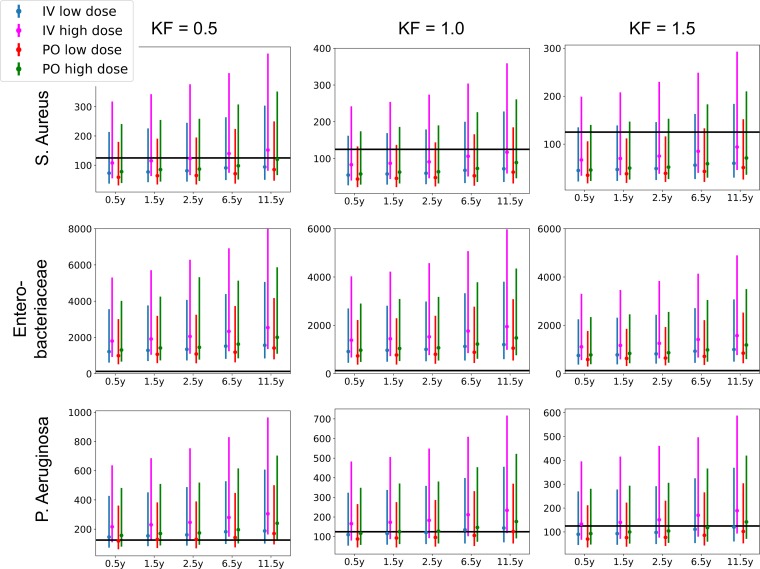
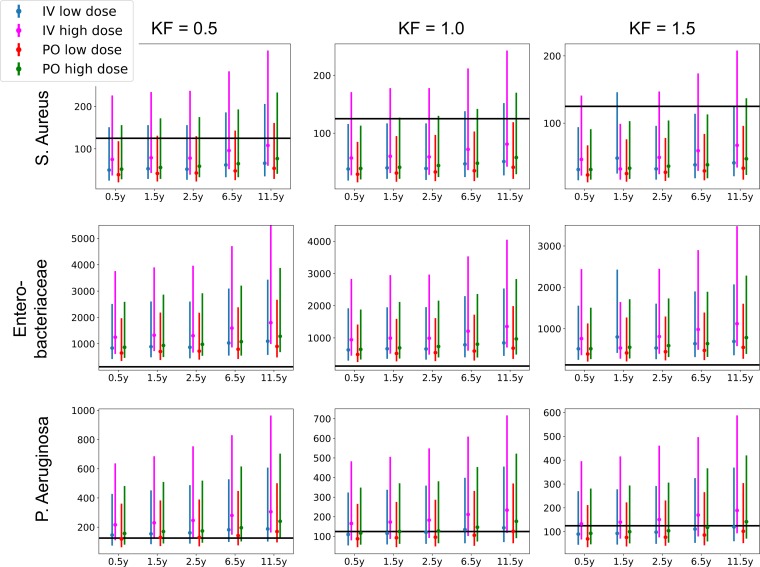
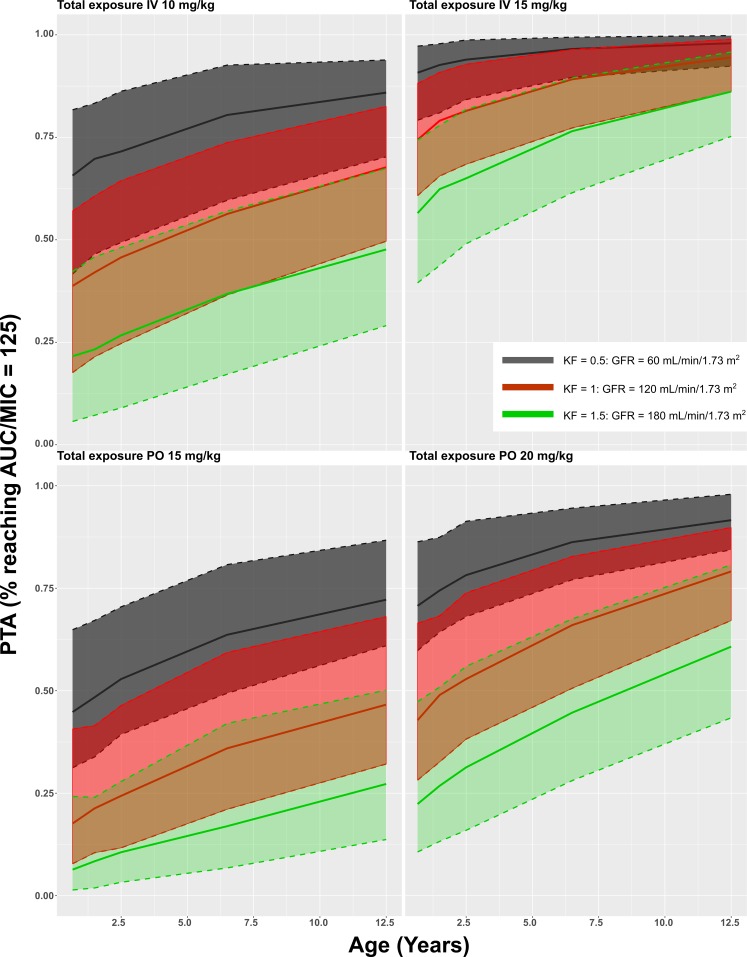
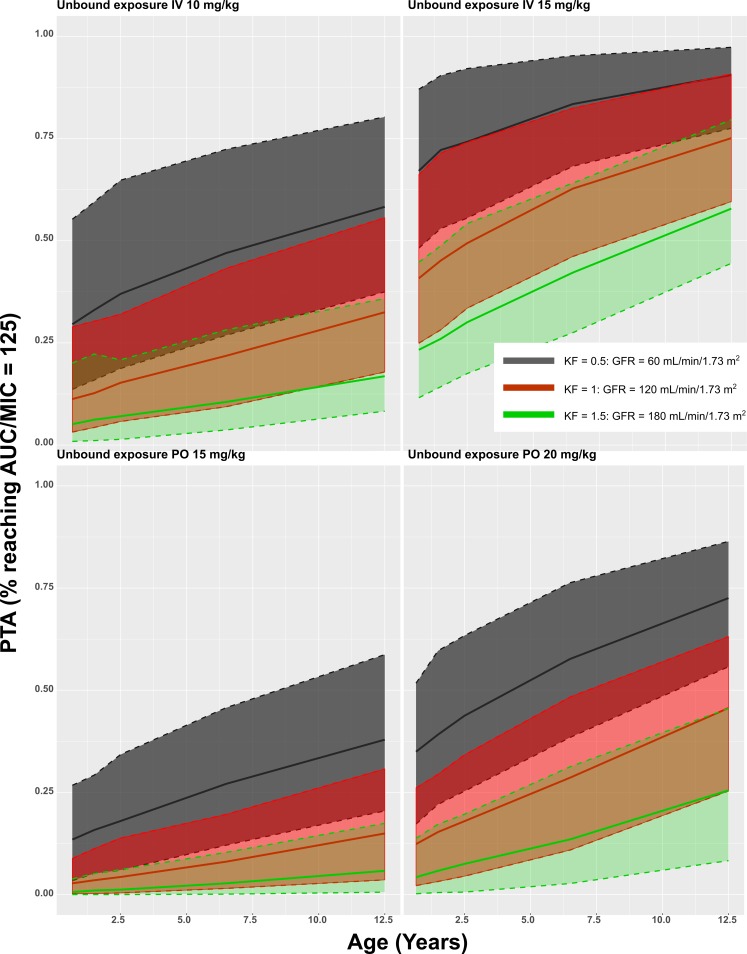
The model was subsequently used to simulate the most common dosing regimen. Simulated AUCs were divided by MIC breakpoints as published by The European Committee on Antimicrobial Susceptibility Testing Breakpoint tables (version 7.1, 2017; http://www.eucast.org). These values are presented in Table S1 in the supplemental material and in Fig. 3, 4, 5, and 6. A value of AUC/MIC of 125 or higher was postulated as PD target (MICP. aeruginosa, 0.5 mg/liter; MICEnterobacteriaceae, 0.06 mg/liter; MICS. aureus, 1 mg/liter). All simulated groups reached this PD target for Enterobacteriaceae. For P. aeruginosa, on average 57% reached the target for the lower i.v. dose, ranging from 36% for young children with elevated renal function to 88% for older children with renal impairment. For the 15-mg/kg i.v. dose, this increased to 93% overall, ranging from 86% to 100%. On average 53% of patients reached the PD target for the 15-mg/kg p.o. dose, ranging from 20% to 80%, which increased to 66% for the 20-mg/kg p.o. dose, ranging from 46% to 86%. For S. aureus, the PD target was reached in only 3% of the simulations, ranging from 0% to 33%.
FIG 3.
Simulated AUC/MIC for total concentrations of ciprofloxacin. KF, kidney function.
FIG 4.
Simulated AUC/MIC for unbound concentrations of ciprofloxacin. KF, kidney function.
FIG 5.
Probability of target attainment (PTA) curves for total concentrations of ciprofloxacin.
FIG 6.
Probability of target attainment (PTA) curves for unbound concentrations of ciprofloxacin.
DISCUSSION
In this multicenter prospective PopPK study, we analyzed pharmacokinetics of ciprofloxacin in a population of children who were treated for complicated UTI. Clearance in our population (median CL, 15.9 liters/h for 70 kg with normal KF) was lower than in previous studies (30.3 liters/h/70 kg [21] and 35.2 liters/h for an average 18-year-old [22]). This discrepancy seems to be caused by differences in renal clearance estimation, as the median renal contribution was estimated at 50%, where this is normally expected to be two-thirds of total clearance (23). In previous studies, renal clearance was estimated by creatinine-based methods, such as the Schwarz formula. In our population, GFR was estimated with the formula of Chehade, which combines cystatin C and creatinine (20). In children, estimating GFR on either substance has drawbacks, as measuring GFR using an exogenous substance such as EDTA (Cr-EDTA) is considered the gold standard. However, this is neither feasible in clinical settings nor ethical for research purposes. Despite being a superior marker for drug clearance compared to creatinine (24), cystatin C is not widely used in clinical practice. The Chehade formula was derived in a cohort of 238 children who had at least stage 1 chronic kidney disease (CKD). Therefore, we considered this formula optimal, since it combines cystatin C and creatinine, and most children in our population had chronic renal abnormalities.
In comparison with previous studies, the volume of distribution was low in our population, 38.8 liters, compared to 147 liters (21) and 104 liters for a 70-kg individual (22). In contrast to our study, patients with cystic fibrosis were included in these previous studies, in whom volume of distribution (V) is usually increased. This might explain the lower volume of distribution in our population. As both CL and V are lower, ciprofloxacin's half-life in our population is roughly comparable to previous analyses: 0.13 to 9.03 h versus 1.84 to 2.35 h (21) and 1.26 to 9.29 h (22). Furthermore, the estimated bioavailability and absorption rate constant are similar to previous analyses: 0.596 versus 0.611 (21) and 0.851 (22), and 0.372 h−1 versus 1.28 h−1 (21) and 0.423 h−1 (22), respectively.
In our PK dosing simulations, all simulated groups reached the PD target for Enterobacteriaceae. Yet, on average 53% of all children reached the PD target for Pseudomonas aeruginosa, when dosed at 15 mg/kg p.o. This is worrisome, as ciprofloxacin was prescribed as the only p.o. alternative for treating Pseudomonas aeruginosa in 7/22 of our patients. Subtherapeutic concentrations of fluoroquinolones select resistant Pseudomonas strains (12, 25). Therefore, higher p.o. doses might be required. However, even at the high dose of 20 mg/kg p.o., only 46% of children with elevated KF reached the PD target. On average 3% of all children reached the PD target for S. aureus, which is expected, as ciprofloxacin generally has a weak Gram-positive coverage.
Using the unbound concentrations, we attempted to differentiate between tubular secretion and glomerular filtration for the renal clearance. It was, however, not possible to estimate the contribution of active processes to the renal clearance, probably due to sparseness of the data. It might also be possible that the renal comorbidities present in the population alter tubular secretion differently than filtration, as these processes happen in other parts of the kidney.
There are some limitations to our work. First, a relatively high proportion of our study participants had major abnormalities of the urinary tract. This is reflected by the fraction of non-E. coli pathogens that were cultured in our population, which is 60.9% higher than in most other populations of children with UTI. Therefore, our results might not extrapolate to other populations of children with UTI. However, in order to control antimicrobial resistance, ciprofloxacin should not be a first-choice agent for uncomplicated UTI. For children in our population, ciprofloxacin was usually prescribed as the only available p.o. alternative as dictated by antibiograms. For some children, ciprofloxacin was preferred because of assumed better penetrance in those with swollen kidney tissue during acute pyelonephritis, which was confirmed by ultrasounds. All these children did not respond to the first-choice antibiotics considered, usually temocillin or ceftriaxone. Among them were four children in whom no pathogen could be cultured in routine media; all had received prior antibiotics.
Second, urine for our analyses was collected with noninvasive methods. We did a major effort to collect all urine during study periods, even in children who had not been toilet trained. Yet, given the high proportion of children with CAKUT, BBD, and neurogenic bladders in our population, it is likely that our urine collections do not represent the total urine production during study periods. This could only be overcome by collecting urine with indwelling catheters. However, this is not ethical for the purpose of research only without any further clinical reason. Furthermore, as most participants had had previous doses of ciprofloxacin, it could have been accumulated in urine. Therefore, we chose to model the cumulative urine excretion to at least “middle out” the urine collection error.
In conclusion, our population modeling analysis of these clinical data in children with complicated UTI indicated that these patients exhibit different ciprofloxacin PK than previously investigated populations (healthy and cystic fibrosis patients). This difference might be clinically relevant, as simulations show that PD targets are not reached for P. aeruginosa when applying conventional dosing schemes.
MATERIALS AND METHODS
Study design.
A prospective, open-label, pharmacokinetic study was conducted at the departments of pediatrics at Ghent University Hospital and Universitair Ziekenhuis Brussel, the hospital of the Dutch-speaking university of Brussels (Vrije Universiteit Brussel), between May 2015 and May 2017. Patients between 3 months and 17 years of age who were treated with ciprofloxacin for UTI, either p.o. or i.v., were considered for inclusion. Patients were excluded either if they had a contraindication for ciprofloxacin, such as epilepsy, pregnancy, long QT syndrome, glucose-6-phosphatase deficiency (G6PD), or if they were allergic to any of the product substances. Furthermore, patients were excluded if no informed consent could be obtained from both parents and/or legal representatives. This study was conducted in accordance with the guidelines of the Declaration of Helsinki and was approved by institutional review boards at both study sites (Brussels, EC/2015/033; Ghent, EC/2014/1207). Written informed consent was obtained from both the parents or legal representatives, and informed assent was obtained from the patients if they were older than 12 years. The study was registered at clinicaltrials.gov (NCT02598362).
Drug dosing and administration.
For i.v. administration, ciprofloxacin solution for infusion (ciprofloxacine Mylan, 400 mg/200 ml) was dosed at 10 to 15 mg/kg (maximum 750 mg), rounded off as prescribed by the treating physician, every 12 h, via peripheral or central catheters. According to a standard protocol, ciprofloxacin was infused in a 30- to 60-min period, and intravenous lines were flushed with 0.9% NaCl afterwards. For p.o. administration, ciprofloxacin was dosed at 15 to 20 mg/kg (maximum 750 mg) every 12 h. Either ciprofloxacin suspension for oral administration (Ciproxine; Bayer SA-NV, Diegem, Belgium) or ciprofloxacin tablets of 500 mg or 750 mg (Ciprofloxacine Sandoz, Vilvoorde, Belgium; Ciproxine; Bayer SA-NV, Diegem, Belgium) were used for oral treatments and were ingested with water.
Sampling and storage.
Serial blood samples were drawn via a peripheral catheter, one sample prior to administration for patients who had received any previous dose, and at three to six different time points after administration for all participants. Typically, a first postdose sample was collected either 1 h after p.o. administration or directly after intravenous infusion. Further samples were obtained at different time points, and collection time was carefully recorded for each sample. The total number of samples collected per patient was limited by the total maximum blood volume permitted for PK sampling per patient, defined as 2.4 ml/kg of body weight. After sampling, blood was subsequently centrifuged at the local study site (1,500 × g for 10 min), after which the plasma samples were stored at −20°C until analysis.
Urine was collected for toilet-trained children with noninvasive collections or with a catheter if it was present for clinical reasons. For non-toilet-trained children, urine was collected with urine collection bags. A micturition alarm was placed in the diaper (Charco, Ghent, Belgium), so that the bag could be changed in case of leakage. After each collection, urine volume and collection time were registered, and a sample was obtained that was stored at −20°C until analysis.
Bioanalysis.
Serum and urine ciprofloxacin concentrations were determined using a validated high-performance liquid chromatographic (HPLC) method with fluorescence detection. Sarafloxacin was used as internal standard. This method has previously been described by De Smet et al. (26). Concisely, acetonitrile and internal standard were added to the plasma samples for protein precipitation, followed by evaporation of the liquid layer under N2 and reconstitution in eluent A (acetonitrile [ACN]–MeOH–0.025 M tetrabutylammonium chloride [TBA-Cl]–trifluoroacetic acid [TFA], 75/25/899/1 [vol/vol/vol/vol]), the aqueous eluent used for HPLC analysis. Urine samples were diluted 1:20 with internal standard in eluent A before HPLC analysis. Unbound concentrations were determined by adjusting the pH of the plasma samples to physiological pH (7.4) using 60 min of incubation at 37°C and 5% CO2, followed by 20 min of ultrafiltration at 37°C and 3,500 × g. The resulting filtrate was then diluted 1:10 with internal standard in eluent A and injected in the HPLC system. The linear range of this method was 5 ng/ml to 5 μg/ml for plasma and 50 ng/ml to 20 μg/ml for urine samples with a between-day imprecision of maximum 5%.
Serum cystatin C was analyzed using the N Latex cystatin C assay on the Behring nephelometer II (Siemens Healthcare Diagnostic Products GmbH, Marburg, Germany). Creatinine in serum and urine was measured using the Enzymatic-Vitros IFCC-IDMS Standardized method (Vitros 4600/Ortho Clinical Diagnostics, Turnhout, Belgium).
Model development.
A PopPK model was developed using Nonmem v. 7.3 (27), with FOCE+I as estimation algorithm, accessed with the software Perl-Speaks-Nonmem (PSN) (28), embedded in the workbench Piraña (29). RStudio (v. 0.98; http://www.rstudio.com/) was used to prepare the data sets, perform the simulations, and postprocess all results, which included the statistical calculations and plot generation.
Based on the literature, a 2-compartmental model was first fitted to the data (21, 22, 30). However, as peripheral volume and intercompartmental clearance could not be estimated, a 1-compartment model was chosen as starting point for model development. As urine concentrations were available on top of plasma concentrations, a urine compartment was added to the model, and the clearance was split in a renal and a nonrenal part. For the patients receiving oral administration, a first-order absorption was assumed as a starting point for model development. Interindividual variability (IIV) was assumed to follow a log-normal distribution. Additive, proportional, and mixed residual error models were tested on the prediction of both plasma and urinary concentrations. Once an appropriate mixed-effects model was obtained, covariate relationships were investigated using forward selection and backwards elimination, adding them to the model one at a time, and selecting the models with the best performance metrics to proceed with. The covariates that were tested were age (AGE), body weight (WT), fat-free mass (FFM), fat content (FAT [WT − FFM]), sex (SEX), serum creatinine (CREAT), serum cystatin C (CYSTC), febrile state during the study period (FEVER), presence of CAKUT (CAKUT), diagnosis of pyelonephritis (PYELO), comedication (COMED), and investigational center (SITE). Furthermore, theoretically based (31) allometric principles for both FFM and WT using fixed parameters were tested in parallel and retained in the model if their inclusion resulted in model improvement.
The decision to include or exclude certain model components was guided by several performance metrics: objective function value (OFV), Akaike's information criterion (AIC), the condition number (CN), and relative standard error (RSE) of the parameter estimates, obtained through the covariance step in Nonmem. A drop in OFV of 3.84 (P < 0.05) after inclusion and 6.63 (P < 0.01) after exclusion was assumed to indicate a significantly better fit. Both the OFV and the AIC are based on likelihood ratio tests, which cannot be reliably used to guide in-/exclusion of IIV parameters, especially for sparse data (32). Thus, for those parameters, decisions were made based on RSE and CN (both should be as low as possible) and standard goodness-of-fit plots (plots of the observed concentrations versus population- and individual-predicted concentrations, and plots of the residuals).
Model evaluation.
Different evaluation techniques were applied to the final model. Individual and population prediction versus observation plots were constructed, and bootstrap analysis was performed. For the latter, 1,000 data sets were resampled with replacement from the original data set. The bias-corrected bootstrap with acceleration constant (BCa) method was used in order to obtain second-order correct 90% CIs around the parameter estimates (33). This method corrects for bias and skewness in the standard bootstrap CIs and thus provides a more reliable estimate of the parameter CIs. Lastly, normalized prediction distribution errors (NPDEs) were calculated. For this, the final model was simulated 1,000 times using the same design as the original data set, after which the NPDEs were calculated using the R package NPDE. Under the null hypothesis that the model describes the data, the distribution of NPDEs should be equal to the standard normal distribution N (0, 1). This was formally tested using the Wilcoxon signed-rank test (H0: μ = 0), the Fisher variance ratio test (H0: σ2 = 1), and the Shapiro-Wilks normality test [H0: Z ∼ N (μ, σ2)], from which a global adjusted P value was calculated.
Dosing simulations.
In order to assess the appropriateness of current dosing regimens in children suffering from UTI, the lower (10 mg/kg) and upper (15 mg/kg) i.v. and p.o. (15 mg/kg and 20 mg/kg of body weight, respectively) doses were simulated for 1,000 children, for low (60 ml/min/1.73 m2), normal (120 ml/min/1.73 m2), and elevated (180 ml/min/1.73 m2) GFR. This was done for five age ranges (0.25 to 1, 1 to 2, 2 to 3, 6 to 7, and 12 to 13 years) for which the weight was randomly sampled from a bivariate lognormal age-weight distribution (34). The 90% confidence intervals (CI) of the results (calculated using the trapezoidal method) were then calculated and compared to the reference values for two common uropathogens: Enterobacteriaceae and Pseudomonas aeruginosa. Additionally, as a negative control, our data were compared to reference values of Staphylococcus aureus, since this pathogen is neither a common uropathogen nor usually sensitive to ciprofloxacin.
Supplementary Material
ACKNOWLEDGMENTS
We acknowledge our study nurses for their valuable support in data collection. Lennart Joos provided valuable support in the graphic designs.
All authors are supported by the Agency for Innovation by Science and Technology in Flanders (IWT) through the SAFE PEDRUG project (IWT/SBO 130033). Bedwetting alarms were kindly provided by Charco, Ghent, Belgium. The funders had no role in the study design and publication process.
Author contributions: Kevin Meesters, Robin Michelet, Reiner Mauel, Johan Vande Walle, and An Vermeulen designed the study. Kevin Meesters, Reiner Mauel, Ann Raes, and Johan Vande Walle were responsible for recruitment and data collection. Robin Michelet, Jan Van Bocxlaer, and An Vermeulen were involved in data analysis and modeling. Kevin Meesters, Ann Raes, and Johan Vande Walle interpreted the clinical data. All authors approved the final manuscript.
Conflicts of interest: An Vermeulen is an employee of Johnson & Johnson and holds stock/stock options from Johnson & Johnson. Johan Vande Walle has received consulting fees and travel reimbursements from Ferring pharmaceuticals and payment for lectures from Ferring pharmaceuticals and Astellas Pharma. Kevin Meesters, Robin Michelet, Reiner Mauel, Ann Raes, and Jan Van Bockxlaer have no potential conflicts of interest that might be relevant to the manuscript.
Footnotes
Supplemental material for this article may be found at https://doi.org/10.1128/AAC.00517-18.
REFERENCES
- 1.Shaikh N, Morone NE, Bost JE, Farrell MH. 2008. Prevalence of urinary tract infection in childhood. Pediatr Infect Dis J 27:302–308. doi: 10.1097/INF.0b013e31815e4122. [DOI] [PubMed] [Google Scholar]
- 2.Montini G, Tullus K, Hewitt I. 2011. Febrile urinary tract infections in children. N Engl J Med 365:239–250. doi: 10.1056/NEJMra1007755. [DOI] [PubMed] [Google Scholar]
- 3.Keren R, Shaikh N, Pohl H, Gravens-Mueller L, Ivanova A, Zaoutis L, Patel M, DeBerardinis R, Parker A, Bhatnagar S, Haralam MA, Pope M, Kearney D, Sprague B, Barrera R, Viteri B, Egigueron M, Shah N, Hoberman A. 2015. Risk factors for recurrent urinary tract infection and renal scarring. Pediatrics 136:e13–e21. doi: 10.1542/peds.2015-0409. [DOI] [PMC free article] [PubMed] [Google Scholar]
- 4.Abraham MB, Larkins N, Choong CS, Shetty VB. 2017. Transient pseudohypoaldosteronism in infancy secondary to urinary tract infection. J Paediatr Child Health 53:458–463. doi: 10.1111/jpc.13481. [DOI] [PubMed] [Google Scholar]
- 5.Mattoo TK, Chesney RW, Greenfield SP, Hoberman A, Keren R, Mathews R, Gravens-Mueller L, Ivanova A, Carpenter MA, Moxey-Mims M, Majd M, Ziessman HA. 2016. Renal scarring in the randomized intervention for children with vesicoureteral reflux (RIVUR) trial. Clin J Am Soc Nephrol 11:54–61. doi: 10.2215/CJN.05210515. [DOI] [PMC free article] [PubMed] [Google Scholar]
- 6.Brandström P, Nevéus T, Sixt R, Stokland E, Jodal U, Hansson S. 2010. The Swedish Reflux Trial in Children. IV. Renal damage. J Urol 184:292–297. doi: 10.1016/j.juro.2010.01.060. [DOI] [PubMed] [Google Scholar]
- 7.Shaikh N, Craig JC, Rovers MM, Da Dalt L, Gardikis S, Hoberman A, Montini G, Rodrigo C, Taskinen S, Tuerlinckx D, Shope T. 2014. Identification of children and adolescents at risk for renal scarring after a first urinary tract infection: a meta-analysis with individual patient data. JAMA Pediatr 168:893–900. doi: 10.1001/jamapediatrics.2014.637. [DOI] [PubMed] [Google Scholar]
- 8.Strohmeier Y, Hodson EM, Willis NS, Webster AC, Craig JC. 2014. Antibiotics for acute pyelonephritis in children. Cochrane Database Syst Rev 7:CD003772. doi: 10.1002/14651858.CD003772.pub4. [DOI] [PMC free article] [PubMed] [Google Scholar]
- 9.European Medicines Agency. EMA label guideline ciprofloxacin. Scientific conclusions and grounds for summaries of product characteristics, labelling and package leaflet for ciprofloxacin. European Medicines Agency, London, United Kingdom. [Google Scholar]
- 10.US Food and Drug Administration. 2004. FDA label guideline ciprofloxacin, p 1–31. Labelling leaflet for ciprofloxacin. US Food and Drug Administration, Rockville, MD. [Google Scholar]
- 11.Gagliotti C, Nobilio L, Moro ML. 2007. Emergence of ciprofloxacin resistance in Escherichia coli isolates from outpatient urine samples. Clin Microbiol Infect 13:328–331. doi: 10.1111/j.1469-0691.2006.01615.x. [DOI] [PubMed] [Google Scholar]
- 12.Guillot E, Sermet I, Ferroni A, Chhun S, Pons G, Zahar J-R, Jullien V. 2010. Suboptimal ciprofloxacin dosing as a potential cause of decreased Pseudomonas aeruginosa susceptibility in children with cystic fibrosis. Pharmacotherapy 30:1252–1258. doi: 10.1592/phco.30.12.1252. [DOI] [PubMed] [Google Scholar]
- 13.Drlica K, Malik M, Kerns RJ, Zhao X. 2008. Quinolone-mediated bacterial death. Antimicrob Agents Chemother 52:385–392. doi: 10.1128/AAC.01617-06. [DOI] [PMC free article] [PubMed] [Google Scholar]
- 14.Förster C, Kociok K, Shakibaei M, Merker HJ, Stahlmann R. 1996. Quinolone-induced cartilage lesions are not reversible in rats. Arch Toxicol 70:474–481. doi: 10.1007/s002040050301. [DOI] [PubMed] [Google Scholar]
- 15.Yoshida K, Yabe K, Nishida S, Yamamoto N, Ohshima C, Sekiguchi M, Yamada K, Furuhama K. 1998. Pharmacokinetic disposition and arthropathic potential of oral ofloxacin in dogs. J Vet Pharmacol Ther 21:128–132. doi: 10.1046/j.1365-2885.1998.00114.x. [DOI] [PubMed] [Google Scholar]
- 16.Adefurin A, Sammons H, Jacqz-Aigrain E, Choonara I. 2011. Ciprofloxacin safety in paediatrics: a systematic review. Arch Dis Child 96:874–880. doi: 10.1136/adc.2010.208843. [DOI] [PMC free article] [PubMed] [Google Scholar]
- 17.Kearns GL, Abdel-Rahman SM, Alander SW, Blowey DL, Leeder JS, Kauffman RE. 2003. Developmental pharmacology—drug disposition, action, and therapy in infants and children. N Engl J Med 349:1157–1167. doi: 10.1056/NEJMra035092. [DOI] [PubMed] [Google Scholar]
- 18.Calvier EAM, Krekels EHJ, Välitalo PAJ, Rostami-Hodjegan A, Tibboel D, Danhof M, Knibbe CAJ. 2016. Allometric scaling of clearance in paediatric patients: when does the magic of 0.75 fade? Clin Pharmacokinet 56:273–285. doi: 10.1007/s40262-016-0436-x. [DOI] [PMC free article] [PubMed] [Google Scholar]
- 19.Al-Sallami HS, Goulding A, Grant A, Taylor R, Holford N, Duffull SB. 2015. Prediction of fat-free mass in children. Clin Pharmacokinet 54:1169–1178. doi: 10.1007/s40262-015-0277-z. [DOI] [PubMed] [Google Scholar]
- 20.Chehade H, Cachat F, Jannot AS, Meyrat BJ, Mosig D, Bardy D, Parvex P, Girardin E. 2014. New combined serum creatinine and cystatin C quadratic formula for GFR assessment in children. Clin J Am Soc Nephrol 9:54–63. doi: 10.2215/CJN.00940113. [DOI] [PMC free article] [PubMed] [Google Scholar]
- 21.Rajagopalan P, Gastonguay MR. 2003. Population pharmacokinetics of ciprofloxacin in pediatric patients. J Clin Pharmacol 43:698–710. doi: 10.1177/0091270003254802. [DOI] [PubMed] [Google Scholar]
- 22.Payen S, Serreau R, Munck A, Aujard Y, Aigrain Y, Bressolle F, Jacqz-Aigrain E. 2003. Population pharmacokinetics of ciprofloxacin in pediatric and adolescent patients with acute infections. Antimicrob Agents Chemother 47:3170–3178. doi: 10.1128/AAC.47.10.3170-3178.2003. [DOI] [PMC free article] [PubMed] [Google Scholar]
- 23.Bergan T, Dalhoff A, Rohwedder R. 1988. Pharmacokinetics of ciprofloxacin. Infection 16(Suppl 1):S3–S13. doi: 10.1007/BF01650500. [DOI] [PubMed] [Google Scholar]
- 24.Brou NA, Jacqz-Aigrain E, Zhao W. 2015. Cystatin C as a potential biomarker for dosing of renally excreted drugs. Br J Clin Pharmacol 80:20–27. doi: 10.1111/bcp.12602. [DOI] [PMC free article] [PubMed] [Google Scholar]
- 25.Gullberg E, Cao S, Berg OG, Ilbäck C, Sandegren L, Hughes D, Andersson DI. 2011. Selection of resistant bacteria at very low antibiotic concentrations. PLoS Pathog 7:e1002158. doi: 10.1371/journal.ppat.1002158. [DOI] [PMC free article] [PubMed] [Google Scholar]
- 26.De Smet J, Boussery K, Colpaert K, De Sutter P, De Paepe P, Decruyenaere J, Van Bocxlaer J. 2009. Pharmacokinetics of fluoroquinolones in critical care patients: a bio-analytical HPLC method for the simultaneous quantification of ofloxacin, ciprofloxacin and moxifloxacin in human plasma. J Chromatogr B Analyt Technol Biomed Life Sci 877:961–967. doi: 10.1016/j.jchromb.2009.02.039. [DOI] [PubMed] [Google Scholar]
- 27.Bauer R. 2010. NONMEM users guide: introduction to NONMEM 7. ICON Development Solutions, Ellicott City, MD. [Google Scholar]
- 28.Lindbom L, Pihlgren P, Jonsson N. 2005. PsN-toolkit—a collection of computer intensive statistical methods for non-linear mixed effect modeling using NONMEM. Comput Methods Programs Biomed 79:241–257. doi: 10.1016/j.cmpb.2005.04.005. [DOI] [PubMed] [Google Scholar]
- 29.Pirana software. 2015. Pirana installation guide and manual. http://pirana-software.com/pub/docs/Manual.pdf.
- 30.Schaefer HG, Stass H, Wedgwood J, Hampel B, Fischer C, Kuhlmann J, Schaad UB. 1996. Pharmacokinetics of ciprofloxacin in pediatric cystic fibrosis patients. Antimicrob Agents Chemother 40:29–34. [DOI] [PMC free article] [PubMed] [Google Scholar]
- 31.Anderson BJBJ, Holford NHGN. 2008. Mechanism-based concepts of size and maturity in pharmacokinetics. Annu Rev Pharmacol Toxicol 48:303–332. doi: 10.1146/annurev.pharmtox.48.113006.094708. [DOI] [PubMed] [Google Scholar]
- 32.Wählby U, Bouw MR, Jonsson EN, Karlsson MO. 2002. Assessment of type I error rates for the statistical sub-model in NONMEM. J Pharmacokinet Pharmacodyn 29:251–269. doi: 10.1023/A:1020254823597. [DOI] [PubMed] [Google Scholar]
- 33.Efron B. 1987. Better bootstrap confidence intervals. J Am Stat Assoc 82:171–185. doi: 10.1080/01621459.1987.10478410. [DOI] [Google Scholar]
- 34.Portier K, Keith Tolson J, Roberts SM. 2007. Body weight distributions for risk assessment. Risk Anal 27:11–26. doi: 10.1111/j.1539-6924.2006.00856.x. [DOI] [PubMed] [Google Scholar]
Associated Data
This section collects any data citations, data availability statements, or supplementary materials included in this article.


