Optimal doses for antituberculosis (anti-TB) drugs in children have yet to be established. In 2010, the World Health Organization (WHO) recommended revised dosages of the first-line anti-TB drugs for children.
KEYWORDS: population pharmacokinetics, children, first-line anti-TB drugs, WHO revised dosages, Ghana
ABSTRACT
Optimal doses for antituberculosis (anti-TB) drugs in children have yet to be established. In 2010, the World Health Organization (WHO) recommended revised dosages of the first-line anti-TB drugs for children. Pharmacokinetic (PK) studies that investigated the adequacy of the WHO revised dosages to date have yielded conflicting results. We performed population PK modeling using data from one of these studies to identify optimal dosage ranges. Ghanaian children with tuberculosis on recommended therapy with rifampin (RIF), isoniazid (INH), pyrazinamide (PZA), and ethambutol (EMB) for at least 4 weeks had blood samples collected predose and at 1, 2, 4, and 8 hours postdose. Drug concentrations were determined by validated liquid chromatography-mass spectrometry methods. Nonlinear mixed-effects models were applied to describe the population PK of those drugs using MonolixSuite2016R1 (Lixoft, France). Bayesian estimation was performed, the correlation coefficient, bias, and precision between the observed and predicted areas under the concentration-time curve (AUCs) were calculated, and Bland-Altman plots were analyzed. The population PK of RIF and PZA was described by a one-compartment model and that for INH and EMB by a two-compartment model. Plasma maximum concentration (Cmax) and AUC targets were based on published results for children from India. The lowest target values for pediatric TB patients were attainable at the WHO-recommended dosage schedule for RIF and INH, except for N-acetyltransferase 2 non-slow acetylators (rapid and intermediate acetylators) in the lower-weight bands. However, higher published adult targets were not attainable for RIF and INH. The targets were not achieved for PZA and EMB. (This study has been registered at ClinicalTrials.gov under identifier NCT01687504.)
INTRODUCTION
Tuberculosis (TB) is a major cause of childhood morbidity and mortality. In 2016 there were an estimated 1.04 million new cases of TB in children, 210,000 TB deaths among human immunodeficiency virus (HIV)-negative children, and an additional 52,000 TB deaths among those with HIV coinfection (1). While delayed diagnosis and treatment are major causes of mortality, death or treatment failure during anti-TB treatment may be due to suboptimal drug concentrations. Optimizing the dosages of anti-TB drugs in children is challenging given the lack of reliable pediatric pharmacokinetic-pharmacodynamic (PK-PD) data to inform dosing decisions. Previously, the recommended dosages of the anti-TB drugs in children were the same in milligrams per kilogram of body weight as for adults. Given reported concerns about low concentrations of the anti-TB drugs in children (2–8), the World Health Organization (WHO) recommended revised dosages (ranges) as follows in 2010: rifampin (RIF), 15 (10 to 20) mg/kg; isoniazid (INH), 10 (10 to 15) mg/kg; pyrazinamide (PZA), 35 (30 to 40) mg/kg; and ethambutol (EMB), 20 (15 to 25) mg/kg (9). In 2014, the dosing guidelines were updated with a change in isoniazid dosage range to 7 to 15 mg/kg, with the higher end of the dosage aimed at younger children (10).
With the implementation of the WHO revised dosages of the anti-TB drugs for children, PK studies that examined the adequacy of the dosages based on proposed reference ranges in adults (11) have reported conflicting results (12–15). One study found that the WHO 2010 revised dosages achieved target plasma maximum concentrations (Cmax) for RIF, INH, and PZA in a vast majority of South African children aged <2 years (15). In contrast, one study among children aged ≤10 years treated according to the WHO 2010 revised dosages reported low 2-hour-postdose concentrations (C-2 h) of RIF, EMB, and PZA in 94%, 85%, and 45% of the children, respectively (13), while another among infants who were treated according to the WHO 2010 guidelines reported low RIF Cmax in all the participants and low EMB Cmax in 94% of participants (12). In the largest study published to date, we found that a majority of Ghanaian children treated according to the 2014 WHO recommendations achieved Cmax of INH and PZA on the revised dosages, but 60% of the participants had low RIF or EMB Cmax (16). In this study, we used the data from our previously published studies (16, 17) to develop a model for the population pharmacokinetics of the 4 drugs in children, as well as simulations to predict dosage ranges for each weight band that could achieve desired plasma concentration targets in children.
RESULTS
Patient characteristics.
Of the 113 study participants, 63 (55.8%) were male, 59 (52.2%) were HIV positive, 51 (45.1%) were N-acetyltransferase 2 (NAT2) slow acetylators, and 24 (21.2%) were less than 2 years old (Table 1). The median (interquartile range [IQR]) age and weight were 5.00 (2.17 to 8.25) years and 14.3 (9.70 to 20.1) kg, respectively (Table 1). Except for pyrazinamide, the median drug dosages were within the range of WHO 2010 revised dosages. The simulation was performed according to the weight bands in accord with the WHO recommendation (Table 1).
TABLE 1.
Demographics of children with TB
| Characteristic | No. or median value (IQR) |
|---|---|
| Total no. of patients | 113 |
| Age (yr) | 5.00 (2.17–8.25) |
| Wt (kg) | 14.3 (9.70–20.1) |
| Serum creatinine (μmol/liter) | 36.0 (27.3–47.8) |
| Sex | |
| Male | 63 |
| Female | 50 |
| HIV infection | |
| Positive | 59 |
| Negative | 54 |
| NAT2 genotype | |
| Slow | 51 |
| Intermediate | 50 |
| Fast | 12 |
| Dose (mg/kg) | |
| Rifampin | 15.8 (13.6–18.8) |
| Isoniazid | 11.0 (9.06–12.8) |
| Pyrazinamide | 24.7 (22.6–29.7) |
| Ethambutol | 16.8 (15.0–20.3) |
| Wt band (kg) in simulation (n) | |
| 5–7 (16,000) | Wt (kg): 6.45 (6.17–7.25) |
| Age (yr): 0.960 (0.650–1.42) | |
| 8–14 (41,000) | Wt (kg): 12.5 (10.1–13.4) |
| Age (yr): 4.00 (2.17–5.00) | |
| 15–20 (27,000) | Wt (kg): 17.7 (16.0–19.5) |
| Age (yr): 6.50 (5.25–8.92) | |
| 21–30 (21,000) | Wt (kg): 22.4 (21.9–24.2) |
| Age (yr): 9.83 (8.25–11.92) |
RIF.
A total of 558 concentration-time data points for rifampin (RIF), including 7 missing values, were available, and concentrations below 0.117 μg/ml (n = 115) were left-censored and analyzed using the stochastic approximation of expectation-maximization (SAEM) algorithm. Two improbable points were removed. As a preliminary result using a noncompartmental analysis (NCA), the median of dose was 15.79 mg/kg (IQR, 13.64 to 18.75), the Cmax was 6.50 μg/ml (IQR, 4.92 to 8.79), and the area under the concentration-time curve from 0 to 8 h (AUC0–8) was 25.95 mg · h/liter (IQR, 19.06 to 34.83) (see Table S1 in the supplemental material). There were no significant differences in Cmax, AUC0–8, apparent oral clearance (CL/F), and volume of distribution (V/F) according to age, in spite of the higher dose for children younger than 2 years old (see Table S2 in the supplemental material). The population pharmacokinetics of RIF was described using a one-compartment model with sequential zero- and first-order absorption and first-order elimination (Table 2). In this model, about 9% was explained by zero-order absorption. The diagonal covariance and the combined residual error model were selected based on the objective function values (OFV) such as a negative log likelihood (−2LL) (Table 2). Applying allometric scaling for CL/F and V/F to body weight (kg) improved the goodness-of-fit plots. The fixed exponents were 0.75 for CL/F and 1.0 for V/F. During the assessment of the covariates tested, the single nucleotide polymorphisms (SNPs) of solute carrier organic anion transporter 1B1 (SLCO1B1) c.388A→G (*1b) was detected as a significant covariate. Indeed, the AUC0–8 and Cmax of two patients with the *1b homozygous variant (GG genotype) were lower, and the CL/F was significantly higher, than those of patients with the wild type (AA genotype) in the NCA and post hoc test, but we did not include it as a covariate, taking account of the small number of children.
TABLE 2.
Parameter estimates for the final population pharmacokinetic models for rifampin and isoniazida
| Drug | Parameterb | Estimate (RSE, %) | IIV (% CV) |
|---|---|---|---|
| Rifampin | Fr (proportion) | 0.0878 (34) | 1.08 (148.7) |
| Tk0 (h) | 0.342 (19) | 0.914 (114.3) | |
| ka (h−1) | 0.645 (14) | 0.464 (49) | |
| V/F (liters) | 13.8 (10) | 0.217 (22) | |
| CL/F (liters/h) | 7.53 (5) | 0.547 (59.1) | |
| Constant a | 0.0476 (14) | ||
| Slope b | 0.202 (7) | ||
| Isoniazid | ka (h−1) | 4.23 (6) | 0.567 (61.6) |
| CL/Fslow (liters/h) | 4.44 (5) | 0.324 (33.3) | |
| CL/Fnonslow (liters/h) | 8.08 (6) | 0.48 (50.9) | |
| V1/F (liters) | 16.6 (4) | 0.241 (24.5) | |
| Q/F (liters/h) | 8.46 (21) | 0.637 (70.7) | |
| V2/F (liters) | 1.07 (44) | 1.9 (599.7) | |
| Constant a | 0.0393 (19) | ||
| Slope b | 0.193 (6) |
All pharmacokinetic parameters are expressed as median (relative standard error [RSE]). IIV, interindividual variability; CV, coefficient of variation.
The residual error modes used in this study consist of the slope b and constant a. The equations are y = f + bfε (proportional) and y = f + (a + bf)ε (combined 1), where f is the structural model and ε is the residual error standardized by Gaussian random variables.
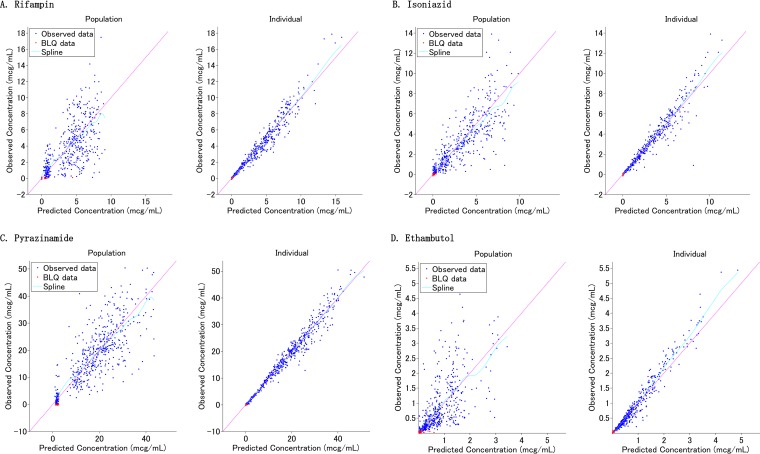
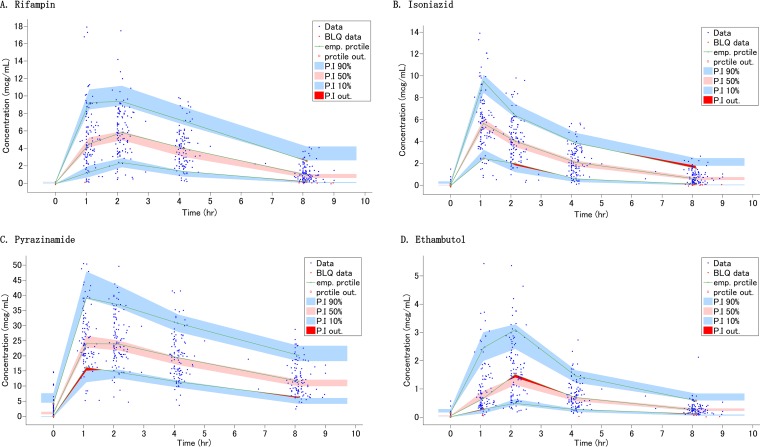
The goodness-of-fit plots and visual predictive check (VPC) indicate that the population pharmacokinetics of RIF in children is adequately described by the final model (Fig. 1 and 2). Given that clinically, one or two sampling times are typical, the Bayesian estimation using samples at 2 and 8 h was considered the best approach based on the correlation coefficients, bias, and precision (see Fig. S1 and Table S3 in the supplemental material).
FIG 1.
Goodness-of-fit plots for the final population pharmacokinetic models. (A) Rifampin; (B) isoniazid; (C) pyrazinamide; (D) ethambutol. Left panels, population predicted concentrations versus observed concentrations. Right panels, individual predicted concentrations versus observed concentrations.
FIG 2.
Visual predictive check for each drug concentration versus time based on 1,000 Monte Carlo simulations. (A) Rifampin; (B) isoniazid; (C) pyrazinamide; (D) ethambutol. The solid green lines represent the 10th, 50th, and 90th percentiles of observed data. The shaded regions represent the 90% confidence interval around the 10th, 50th, and 90th percentiles of simulated data. The blue circles are observed concentrations, and red areas show the outlier of prediction.
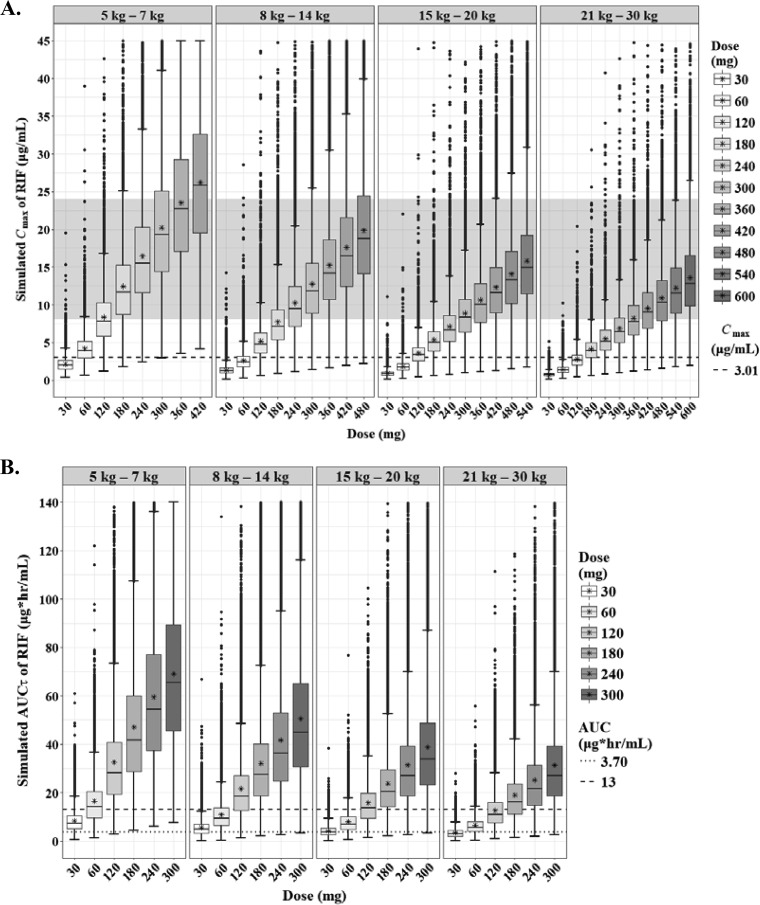
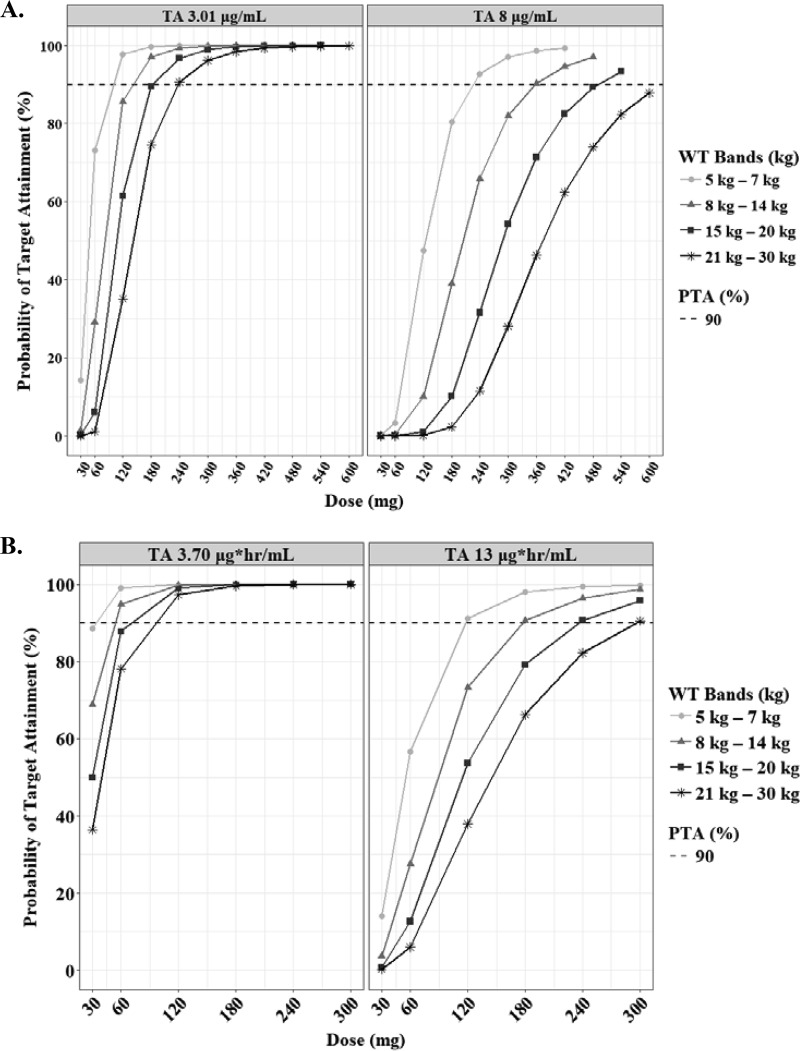
The predicted steady-state interval AUC (AUCτ) and Cmax of RIF according to the weight bands are shown in Fig. 3. In the evaluation of target attainment, a modest Cmax of 3.01 μg/ml was achievable at 120 mg, 180 mg, 240 mg, and 240 mg in each weight band from 5 kg to 30 kg (Table 3) (18). Similar doses were chosen to achieve an AUC of 13 mg · h/liter. An of AUC 3.70 mg · h/liter was attainable at lower doses than the WHO revised dosage. However, the lower limits of the normal Cmax range in adults (8 μg/ml), which are associated with long-term outcomes in adults, were attainable only at doses higher than the WHO-recommended dosage in children (≥30 mg/kg in each weight band) (Fig. 4).
FIG 3.
Box-and-whisker plots of simulated steady-state Cmax (A) and AUCτ (B) of rifampin according to the weight bands. Each box shows the 25th to 75th percentile of the PK parameters. The bar inside box represents median and asterisk indicates mean of the simulated values. The normal range of Cmax (8 to 24 μg/ml) is highlighted in gray. The dashed lines represent target values.
TABLE 3.
Dose recommendations based on the results from this study compared with the WHO revised dosagesa
| Drug | Target (value) | Wt band (kg) | NAT2 genotype | Dose achieving 90% TA |
WHO revised dosage (mg) in: |
||
|---|---|---|---|---|---|---|---|
| mg | mg/kg | 2010 | 2014 | ||||
| Rifampin | Cmax (3.01 μg/ml) | 5–7 | 120 | 18.6 | 120 | 60–120 | |
| 8–14 | 180 | 14.4 | 180 | 120–180 | |||
| 15–20 | 240 | 13.6 | 300 | 240–300 | |||
| 21–30 | 240 | 10.7 | 420 | 300 | |||
| AUC0–24 (3.70 mg · h/liter) | 5–7 | 60 | 9.3 | 120 | 60–120 | ||
| 8–14 | 60 | 4.8 | 180 | 120–180 | |||
| 15–20 | 120 | 6.8 | 300 | 240–300 | |||
| 21–30 | 120 | 5.4 | 420 | 300 | |||
| Isoniazid | Cmax (3 μg/ml) | 5–7 | All | 60 | 9.3 | 90 | 30–60 |
| 8–14 | All | 90 | 7.2 | 120 | 60–90 | ||
| 15–20 | All | 120 | 6.8 | 210 | 120–150 | ||
| 21–30 | All | 210 | 9.4 | 270 | 150 | ||
| AUC0–24 (11.95 mg · h/liter) | 5–7 | Nonslow | 120 | 18.5 | 90 | 30–60 | |
| 8–14 | Nonslow | 210 | 17.1 | 120 | 60–90 | ||
| 15–20 | Nonslow | 270 | 14.8 | 210 | 120–150 | ||
| 21–30 | Nonslow | 270 | 12.2 | 270 | 150 | ||
| 5–7 | Slow | 60 | 9.4 | 90 | 30–60 | ||
| 8–14 | Slow | 90 | 7.2 | 120 | 60–90 | ||
| 15–20 | Slow | 120 | 6.9 | 210 | 120–150 | ||
| 21–30 | Slow | 210 | 8.7 | 270 | 150 | ||
| Pyrazinamide | Cmax (20 μg/ml) | 5–7 | 300 | 46.5 | 150 | 150–300 | |
| 8–14 | 450 | 36.0 | 300 | 300–450 | |||
| 15–20 | 450 | 25.4 | 450 | 600–750 | |||
| 21–30 | 600 | 26.8 | 800 | 750 | |||
| Cmax (38.1 μg/ml) | 5–7 | 450 | 69.8 | 150 | 150–300 | ||
| 8–14 | 800 | 64.0 | 300 | 300–450 | |||
| 15–20 | 900 | 50.8 | 450 | 600–750 | |||
| 21–30 | 1,050 | 46.9 | 800 | 750 | |||
| Ethambutol | Cmax (2 μg/ml) | 5–7 | 400 | 62.0 | 100 | 100–200 | |
| 8–14 | 550 | 44.0 | 200 | 200 | |||
| 15–20 | 550 | 31.1 | 300 | 300–400 | |||
| 21–30 | 550 | 24.6 | 550 | 400 | |||
NAT2, N-acetyltransferase 2 gene; TA, target attainment.
FIG 4.
Probabilities of achieving each Cmax (A) and AUCτ (B) in simulated subjects treated with rifampin. Each target value has been reported previously, as indicated in Materials and Methods. The target attainment was performed based on the following weight bands: 5 to 7 kg (circles), 8 to 14 kg (triangles), 15 to 20 kg (squares), and 21 to 30 kg (asterisks). The dashed lines represent 90% of target attainment.
INH.
A total of 561 concentration-time data points for isoniazid (INH), including 4 missing values, were available, and concentrations of less than 0.1 μg/ml (n = 109) were left-censored and analyzed using the SAEM algorithm. In the preliminary NCA, the median dose was 10.99 mg/kg (IQR, 9.06 to 12.80), the Cmax was 5.70 μg/ml (IQR, 4.27 to 7.47), and the AUC0–8 was 19.44 mg · h/liter (IQR, 13.29 to 24.95) (Table S1). Younger children, in particular children less than 2 years old, tended to have lower CL/F and V/F in the post hoc test (Table S2). The population pharmacokinetics of INH was described using a two-compartment model with first-order absorption and linear elimination (Table 2). The diagonal covariance and the combined residual error model were selected based on the OFV. The absorption rate constant (ka) was capped with 6.0 when selecting the base model. Applying allometric scaling for CL/F and V/F to body weight (kg) improved the goodness-of-fit plots. The fixed exponents were 0.75 for CL/F and clearance between compartments (Q/F) and 1.0 for V1/F and V2/F. Among the covariates tested, NAT2 genotype was detected as a significant covariate for clearance. In light of the findings obtained from NCA that there were no significant differences in half-life (t1/2), CL/F, and AUC0–8 between NAT2 fast and intermediate genotypes, those were combined and named the nonslow group (Table S1). The goodness-of-fit plots and VPC indicate that the population pharmacokinetics of INH in children is well described by the final model (Fig. 1 and 2). When limiting the sampling time points to two, the Bayesian estimations using samples at 1 and 8 h or at 2 and 8 h were considered equally good approaches, based on the correlation coefficients, bias, and precision (Fig. S1 and Table S3).
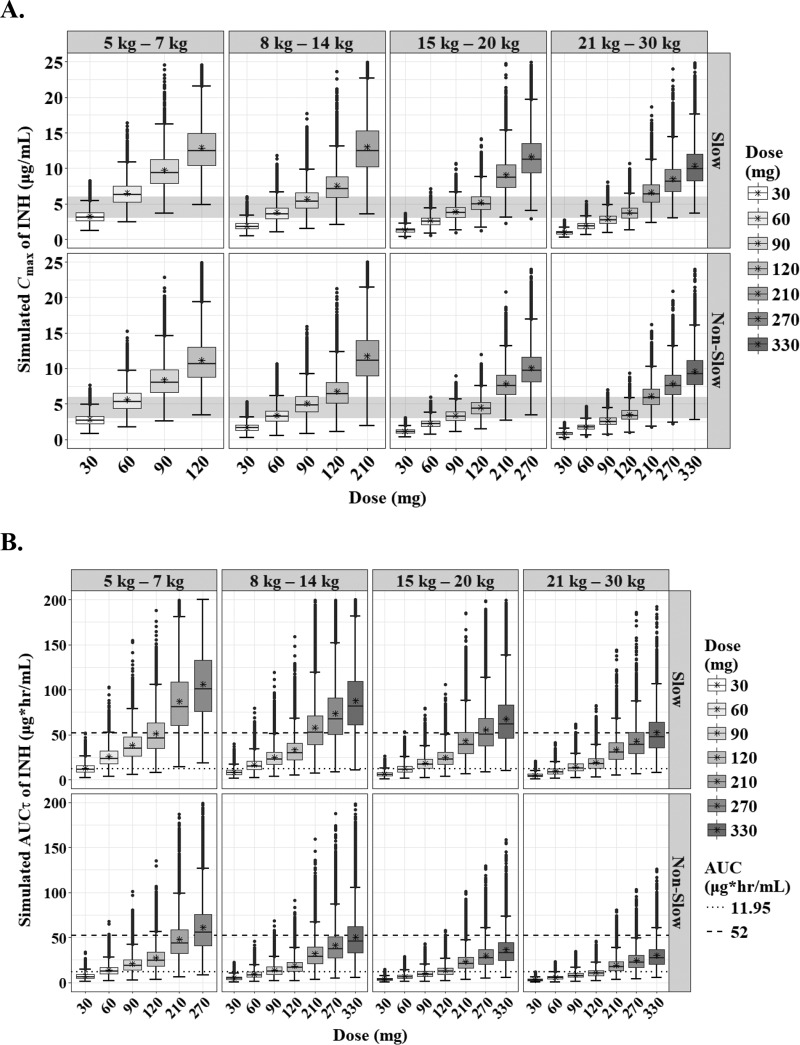
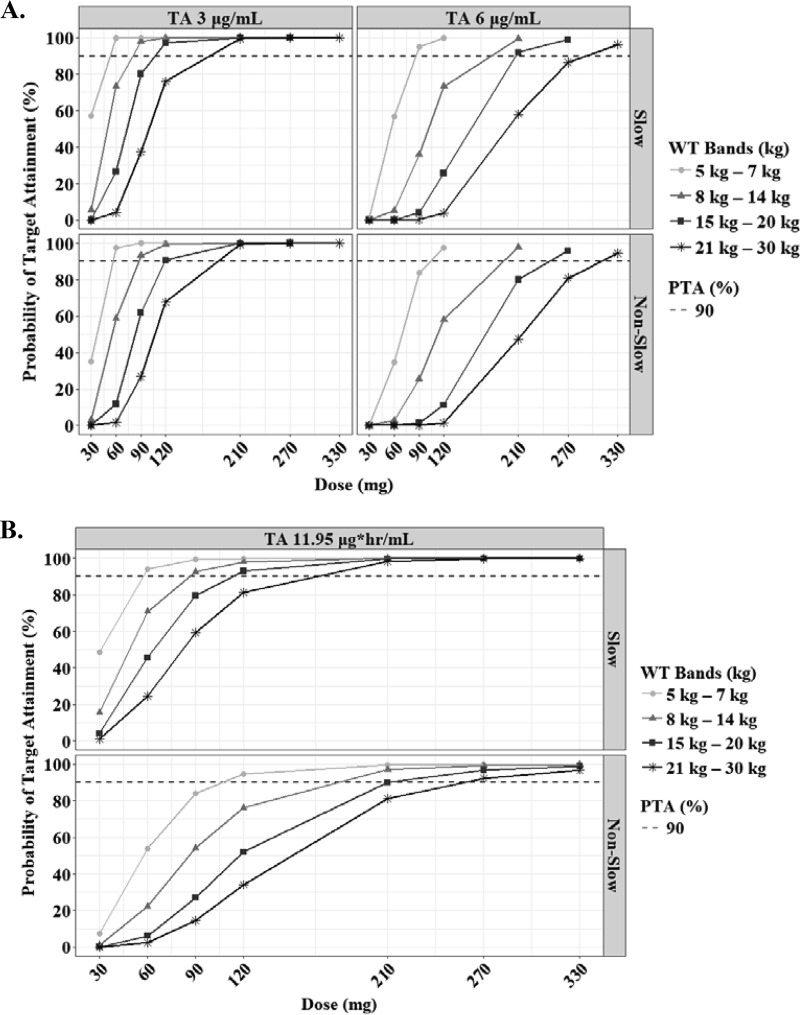
The predicted steady-state AUCτ and Cmax of INH according to the weight bands and NAT2 genotypes are shown in Fig. 5. The target attainment analysis showed that the lower limit of normal Cmax (3 μg/ml) in adults was achievable at 60 mg, 90 mg, 120 mg, and 210 mg in each weight band from 5 kg to 30 kg (Table 3). An AUC0–24 of 11.95 mg · h/liter, which is related to treatment failure in Indian children, especially those younger than 3 years, was achievable in slow acetylators at the same doses above, but for rapid acetylators, higher doses are necessary to attain the target value (12 to 18 mg/kg, depending on the weight band) (Fig. 6; Table 3) (18).
FIG 5.
Box-and-whisker plots of simulated steady-state Cmax (A) and AUCτ (B) of isoniazid according to the weight bands and NAT2 genotypes (slow and nonslow). Each box shows the 25th to 75th percentile of the PK parameters. The bar inside each box represents the median, and the asterisk indicates the mean of the simulated values. The normal range of Cmax (3 to 6 μg/ml) is highlighted in gray. The dashed lines represent target values.
FIG 6.
Probabilities of achieving each Cmax (A) and AUCτ (B) in simulated subjects treated with isoniazid. Each target value has been reported previously, as indicated in Materials and Methods. The target attainment was performed based on the following weight bands: 5 to 7 kg (circles), 8 to 14 kg (triangles), 15 to 20 kg (squares), and 21 to 30 kg (asterisks). The dashed lines represent 90% of target attainment.
PZA.
A total of 542 concentration-time data points for pyrazinamide (PZA), including 3 missing values, were available, and concentrations of less than 0.2 μg/ml (n = 17) were left-censored and analyzed using the SAEM algorithm. Three children having only values that were below the limit of quantification (BLQ) and one child whose peak concentration was not observed were excluded. In the preliminary NCA, the median dose was 24.76 mg/kg (IQR, 22.51 to 30.24), the Cmax was 26.05 μg/ml (IQR, 21.72 to 34.85), and the AUC0–8 was 141.88 mg · h/liter (IQR, 112.26 to 183.42) (Table S1). While there were no significant differences in CL/F and V/F according to age, the Cmax and AUC0–8 for children younger than 12 years were significantly lower than those for adolescents (≥12 years) (Table S2). The population pharmacokinetics of PZA was described by a one-compartment model with transit compartment absorption and first-order elimination (Table 4). The number of transit compartments was about 3. The diagonal covariance and the combined residual error model were selected based on the OFV. Applying allometric scaling for CL/F and V/F to body weight (kg) improved the goodness-of-fit plots. The fixed exponents were 0.735 for CL/F and 0.677 for V/F. The goodness-of-fit plots and VPC indicate that the population pharmacokinetics of PZA in children is sufficiently described by the final model (Fig. 1 and 2). When limiting the sampling time points to two, the Bayesian estimations using samples at 4 and 8 h were considered equally the best approach (Fig. S1 and Table S3).
TABLE 4.
Parameter estimates of the final population pharmacokinetic models for pyrazinamide and ethambutola
| Drug | Parameterb | Estimate (RSE, %) | IIV (% CV) |
|---|---|---|---|
| Pyrazinamide | MTT (h) | 0.33 (9) | 0.443 (46.6) |
| Ktr (h−1) | 12.5 (11) | 0.455 (48.0) | |
| N | 3.13 | ||
| ka (h−1) | 5.28 (7) | 2.05 (811.5) | |
| V/F (liters) | 13.1 (4) | 0.37 (38.3) | |
| Exponent (BW on V/F) | 0.677 (11) | Fixed | |
| CL/F (liters/h) | 1.6 (4) | 0.385 (40.0) | |
| Exponent (BW on CL/F) | 0.735 (10) | Fixed | |
| Constant a | 0.268 (23) | ||
| Slope b | 0.112 (7) | ||
| Ethambutol | Tlag (h) | 0.723 (7) | 0.174 (17.5) |
| Tk0 (h) | 0.9 (16) | 0.605 (66.5) | |
| CL/F (liters/h) | 32.5 (5) | 0.458 (48.3) | |
| Exponent (BW on CL/F) | 0.382 (24) | Fixed | |
| V1/F (liters) | 112 (7) | 0.607 (66.7) | |
| Exponent (BW on V1/F) | 0.228 (84) | Fixed | |
| Q/F (liters/h) | 15.4 (10) | 0.274 (27.9) | |
| Exponent (BW on Q/F) | 0.474 (44) | Fixed | |
| V2/F (liters) | 97.8 (8) | 0.31 (31.8) | |
| Exponent (BW on V2/F) | 0.858 (60) | Fixed | |
| Slope b | 0.272 (6) |
All pharmacokinetic parameters are expressed as median (relative standard error [RSE]). IIV, interindividual variability; CV, coefficient of variability; BW, body weight. MTT, mean transit time.
The residual error modes used in this study consist of the slope b and constant a. The equations are y = f + bfε (proportional) and y = f + (a + bf) ε (combined 1), where f is the structural model and ε is the residual error standardized by Gaussian random variables. The mean transit time was calculated as follows: MTT = (N + 1)/Ktr, where N and Ktr represent the number of compartments and transit rate constant, respectively.
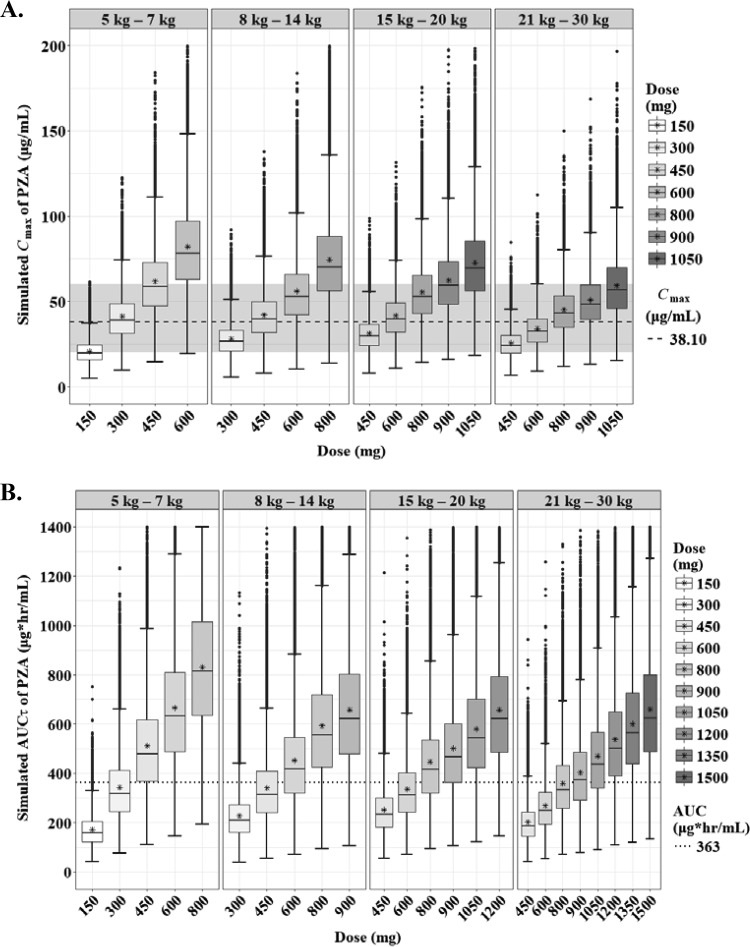
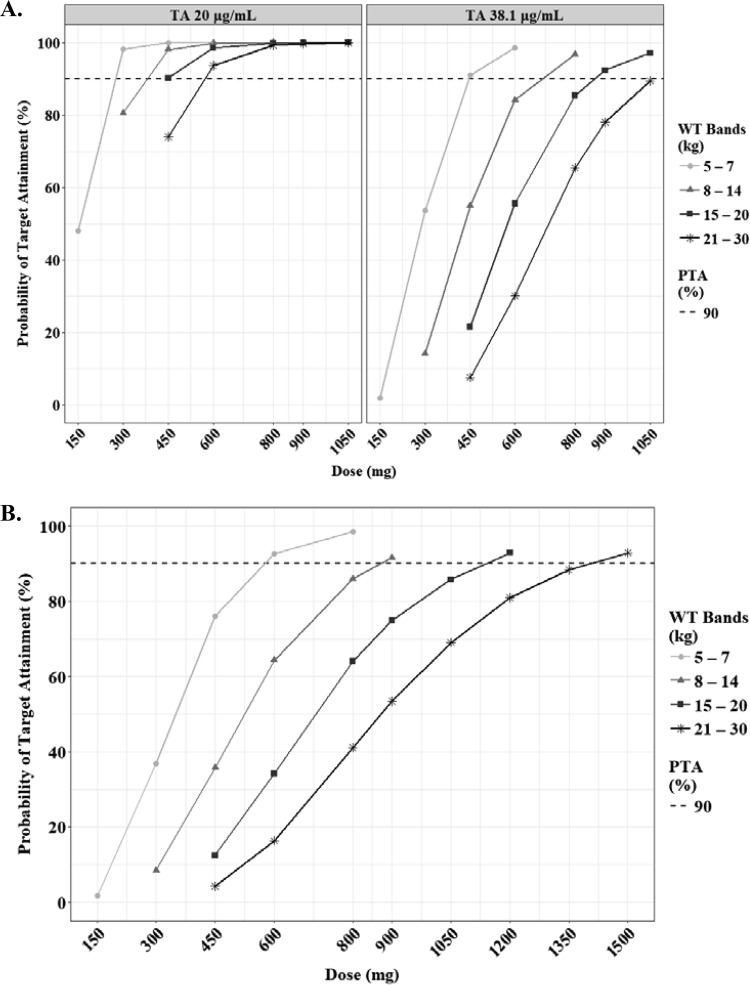
The predicted steady-state AUCτ and Cmax of PZA according to the weight bands are shown in Fig. 7. Several target values for adults and children have been proposed (18–20). Assuming that the WHO-recommended dosage according to the weight bands is used, a Cmax of 38.1 μg/ml, which is related to treatment failure in Indian children, was achievable only at higher doses than the WHO revised dosage, namely, 450 mg, 800 mg, 900 mg, and 1050 mg in each weight band from 5 kg to 30 kg (Table 3). The lower limit of Cmax (20 μg/ml) was attainable at 300 mg, 450 mg, 450 mg, and 600 mg in each weight band (Fig. 8A; Table 3).
FIG 7.
Box-and-whisker plots of simulated steady-state Cmax (A) and AUCτ (B) of pyrazinamide according to the weight bands. Each box shows the 25th to 75th percentile of the PK parameters. The bar inside each box represents the median, and the asterisk indicates the mean of the simulated values. The normal range of Cmax (20 to 60 μg/ml) is highlighted in gray. The dashed lines represent target values.
FIG 8.
Probabilities of achieving each Cmax (A) and AUCτ (B) in simulated subjects treated with pyrazinamide. Each target value has been reported previously, as indicated in Materials and Methods. The target attainment was performed based on the following weight bands: 5 to 7 kg (circles), 8 to 14 kg (triangles), 15 to 20 kg (squares), and 21 to 30 kg (asterisks). The dashed lines represent 90% of target attainment. The target AUCτ is 363 μg · h/ml.
EMB.
A total of 547 concentration-time data points for ethambutol (EMB), including 3 missing values, were available, and concentrations of less than 0.085 μg/ml (n = 48) were left-censored and analyzed using the SAEM algorithm. Three children having only BLQ values were considered a malabsorption group and excluded. Of note, two of them were less than 2 years old. The median dose was 16.67 mg/kg (IQR, 15.04 to 20.17), the Cmax was 1.67 μg/ml (IQR, 0.88 to 2.68), and the AUC0–8 was 5.79 mg · h/liter (IQR, 3.58 to 8.92) (Table S1). These PK parameters, calculated by NCA, were quite comparable to those published for Malawian children (21). Even though the median values for CL/F and V/F varied among the age bands, there were no significant differences in those according to age (Table S2). Importantly, the Cmax and AUC0–8 for children younger than 2 years were significantly lower than those for children older than 2 years (Table S2). The population pharmacokinetics of EMB was described by a two-compartment model with zero-order absorption, lag time, and first-order elimination (Table 4). The diagonal covariance and the proportional residual error model were selected based on the OFV. Fixed allometric scaling exponents of 0.382 for CL/F, 0.474 for Q/F, 0.228 for V1/F, and 0.858 for V2/F improved the goodness-of-fit plots and the distribution PK parameters. By adding lag time into the base model, the OFV decreased by 55.9. Among the covariates tested, HIV infection status was detected as a significant covariate on V1/F, but we did not add the effect into the final model based on the small reduction of OFV. The goodness-of-fit plots and VPC indicate that the population pharmacokinetics of EMB in children is adequately described by the final model (Fig. 1 and 2). When limiting the sampling time points to two, the Bayesian estimation using samples at 2 and 8 h was the best approach, like for RIF (Fig. S1 and Table S3).
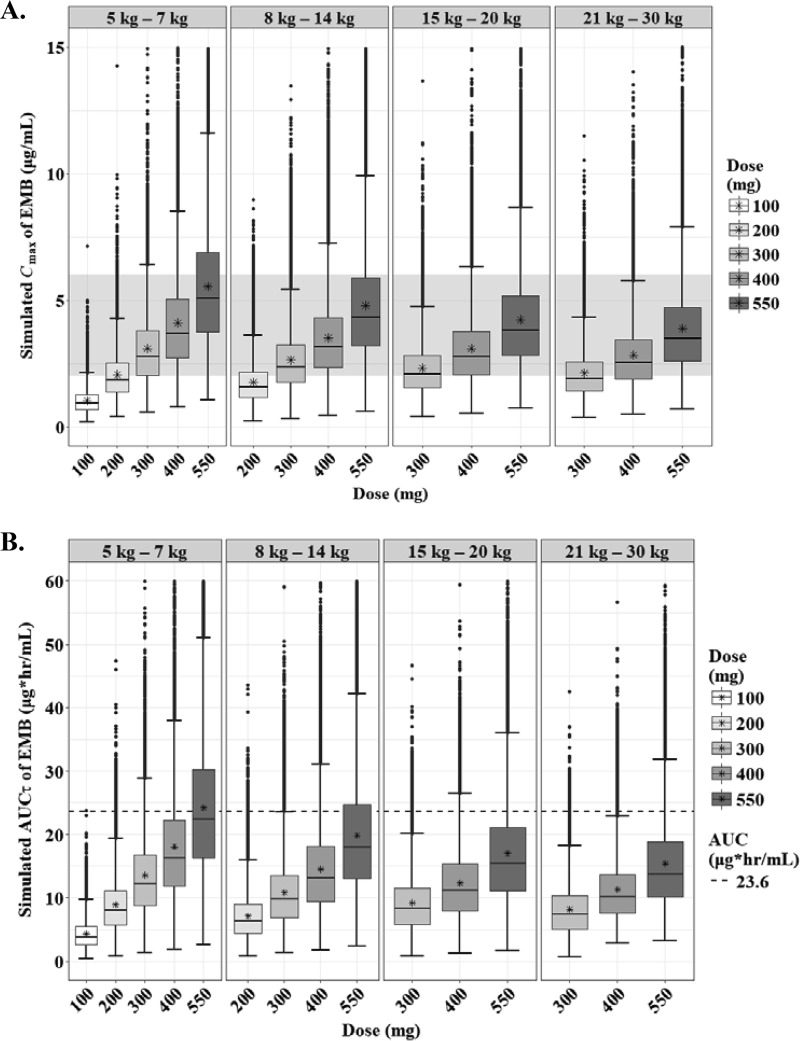
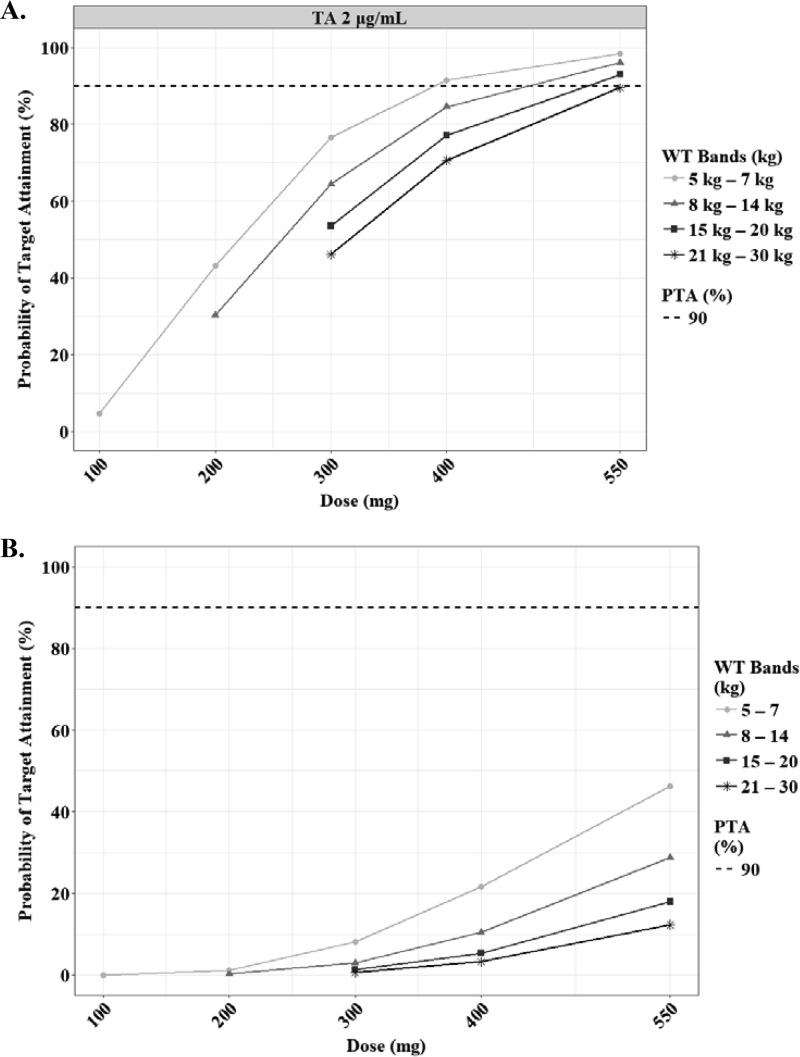
The predicted steady-state AUCτ and Cmax of EMB according to the weight bands are shown in Fig. 9. As seen with the NCA, the exposure of EMB in children was quite low, regardless of their weight, compared to that in adults (Table S2) (22, 23). To our knowledge, there are no target values described for pediatric TB patients, so we used the range of normal Cmax in adults as the cutoff values for the target. The lower limit of Cmax (2 μg/ml) was attainable at 400 mg, 550 mg, 550 mg, and 550 mg in each weight band from 5 kg to 30 kg (Fig. 10; Table 3).
FIG 9.
Box-and-whisker plots of simulated steady-state Cmax (A) and AUCτ (B) of ethambutol according to the weight bands. Each box shows the 25th to 75th percentile of the PK parameters. The bar inside each box represents the median, and the asterisk indicates the mean of the simulated values. The normal range of Cmax (2 to 6 μg/ml) is highlighted in gray. The dashed lines represent target values.
FIG 10.
Probabilities of achieving each Cmax (A) and AUCτ (B) in simulated subjects treated with ethambutol. Each target value has been reported previously, as indicated in Materials and Methods. The target attainment was performed based on the following weight bands: 5 to 7 kg (circles), 8 to 14 kg (triangles), 15 to 20 kg (squares), and 21 to 30 kg (asterisks). The dashed lines represent 90% of target attainment. The target AUCτ is 23.6 μg · h/ml.
DISCUSSION
We aimed to develop population-based PK models to assist the optimization of dosages and treatment outcomes for children with TB, including neonates and infants. There was high between-child variability of PK profiles of the drugs. Several PK models in children with TB have been reported (18, 22, 24). As previously reported, applying allometric scaling to the models was crucial to describe the pediatric population pharmacokinetics more precisely (25, 26). Consistent with the previous reports published in 2014, the number of compartments was one for RIF and PZA and two for INH (Tables 2 and 4) (24). Interestingly, after comparing different absorption models of RIF and INH, the selected models based on the OFVs were different from published models using a first-order conditional estimation method with ε-η interaction (FOCE INTER) algorithm. We found that the absorption phase of RIF was adequately described using a sequential zero- and first-order absorption model. In children, including neonates and infants, the growth and maturation of the absorption varied widely according to age and other intrinsic factors (27). This complicated absorption process can be affected by gastric pH, SLCO1B1, and intestinal cytochrome P450 (CYP) 3A4 (28–30).
For INH and PZA, the first-order and transit compartment absorption models were selected, respectively, similarly to in previous reports (18, 24). INH is generally absorbed fairly quickly from the gastrointestinal tract, and the absorption is slowed by food in adults (31). In our patients, delayed absorption (time to reach Cmax [Tmax] of >3 h) of INH was not observed. Serum concentrations of INH in children have been reported to be lower than those in adults and to be affected by the NAT2 genotype (5, 32). This enzyme is trimodally distributed, and individuals are classified as slow, intermediate, and fast acetylators (33). The average concentration varied not only in children compared to adults but also across genotypes (7). As expected, the Cmax and AUC0–∞ values were significantly higher in the slow acetylators, and the PK parameters such as CL/F and elimination rate constant (kel) values were higher in fast acetylators, similar to those in adults (see Table S1 in the supplemental material) (23). Further, the median of simulated AUCτ values for the slow-acetylator group was about 1.8 higher than those for the non-slow-acetylator groups (data not shown). These results suggest that genotype-guided dosing can help prevent treatment failure and undesirable side effects (34). In accordance with the previous study, HIV infection status was not a covariate on the PK parameters of INH in children with TB (7).
In the current study, delayed absorption of PZA (Tmax of >3 h) was observed in 6 children (5.31%), but there was no relationship between the delay and lower drug exposure, considering the Cmax and AUC0–8 values. Intriguingly, the PZA Cmax and AUC0–8 values were significantly lower in younger children, especially those younger than 2 years, similar to the results in Malawian children (see Table S2 in the supplemental material) (3). Four children (3.54%) were classified as a malabsorption group and were removed from the model building. Previously, we reported that the absorption of PZA is likely to be incomplete or delayed in children with TB compared with adults (35, 36). These findings suggest that therapeutic drug monitoring (TDM) of PZA in children is effective for the early detection of low systemic exposure, which may be related to treatment failure and cause drug resistance.
The best pediatric model for EMB was similar to prior models for adults administered EMB as a component of the standard four-drug regimen in the United States (37). Regarding the absorption phase of EMB, binding or chelating activity in the gastrointestinal tract has been reported (38). Also, EMB absorption may be affected by uptake transporters, not simply passive diffusion, given EMB's low permeability into enterocytes (39). Recently, EMB has been reported to be a substrate of organic cation transporters (OCTs), multidrug and toxin extrusion proteins (MATEs), and P-gp (40, 41). OCTs are known as uptake transporters expressed in various epithelial cells, such as intestine, liver, and lungs (30). On the other hand, PZA inhibits OCT1-mediated metformin uptake at 12.3 μg/ml (100 μM), and the 50% inhibitory concentration (IC50) has been reported to be 3.17 μg/ml (25.8 μM), which is clinically achievable in the treatment of tuberculosis using the standard regimen (42). These results imply that the influence of other combined drugs on the absorption of EMB can explain the unusual absorption mechanism and short lag time. Moreover, we reported delayed absorption (Tmax of >3 h) in children compared to adults, which suggests that drug uptake transporters may be immature in children, especially in neonates and infants (22). In fact, Tmax values for 13 children (11.5%) were longer than 3 h. Similar to the case for PZA, the exposure of EMB in younger children was remarkably low, and in particular, the median Cmax and AUC0–8 in the youngest age band were as low as 0.74 μg/ml and 3.15 mg · h/liter, respectively (Table S2).
To date, several target values have been suggested to predict treatment outcomes for adults and children (18–20, 43–45). The main predictors of treatment failure have been a PZA peak concentration of <38.10 mg/liter and a RIF Cmax of <3.01 mg/liter in Indian children (18). This RIF value is considerably lower than standard target values and substantially lower than seen in recent high-dose RIF studies. In addition, increased risk of death has been associated with a RIF AUC0–24 of ≤3.70 mg · h/liter and PZA peak of ≤37.49 mg/liter (18). An INH AUC0–24 of 11.95 mg · h/liter has been identified as a threshold for treatment outcomes for children <3 years old (18). Additionally, the published normal ranges for Cmax in adults can be proposed as the target values (19, 43). As shown in Table 3, the upper end of the WHO-recommended doses for RIF (12 to 20 mg/kg, depending on the weight band) is sufficient to achieve the proposed targets of a Cmax of 3.01 μg/ml and an AUC0–24 of 3.70 mg · h/liter. For INH, the WHO-recommended doses are sufficient to attain a Cmax of 3.01 μg/ml in children, while slightly higher doses (10 to 20 mg/kg, depending on the weight band) are needed to meet an AUC0–24 of 11.95 mg · h/liter for rapid acetylators. Compared with the WHO revised dosage, higher doses (25 to 50 mg/kg or 45 to 70 mg/kg) of PZA are required, especially in lower weight bands, to achieve a Cmax of 20 μg/ml or 38.1 μg/ml, respectively. In this study, we set a tentative target value (Cmax of 2 μg/ml) of EMB derived from a normal blood concentration in adults, but higher doses (25 to 60 mg/kg) are needed to meet that compared with the WHO-recommended dosage. Therefore, higher doses for PZA and EMB should be tested, while being mindful of potential hepatotoxicity and optic neuritis (46, 47).
There is a limitation to our findings. The simulations of Cmax and AUCs were performed based on the WHO-recommended weight band strategy for children, but children whose weight is less than 5 kg or greater than 30 kg were not included because of the limited number of samples.
In conclusion, the population pharmacokinetics of first-line anti-TB drugs for children with TB were well described by the final models we established. Taking account of weight, age, and NAT2 genotypes was crucial to explain the interpatient variability in the treatment of pediatric TB. Suboptimal concentrations may be attributed to incomplete and/or delayed absorption. Further studies are warranted to determine the target values of Cmax and AUC, especially, for PZA and EMB, and to clarify the mechanisms of drug disposition in more detail for the development of optimal dosing in childhood TB.
MATERIALS AND METHODS
Study population and design.
Children aged 3 months to 14 years old with active tuberculosis (TB) and with or without human immunodeficiency virus (HIV) coinfection for whom informed consent was provided by a parent or guardian were enrolled at Komfo Anokye Teaching Hospital (KATH) in Ghana between October 2012 and August 2015 as previously reported (17). The Institutional Review Boards (IRBs) of KATH, Ghana, and of Life Span Hospitals, Providence, Rhode Island, reviewed and approved the study. All parents or guardians of study participants provided signed informed consent. The study was registered with ClinicalTrials.gov under identifier NCT01687504.
Anti-TB treatment regimen and drug dosages.
The treatment regimen using revised dosage recommendations (9) consisted of isoniazid (INH) at 7 to 15 mg/kg, pyrazinamide (PZA) at 30 to 40 mg/kg, and ethambutol (EMB) at 15 to 25 mg/kg daily for 2 months and then INH at 7 to 15 mg/kg and RIF at 10 to 20 mg/kg daily for 4 months. The medications were dosed according to the World Health Organization (WHO) guidelines for using available dispersible fixed-dose combination (FDC) TB medicines for children (48). At the beginning of the study and prior to the adoption of the WHO-recommended elevated dosages of the drugs in Ghana, 11 children received the old recommended dosages of INH and RIF. The medications were swallowed or dispersed in water in a plastic cup and ingested. Dosing was observed by a health care worker during hospitalization and by a family member at home. Seven days prior to pharmacokinetic (PK) sampling, parents or caregivers of patients were called on the phone to verify that medications were administered and time of ingestion documented.
PK sampling and analysis.
PK sampling was performed after at least 4 weeks of anti-TB treatment as previously described (14). Blood samples were collected at 0 h (predose) and at 1, 2, 4, and 8 hours after observed dosing in the hospital. The samples, collected in EDTA-coated tubes, were immediately placed on ice and centrifuged within 30 min at 3,000 × g for 10 min. Plasma was stored at −80°C until shipment on dry ice to the University of Cape Town, Cape Town, South Africa, for drug concentrations assays. Drug concentrations were determined using validated liquid chromatography-tandem mass spectrometry (LC-MS/MS) methods. The methods were validated over the concentration ranges 0.0977 to 26 μg/ml (INH), 0.117 to 30 μg/ml (RIF), 0.20 to 80 μg/ml (PZA), and 0.0844 to 5.46 μg/ml (EMB). The mean percent accuracies (precision estimates) for each analytical method over the analytical period were 105.1% (6.47%), 103.9% (6.56%), 100.2% (9.28%) and 102.4% (7.52%) for INH, RIF, PZA, and EMB, respectively.
Arylamine N-acetyltransferase 2 (NAT2) genotyping.
Genotyping for NAT2 single nucleotide polymorphisms (SNPs) rs1801279 (191G→A), rs1801280 (341T→C), rs1799930 (590G→A), and rs1799931 (857G→A) was performed using validated TaqMan real-time PCR assays. Samples homozygous wild type for all SNPs were classified as rapid genotype, those heterozygous for any one of the SNPs were classified as intermediate genotype, and those homozygous variant for one or more SNPs or heterozygous for two or more SNPs were classified as slow acetylator genotype according established criteria (49).
NCA according to age.
R version 3.4.0 with RStudio was used for noncompartmental analysis (NCA). R packages “PKNCA,” “pkr,” and “lattice” were utilized to calculate the PK parameters, such as Cmax and AUCs, and to plot the results. Values below the limit of quantification (BLQ) at time zero were transformed to zero, and other BLQ values were removed from the analysis. The linear-up/log-down setting was used to calculate AUCs. In cases where the last three points were not available for calculating elimination rate constants (kel), only the last two points were used. R package “Hmisc” was used to classify the data according to age, namely, age bands 0 to 1 years, 2 to 5 years, 6 to 11 years, and 12 to 14 years. Descriptive statistics were summarized using R package “psych.” The results are available in Tables S1 and S2 in the supplemental material.
Model building.
Nonlinear mixed-effects models were applied to describe the population PK of the drugs using MonolixSuite2016R1 (Lixoft, France) (50). First, the number of compartments was determined based on the objective function values (OFVs). The residual error model was selected by means of the diagnostic tool among constant, proportional, exponential, or combined error models. The correlation matrix of the random effects was obtained from the inverse of the Fisher information matrix and the Jacobian matrix. Seven absorption models, i.e., zero- and first-order with or without lag time, sequential zero- and first-order, simultaneous zero- and first-order, and transit compartment models, were considered and assessed depending on the OFVs and goodness-of-fit plots. After building the tentative base model, allometric scaling was evaluated using the empirically reported or estimated values (26). The following covariates were tested to develop the final models: weight, age, sex, dosage, HIV infection status, estimated glomerular filtration rate (eGFR) calculated by the Schwarz equation, and SNPs such as NAT2 for INH and solute carrier organic anion transporter 1B1 (SLCO1B1) genotypes for RIF. Datxplore (Lixoft, France) and R were utilized for analyzing the patient characteristics. There were no significant correlations between covariates based on the chi-square tests, correlation ratios, and locally weighted scatter-plot smoothing (LOESS) curves, except for that between age and weight. The correlation coefficient was 0.89. Also, each dose (mg) was adjusted by weight in accordance with the WHO guidelines, and then the correlations between doses and weight were observed. In the process of exploring covariates for the model, forward addition with a P value of 0.1 and backward elimination with a P value of 0.05 were performed in a stepwise manner.
Bayesian estimation and Bland-Altman plot.
We simulated the time-concentration profile for 1,130 virtual patients. The demographics for the patient in the virtual data set were identical to those in the original data set. Among 113 children, 55.8% were male, 52.2% were HIV positive, 45.1% were NAT2 slow acetylators, and 21.2% were less than 2 years old. After simulation, an interval area under the concentration-time curve (AUCτ) was calculated using R package “PKNCA,” and this was regarded as the observed AUC. The individual apparent oral clearance (CL/F) was estimated with the PK parameters fixed at the values obtained from the final model using a data set including one or two sample points in accordance with the actual drawn time, i.e., predose and 1, 2, 4, and 8 hours postdose. Bayesian estimation was obtained from the equation P(θ∣x) = p(x∣θ) × p(θ)/p(x), where the posterior probability [P(θ∣x)] of a PK parameter θ, given the data (x or measured concentration in a patient), is proportional to the product of the likelihood of the data [p(x∣θ)] with the prior probability of the parameter p(θ). Using the estimated CL/F and dose, the predicted AUCτ was calculated by a simple equation (51). As a validation of this strategy, the correlation coefficient, bias, and precision between the observed and predicted AUCs were calculated, and the Bland-Altman plots were described using R package “ggplot2.”
Simulation and target attainment.
The final model was used to simulate the steady-state AUC and Cmax according to the weight bands 5 to 7 kg, 8 to 14 kg, 15 to 20 kg, and 21 to 30 kg, assuming that the WHO-recommended dispersible and normal tablets for children were used once daily (17). The available doses were 60 mg and 150 mg for RIF, 30 mg and 75 mg for INH, 150 and 400 mg for PZA, and 100 and 275 mg for EMB. The patient demographics used in the simulation were the same as those used for the development of the final models. Their characteristics according to the weight bands were replicated 1,000 times, and their concentrations from time zero to time 24, in 0.5-h increments, were simulated using the final model. Each AUCτ and Cmax was calculated using the R package “PKNCA.” The simulated Cmax values were compared with the normal ranges in adults (RIF, 8 to 24 μg/ml; INH, 3 to 6 μg/ml; PZA, 20 to 60 μg/ml; and EMB, 2 to 6 μg/ml) or the target values previously reported (18, 19, 43). For INH, the box plots were prepared according to NAT2 genotypes (slow versus nonslow). Finally, we estimated the probabilities of achieving the published target AUCs and Cmax values in simulated subjects (20, 44, 45). Based on prior publications, Cmax target values were set at 3.01 μg/ml for RIF and 35 μg/ml and 38.1 μg/ml for PZA. For AUC0–24, the target values were set at 3.70 mg · h/liter and 13 mg · h/liter for RIF, 11.95 mg · h/liter, and 52 mg · h/liter for INH, and 363 mg · h/liter for PZA.
Statistical analysis.
R packages “psych” and “Hmisc” were used for descriptive statistics. Outliers were detected by the Grubbs test function in R package “outliers.” Bartlett's test, analysis of variance (ANOVA), the Kruskal-Wallis test, and the Tukey-Kramer method were carried out using the original R functions. The Scheffe test was performed by means of the R package “agricolae.”
Supplementary Material
ACKNOWLEDGMENTS
We thank the study participants and the supportive staff of the TB and HIV clinics at KATH who helped with patient enrollment. We also thank the pharmacokinetic study staff for their assistance with data collection and specimen handling and processing.
All authors report no conflicts of interest.
This work was supported primarily by the Eunice Kennedy Shriver National Institute of Child Health and Human Development of the National Institutes of Health (grant number HD071779). The pharmacokinetic laboratory at the University of Cape Town is supported by the National Institute of Allergy and Infectious Diseases of the National Institutes of Health (under award numbers UM1 AI068634, UM1 AI068636, and UM1 AI106701) under the auspices of the Adult Clinical Trial Group. H.Y. utilized core services and support from the University of Rochester Center for AIDS Research (CFAR), an NIH-funded program (P30 AI078498).
The content is solely the responsibility of the authors and does not necessarily represent the official views of the National Institutes of Health.
Footnotes
Supplemental material for this article may be found at https://doi.org/10.1128/AAC.00008-18.
REFERENCES
- 1.WHO. 2017. Global tuberculosis report 2017. World Health Organization, Geneva, Switzerland: http://www.who.int/tb/publications/global_report/MainText_13Nov2017.pdf?ua=1. [Google Scholar]
- 2.Donald PR, Maher D, Maritz JS, Qazi S. 2006. Ethambutol dosage for the treatment of children: literature review and recommendations. Int J Tuberc Lung Dis 10:1318–1330. [PubMed] [Google Scholar]
- 3.Graham SM, Bell DJ, Nyirongo S, Hartkoorn R, Ward SA, Molyneux EM. 2006. Low levels of pyrazinamide and ethambutol in children with tuberculosis and impact of age, nutritional status, and human immunodeficiency virus infection. Antimicrob Agents Chemother 50:407–413. doi: 10.1128/AAC.50.2.407-413.2006. [DOI] [PMC free article] [PubMed] [Google Scholar]
- 4.Hussels H, Kroening U, Magdorf K. 1973. Ethambutol and rifampicin serum levels in children: second report on the combined administration of ethambutol and rifampicin. Pneumonologie 149:31–38. doi: 10.1007/BF02179950. [DOI] [PubMed] [Google Scholar]
- 5.McIlleron H, Willemse M, Werely CJ, Hussey GD, Schaaf HS, Smith PJ, Donald PR. 2009. Isoniazid plasma concentrations in a cohort of South African children with tuberculosis: implications for international pediatric dosing guidelines. Clin Infect Dis 48:1547–1553. doi: 10.1086/598192. [DOI] [PubMed] [Google Scholar]
- 6.Schaaf HS, Willemse M, Cilliers K, Labadarios D, Maritz JS, Hussey GD, McIlleron H, Smith P, Donald PR. 2009. Rifampin pharmacokinetics in children, with and without human immunodeficiency virus infection, hospitalized for the management of severe forms of tuberculosis. BMC Med 7:19. doi: 10.1186/1741-7015-7-19. [DOI] [PMC free article] [PubMed] [Google Scholar]
- 7.Schaaf HS, Parkin DP, Seifart HI, Werely CJ, Hesseling PB, van Helden PD, Maritz JS, Donald PR. 2005. Isoniazid pharmacokinetics in children treated for respiratory tuberculosis. Arch Dis Child 90:614–618. doi: 10.1136/adc.2004.052175. [DOI] [PMC free article] [PubMed] [Google Scholar]
- 8.Verhagen LM, Lopez D, Hermans PW, Warris A, de Groot R, Garcia JF, de Waard JH, Aarnoutse RE. 2012. Pharmacokinetics of anti-tuberculosis drugs in Venezuelan children younger than 16 years of age: supportive evidence for the implementation of revised WHO dosing recommendations. Trop Med Int Health 17:1449–1456. doi: 10.1111/tmi.12003. [DOI] [PubMed] [Google Scholar]
- 9.WHO. 2010. Rapid advice: treatment of tuberculosis in children. World Health Organization, Geneva, Switzerland. [PubMed] [Google Scholar]
- 10.WHO. 2014. Guidance for national tuberculosis programmes on the management of tuberculosis in children, 2nd ed WHO/HTM/TB/2014.03.1-146 World Health Organization, Geneva, Switzerland. [PubMed] [Google Scholar]
- 11.Peloquin CA. 2002. Therapeutic drug monitoring in the treatment of tuberculosis. Drugs 62:2169–2183. doi: 10.2165/00003495-200262150-00001. [DOI] [PubMed] [Google Scholar]
- 12.Bekker A, Schaaf HS, Draper HR, van der Laan L, Murray S, Wiesner L, Donald PR, McIlleron HM, Hesseling AC. 2016. Pharmacokinetics of rifampin, isoniazid, pyrazinamide, and ethambutol in infants dosed according to revised WHO-recommended treatment guidelines. Antimicrob Agents Chemother 60:2171–2179. doi: 10.1128/AAC.02600-15. [DOI] [PMC free article] [PubMed] [Google Scholar]
- 13.Hiruy H, Rogers Z, Mbowane C, Adamson J, Ngotho L, Karim F, Gumbo T, Bishai W, Jeena P. 2015. Subtherapeutic concentrations of first-line anti-TB drugs in South African children treated according to current guidelines: the PHATISA study. J Antimicrob Chemother 70:1115–1123. doi: 10.1093/jac/dku478. [DOI] [PMC free article] [PubMed] [Google Scholar]
- 14.Kwara A, Enimil A, Gillani FS, Yang H, Sarfo AM, Dompreh A, Ortsin A, Osei-Tutu L, Kwarteng Owusu S, Wiesner L, Norman J, Kurpewski J, Peloquin CA, Ansong D, Antwi S. 2016. Pharmacokinetics of first-line antituberculosis drugs using WHO revised dosage in children with tuberculosis with and without HIV coinfection. J Pediatric Infect Dis Soc 5:356–365. doi: 10.1093/jpids/piv035. [DOI] [PMC free article] [PubMed] [Google Scholar]
- 15.Thee S, Seddon JA, Donald PR, Seifart HI, Werely CJ, Hesseling AC, Rosenkranz B, Roll S, Magdorf K, Schaaf HS. 2011. Pharmacokinetics of isoniazid, rifampin, and pyrazinamide in children younger than two years of age with tuberculosis: evidence for implementation of revised World Health Organization recommendations. Antimicrob Agents Chemother 55:5560–5567. doi: 10.1128/AAC.05429-11. [DOI] [PMC free article] [PubMed] [Google Scholar]
- 16.Yang H, Enimil A, Gillani FS, Antwi S, Dompreh A, Ortsin A, Awhireng EA, Owusu M, Wiesner L, Peloquin CA, Kwara A. 2017. Evaluation of the adequacy of the 2010 revised World Health Organization recommended dosages of the first-line antituberculosis drugs for children. Pediatr Infect Dis J doi: 10.1097/INF.0000000000001687. [DOI] [PMC free article] [PubMed] [Google Scholar]
- 17.Antwi S, Yang H, Enimil A, Sarfo AM, Gillani FS, Ansong D, Dompreh A, Orstin A, Opoku T, Bosomtwe D, Wiesner L, Norman J, Peloquin CA, Kwara A. 2017. Pharmacokinetics of the first-line antituberculosis drugs in Ghanaian children with tuberculosis with or without HIV coinfection. Antimicrob Agents Chemother 61:e01701-16. doi: 10.1128/AAC.01701-16. [DOI] [PMC free article] [PubMed] [Google Scholar]
- 18.Swaminathan S, Pasipanodya JG, Ramachandran G, Hemanth Kumar AK, Srivastava S, Deshpande D, Nuermberger E, Gumbo T. 2016. Drug concentration thresholds predictive of therapy failure and death in children with tuberculosis: bread crumb trails in random forests. Clin Infect Dis 63:S63–S74. doi: 10.1093/cid/ciw471. [DOI] [PMC free article] [PubMed] [Google Scholar]
- 19.Tappero JW, Bradford WZ, Agerton TB, Hopewell P, Reingold AL, Lockman S, Oyewo A, Talbot EA, Kenyon TA, Moeti TL, Moffat HJ, Peloquin CA. 2005. Serum concentrations of antimycobacterial drugs in patients with pulmonary tuberculosis in Botswana. Clin Infect Dis 41:461–469. doi: 10.1086/431984. [DOI] [PubMed] [Google Scholar]
- 20.Pasipanodya JG, McIlleron H, Burger A, Wash PA, Smith P, Gumbo T. 2013. Serum drug concentrations predictive of pulmonary tuberculosis outcomes. J Infect Dis 208:1464–1473. doi: 10.1093/infdis/jit352. [DOI] [PMC free article] [PubMed] [Google Scholar]
- 21.Mlotha R, Waterhouse D, Dzinjalamala F, Ardrey A, Molyneux E, Davies GR, Ward S. 2015. Pharmacokinetics of anti-TB drugs in Malawian children: reconsidering the role of ethambutol. J Antimicrob Chemother 70:1798–1803. doi: 10.1093/jac/dkv039. [DOI] [PMC free article] [PubMed] [Google Scholar]
- 22.Zhu M, Burman WJ, Starke JR, Stambaugh JJ, Steiner P, Bulpitt AE, Ashkin D, Auclair B, Berning SE, Jelliffe RW, Jaresko GS, Peloquin CA. 2004. Pharmacokinetics of ethambutol in children and adults with tuberculosis. Int J Tuberc Lung Dis 8:1360–1367. [PubMed] [Google Scholar]
- 23.Denti P, Jeremiah K, Chigutsa E, Faurholt-Jepsen D, PrayGod G, Range N, Castel S, Wiesner L, Hagen CM, Christiansen M, Changalucha J, McIlleron H, Friis H, Andersen AB. 2015. Pharmacokinetics of isoniazid, pyrazinamide, and ethambutol in newly diagnosed pulmonary TB patients in Tanzania. PLoS One 10:e0141002. doi: 10.1371/journal.pone.0141002. [DOI] [PMC free article] [PubMed] [Google Scholar]
- 24.Zvada SP, Denti P, Donald PR, Schaaf HS, Thee S, Seddon JA, Seifart HI, Smith PJ, McIlleron HM, Simonsson US. 2014. Population pharmacokinetics of rifampicin, pyrazinamide and isoniazid in children with tuberculosis: in silico evaluation of currently recommended doses. J Antimicrob Chemother 69:1339–1349. doi: 10.1093/jac/dkt524. [DOI] [PMC free article] [PubMed] [Google Scholar]
- 25.Meibohm B, Laer S, Panetta JC, Barrett JS. 2005. Population pharmacokinetic studies in pediatrics: issues in design and analysis. AAPS J 7:E475–E487. doi: 10.1208/aapsj070248. [DOI] [PMC free article] [PubMed] [Google Scholar]
- 26.Anderson BJ, Holford NH. 2008. Mechanism-based concepts of size and maturity in pharmacokinetics. Annu Rev Pharmacol Toxicol 48:303–332. doi: 10.1146/annurev.pharmtox.48.113006.094708. [DOI] [PubMed] [Google Scholar]
- 27.FDA. 2014. Guidance for industry general clinical pharmacology considerations for pediatric studies for drugs and biological products. https://www.fda.gov/downloads/drugs/guidances/ucm425885.pdf Accessed 1 October 2017.
- 28.Lu H, Rosenbaum S. 2014. Developmental pharmacokinetics in pediatric populations. J Pediatr Pharmacol Ther 19:262–276. doi: 10.5863/1551-6776-19.4.262. [DOI] [PMC free article] [PubMed] [Google Scholar]
- 29.Panchagnula R, Agrawal S. 2004. Biopharmaceutic and pharmacokinetic aspects of variable bioavailability of rifampicin. Int J Pharm 271:1–4. doi: 10.1016/j.ijpharm.2003.11.031. [DOI] [PubMed] [Google Scholar]
- 30.Roth M, Obaidat A, Hagenbuch B. 2012. OATPs, OATs and OCTs: the organic anion and cation transporters of the SLCO and SLC22A gene superfamilies. Br J Pharmacol 165:1260–1287. doi: 10.1111/j.1476-5381.2011.01724.x. [DOI] [PMC free article] [PubMed] [Google Scholar]
- 31.Alsultan A, Peloquin CA. 2014. Therapeutic drug monitoring in the treatment of tuberculosis: an update. Drugs 74:839–854. doi: 10.1007/s40265-014-0222-8. [DOI] [PubMed] [Google Scholar]
- 32.Peloquin CA, Jaresko GS, Yong CL, Keung AC, Bulpitt AE, Jelliffe RW. 1997. Population pharmacokinetic modeling of isoniazid, rifampin, and pyrazinamide. Antimicrob Agents Chemother 41:2670–2679. [DOI] [PMC free article] [PubMed] [Google Scholar]
- 33.Parkin DP, Vandenplas S, Botha FJ, Vandenplas ML, Seifart HI, van Helden PD, van der Walt BJ, Donald PR, van Jaarsveld PP. 1997. Trimodality of isoniazid elimination: phenotype and genotype in patients with tuberculosis. Am J Respir Crit Care Med 155:1717–1722. doi: 10.1164/ajrccm.155.5.9154882. [DOI] [PubMed] [Google Scholar]
- 34.Azuma J, Ohno M, Kubota R, Yokota S, Nagai T, Tsuyuguchi K, Okuda Y, Takashima T, Kamimura S, Fujio Y, Kawase I, Pharmacogenetics-Based Tuberculosis Therapy Research Group. 2013. NAT2 genotype guided regimen reduces isoniazid-induced liver injury and early treatment failure in the 6-month four-drug standard treatment of tuberculosis: a randomized controlled trial for pharmacogenetics-based therapy. Eur J Clin Pharmacol 69:1091–1101. doi: 10.1007/s00228-012-1429-9. [DOI] [PMC free article] [PubMed] [Google Scholar]
- 35.Zhu M, Starke JR, Burman WJ, Steiner P, Stambaugh JJ, Ashkin D, Bulpitt AE, Berning SE, Peloquin CA. 2002. Population pharmacokinetic modeling of pyrazinamide in children and adults with tuberculosis. Pharmacotherapy 22:686–695. doi: 10.1592/phco.22.9.686.34067. [DOI] [PubMed] [Google Scholar]
- 36.Roy V, Tekur U, Chopra K. 1999. Pharmacokinetics of pyrazinamide in children suffering from pulmonary tuberculosis. Int J Tuberc Lung Dis 3:133–137. [PubMed] [Google Scholar]
- 37.Peloquin CA, Bulpitt AE, Jaresko GS, Jelliffe RW, Childs JM, Nix DE. 1999. Pharmacokinetics of ethambutol under fasting conditions, with food, and with antacids. Antimicrob Agents Chemother 43:568–572. [DOI] [PMC free article] [PubMed] [Google Scholar]
- 38.Lee CS, Gambertoglio JG, Brater DC, Benet LZ. 1977. Kinetics of oral ethambutol in the normal subject. Clin Pharmacol Ther 22:615–621. doi: 10.1002/cpt1977225part1615. [DOI] [PubMed] [Google Scholar]
- 39.Shugarts S, Benet LZ. 2009. The role of transporters in the pharmacokinetics of orally administered drugs. Pharm Res 26:2039–2054. doi: 10.1007/s11095-009-9924-0. [DOI] [PMC free article] [PubMed] [Google Scholar]
- 40.Te Brake LH, van den Heuvel JJ, Buaben AO, van Crevel R, Bilos A, Russel FG, Aarnoutse RE, Koenderink JB. 2016. Moxifloxacin is a potent in vitro inhibitor of OCT- and MATE-mediated transport of metformin and ethambutol. Antimicrob Agents Chemother 60:7105–7114. doi: 10.1128/AAC.01471-16. [DOI] [PMC free article] [PubMed] [Google Scholar]
- 41.Hartkoorn RC, Chandler B, Owen A, Ward SA, Bertel Squire S, Back DJ, Khoo SH. 2007. Differential drug susceptibility of intracellular and extracellular tuberculosis, and the impact of P-glycoprotein. Tuberculosis (Edinb) 87:248–255. doi: 10.1016/j.tube.2006.12.001. [DOI] [PubMed] [Google Scholar]
- 42.Parvez MM, Kaisar N, Shin HJ, Jung JA, Shin JG. 2016. Inhibitory interaction potential of 22 antituberculosis drugs on organic anion and cation transporters of the SLC22A family. Antimicrob Agents Chemother 60:6558–6567. doi: 10.1128/AAC.01151-16. [DOI] [PMC free article] [PubMed] [Google Scholar]
- 43.Heifets LB, Cynamon MH. 1991. Drug susceptibility in the chemotherapy of mycobacterial infections. CRC Press, Boca Raton, FL. [Google Scholar]
- 44.Donald PR, Parkin DP, Seifart HI, Schaaf HS, van Helden PD, Werely CJ, Sirgel FA, Venter A, Maritz JS. 2007. The influence of dose and N-acetyltransferase-2 (NAT2) genotype and phenotype on the pharmacokinetics and pharmacodynamics of isoniazid. Eur J Clin Pharmacol 63:633–639. doi: 10.1007/s00228-007-0305-5. [DOI] [PubMed] [Google Scholar]
- 45.Alsultan A, Savic R, Dooley KE, Weiner M, Whitworth W, Mac Kenzie WR, Peloquin CA, Tuberculosis Trials Consortium. 2017. Population pharmacokinetics of pyrazinamide in patients with tuberculosis. Antimicrob Agents Chemother 61:e02625-16. doi: 10.1128/AAC.02625-16. [DOI] [PMC free article] [PubMed] [Google Scholar]
- 46.Donald PR, Maritz JS, Diacon AH. 2011. The pharmacokinetics and pharmacodynamics of rifampicin in adults and children in relation to the dosage recommended for children. Tuberculosis (Edinb) 91:196–207. doi: 10.1016/j.tube.2011.02.004. [DOI] [PubMed] [Google Scholar]
- 47.Donald PR. 2011. Antituberculosis drug-induced hepatotoxicity in children. Pediatr Rep 3:e16. doi: 10.4081/pr.2011.e16. [DOI] [PMC free article] [PubMed] [Google Scholar]
- 48.WHO. 2009. Dosing instructions for the use of currently available fixed-dose combination TB medicines for children. World Health Organization, Geneva, Switzerland: http://www.who.int/tb/challenges/interim_paediatric_fdc_dosing_instructions_sept09.pdf Accessed 29 September 2016. [Google Scholar]
- 49.Hein DW, Doll MA. 2012. Accuracy of various human NAT2 SNP genotyping panels to infer rapid, intermediate and slow acetylator phenotypes. Pharmacogenomics 13:31–41. doi: 10.2217/pgs.11.122. [DOI] [PMC free article] [PubMed] [Google Scholar]
- 50.Lavielle M, Mentre F. 2007. Estimation of population pharmacokinetic parameters of saquinavir in HIV patients with the MONOLIX software. J Pharmacokinet Pharmacodyn 34:229–249. doi: 10.1007/s10928-006-9043-z. [DOI] [PMC free article] [PubMed] [Google Scholar]
- 51.Alsultan A, An G, Peloquin CA. 2015. Limited sampling strategy and target attainment analysis for levofloxacin in patients with tuberculosis. Antimicrob Agents Chemother 59:3800–3807. doi: 10.1128/AAC.00341-15. [DOI] [PMC free article] [PubMed] [Google Scholar]
Associated Data
This section collects any data citations, data availability statements, or supplementary materials included in this article.


