
Figure 1.
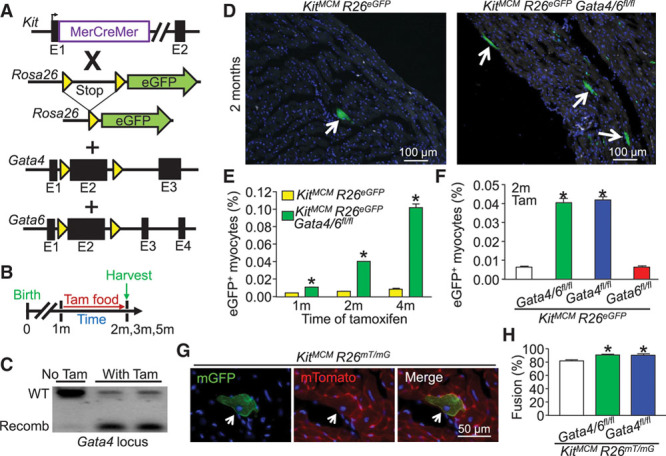
Kit allele-lineage deletion of Gata4/6 and Gata4 alone leads to increased lineage-traced cardiomyocytes attributable to fusion. A, Genetic models with the indicated alleles in mice that were crossed. B, Experimental design of the protocol used in this figure. C, PCR showing recombination (recomb) of the Gata4 locus with tamoxifen treatment to activate the MerCreMer protein (n=2) or untreated that did not show recombination (n=1) in KitMCM Gata4/6fl/fl R26eGFP mice. The analysis used Kit lineage tracing in which eGFP+ bone marrow cells were first collected. D, Immunofluorescent images of cardiac histological sections from Kit allele lineage–traced mice with and without Gata4/6 deletion. Arrows indicate eGFP+ cardiomyocytes. E, Time-course quantification of the percentage of eGFP+ cardiomyocytes within the entire heart in response to Gata4/6 deletion. Error bars are SEM, n=4 per group (10 sections per heart). *P<0.05 vs. KitMCM R26eGFP at each time point. F, Comparative quantitation of the percentage of eGFP+ cardiomyocytes within the entire mouse heart in response to Gata4, Gata6, or double Gata4/6 deletion in comparison with Kit lineage tracing controls. Error bars are SEM, n=4 per group (10 sections per heart). *P<0.05 vs. KitMCM R26eGFP for each genotype. G, Immunofluorescent cardiac histological section showing dual reporter evidence of a fusion-derived mTomato+ mGFP+ cardiomyocyte. H, Percentage of fusion-derived Kit allele lineage–traced cardiomyocytes (mTomato+mGFP+) vs. presumed de novo cardiomyocytes (only mGFP+). Error bars are SEM, n=4 per group (10 sections per heart). *P<0.05 vs. KitMCM R26mT/mG for each genotype. eGFP indicates enhanced green fluorescent protein; PCR, polymerase chain reaction; Tam, tamoxifen; and WT, wild type.