Abstract
Liver cancer is one of the leading causes of malignancy-associated mortality worldwide and its clinical therapy remains very challenging. Ginsenoside Rh2 (Rh2) has been reported to have antitumor effects on some types of cancer, including liver cancer. However, its regulatory mechanism has not been extensively evaluated. In the present study, Rh2 increased the expression of microRNA (miR)-200b-5p, miR-224-3p and miR-146a-5p, and decreased the expression of miR-26b-3p and miR-29a-5p. Of the three upregulated miRs, miR-146a-5p exhibited the highest fold elevation. In accordance with a previous study, Rh2 effectively inhibited the survival of liver cancer cells in vitro and in a mouse model. In addition, it was observed that Rh2 markedly promoted liver cancer apoptosis and inhibited colony formation. Cell apoptosis and the inhibition of cell survival as well as colony formation induced by Rh2 were enhanced and weakened by miR-146a-5p overexpression and inhibition, respectively. The results of the present study provide further evidence of the antitumor effect of Rh2 in liver cancer and also demonstrate that this effect may be mediated via the regulation of miR-146a-5p expression in the liver cancer cell line HepG2. The results indicated that miR-146a-5p may be a promising regulatory factor in Rh2-mediated effects in liver cancer.
Keywords: ginsenoside Rh2, liver cancer, antitumor, promotion, microRNA-146a-5p
Introduction
Ginseng (Panax ginseng C. A. Meyer) is used as general ‘tonic’ and therapeutic agent in Asian countries. Its diverse pharmacological activities are largely attributed to ginsenosides, which are the major active components found in ginseng. Ginsenoside Rh2 (Rh2) is a key component of red ginseng and reportedly has significant antitumor effects in numerous types of cancers such as breast (1) ovarian (2), prostate (3), leukemia (4), colorectal (5), and hepatocellular carcinoma (HCC) (6). The specific effects of Rh2 include apoptosis promotion as well as inhibition of significant growth, metastasis, and invasion (4,6–8). Although some signaling pathways such as epidermal growth factor receptor (9), tumor necrosis factor-α (10), Janus kinase/signal transducer and activator of transcription 3 (11), and phosphoinositide 3-kinase/Akt (7) have been implicated in the regulatory process of Rh2 in cancer cells, the detailed mechanism remains unclear, particularly the role of non-coding RNAs.
MicroRNAs (miRNAs) are small non-coding RNAs that contain approximately 22 nucleotides. miRNAs play a key role in numerous physiological processes such as cell metabolism, immune function, cell proliferation, apoptosis, tissue development, and differentiation (12). Furthermore, miRNAs have been confirmed to play roles in cancer development, epithelial-mesenchymal transition, and response to therapy (13). Some miRNAs may be regulated by Rh2 in human non-small cell lung cancer A549 and breast cancer cells (14,15). In addition, Rh2 inhibits glioma cell proliferation by targeting miR-128 (16). These studies suggested that miRNAs play a key role in the regulatory effects of Rh2 in cancer cells. However, additional studies are needed to confirm this hypothesis.
Liver cancer, a highly fatal cancer, is much more common in less developed countries, thus disproportionately contributing to the overall cancer mortality rate in these countries (17). Rh2 is known to inhibit HCC cell growth in vivo and in vitro by decreasing the number of cancer stem cell-like cells in a dose-dependent manner (6). In the present study, we investigated the effect of Rh2 on miRNA expression and role of miRNAs in Rh2-mediated inhibition of liver cancer cell growth and colony formation, as well as in the promotion of liver cancer apoptosis. Our results showed that Rh2 treatment increased the expression levels of miR-200b-5p, miR-224-3p, and miR-146a-5p and decreased those of miR-26b-3p and miR-29a-5p. Further, we investigated the role of miR-146a-5p which showed the greatest increase for the Rh2-mediated inhibitory effect on liver cancer cell growth. In addition, we examined colony formation and the promotion of liver cancer apoptosis following Rh2 treatment.
Materials and methods
Cell lines and culture
The liver cancer cell lines HepG2, Huh7, and SMMC-7721 were obtained from the Type Culture Collection of the Chinese Academy of Sciences (Shanghai, China). The cells were cultured in minimum essential medium (HyClone; GE Healthcare Life Sciences, Logan, UT, USA) with 10% fetal bovine serum (HyClone; GE Healthcare Life Sciences) at 37°C in a humidified atmosphere containing 5% CO2.
Lentivirus package and stable cell construction
The primary sequence of miR-146a-5p (NC_000005.10:160485152-160485650) was amplified by polymerase chain reaction (PCR), using the primer pair 5′-CCGCTCGAGGGCTCAAGAGATCCACCCACATC-3′ and 5′-CGCGGATCCGAGATCATTCATTTAGCTACTTGG-3′ and then inserted into a pLVX-IRES-Neo plasmid after digestion with XhoI and BamHI. Eight repeated sequences of the miR-146a-5p inhibitor (AACCCATGGAGACAGTTCTCA) were synthesized into a T vector and inserted into the PLVX-SHRNA2 plasmid after digestion with BamHI and EcoRI.
All recombinant pLVXs plus pHelper 1.0 and 2.0 plasmids were generated by transient transfection of 293T cells, and the lentivirus was packaged in accordance with general procedures. For infection, 2×10⁵ HepG2 cells were divided into three groups and subcultured in 6-well culture plates for 24 h prior to transduction. The three cell groups were as follows: Cells infected with empty lentivirus, lentivirus expressing miR-146a-5p, and lentivirus expressing miR-146a-5p inhibitor (designated as negative control, Lv-NC; Lv-miR-146a-5p, and Lv-miR-146a-5p-inhibitor, respectively). Lentivirus transduction and stable cell construction were carried out as previously reported (18).
Cell treatment and groups
To detect the expression levels of miR-200b-5p, miR-224-3p, miR-146a-5p, miR-26b-3p, and miR-29a-5p, the HepG2, Huh7, and SMMC-7721 cells were treated with 20 µg/ml Rh2 or dimethyl sulfoxide (DMSO) for 48 h and then harvested for reverse transcription-quantitative polymerase chain reaction (RT-qPCR) analysis. To detect the effect of miR-146a-5p on Rh2-induced cell proliferation, stable Lv-NC, Lv-miR-146a-5p, and Lv-miR-146a-5p-I cells were treated with 20 µg/ml Rh2 for 48 h, and stable Lv-NC cells were also treated with DMSO as a negative control.
RNA extraction and RT-qPCR
After predetermined times, total RNA was extracted from the treated cells of each group using TRIzol reagent (Invitrogen; Thermo Fisher Scientific, Inc., Waltham, MA, USA) according to the manufacturer's protocol. The RNA was reverse transcribed into cDNA using M-MLV reverse transcriptase (Promega Corporation, Madison, WI, USA) in a 20-µl reaction volume with miRNA-specific stem-loop primers. Equal amounts of cDNA were used as templates for RT-qPCR to detect the expression levels of miR-200b-5p, miR-224-3p, miR-26b-3p, miR-29a-5p, and miR-146a-5p relative to that of U6 (endogenous control). The detection was followed by quantitation using an ABI PRISM 7500 sequence detection system using SYBR Green qPCR SuperMix (Invitrogen; Thermo Fisher Scientific, Inc.) with the primers shown in Table I. Experiments were performed in duplicate and repeated three times and the fold-induction of gene expression was calculated using the 2−ΔΔCq method.
Table I.
Primers for reverse transcription-quantitative polymerase chain reaction.
| Primer | Sequence (5′-3′) |
|---|---|
| miR-26b-3p-F | ACACTCCAGCTGGGCCTGTTCTCCATTACTTG |
| miR-224-3p-F | ACACTCCAGCTGGGAAAATGGTGCCCTAGTGAC |
| miR-29a-5p-F | ACACTCCAGCTGGGACTGATTTCTTTTGGTG |
| miR-200b-5p-F | ACACTCCAGCTGGGCATCTTACTGGGCAGCATTG |
| miR-146a-5p-F | ACACTCCAGCTGGGTGAGAACTGAATTCCATG |
| Universal miRNA-R | CTCAACTGGTGTCGTGGA |
| U6-F | CTCGCTTCGGCAGCACA |
| U6-R | AACGCTTCACGAATTTGCGT |
F, forward primer; R, reverse primer; miR/miRNA, microRNA.
Western blot analysis
After predetermined times, the treated cells from each group were washed twice with ice-cold phosphate-buffered saline (PBS), and total protein was extracted using radioimmunoprecipitation assay buffer (Beyotime Institute of Biotechnology, Haimen, China). Briefly, cells were lysed with approximately 400 µl lysis buffer on ice for 30 min. These samples were centrifuged at 4°C for 15 min at 14,000 rpm, after which the supernatants were recovered and subpackaged. Total proteins were quantified using the bicinchoninic acid protein assay kit (Pierce; Thermo Fisher Scientific, Inc.). Equal amounts of protein were loaded and separated using 10–12% sodium dodecyl sulfate polyacrylamide gel electrophoresis and then transferred onto polyvinylidene fluoride membranes (EMD Millipore, Billerica, MA, USA). The membranes were blocked for 1 h at 37°C with 5% milk in Tris-buffered saline (TBS) containing 0.05% Tween-20 (TBST) and then incubated for 1 h with anti-myeloid cell leukemia 1 (MCL1, ab32087) and anti-nuclear factor (erythroid-derived 2)-like 2 (Nrf2, ab62352) antibodies (both 1:1,000), which were purchased from Abcam (Cambridge, UK). The membranes were washed three times with TBST, incubated with the secondary antibody for 40 min, washed three times with TBST, and then visualized using Immobilon western chemiluminescent horseradish peroxidase (HRP) substrate (EMD Millipore). Glyceraldehyde 3-phosphate dehydrogenase served as an internal loading control.
3-(4,5-Dimethylthiazol-2-yl)-5-(3-carboxymethoxyphenyl)-2-(4-sulfophenyl)-2H-tetrazolium (MTS) assay. The MTS assay was conducted using the CellTiter 96 AQueous One Solution cell proliferation assay kit (Promega Corporation) according to the manufacturer's instructions. Briefly, stable Lv-NC, Lv-miR-146a-5p, and Lv-miR-146a-5p-I cells (1×10⁴ cells/100 µl) were seeded into 96-well plates. After adhesion, the cells were treated with 20 µg/ml Rh2 or DMSO for 1, 2, and 3 days. Next, 10 µl CellTiter 96 AQueous One Solution reagent was added to each well, followed by incubation for 4 h at 37°C, and then the absorbance of the reaction solution was measured at 490 nm using a microplate reader (Multiskan MK3; Thermo Fisher Scientific, Inc.). The survival rate was calculated using the following formula: Survival rate (%)=[optical density (OD)]test/ODnegative control] ×100.
Flow cytometric analysis
After predetermined times, each group of treated HepG2 cells was digested, collected, and washed twice with PBS. Cell apoptosis was subsequently analyzed using an Annexin V-fluorescein isothiocyanate (FITC) apoptosis detection kit according to the manufacturer's instructions (Nanjing KeyGen Biotech., Co., Ltd., Jiangsu, China). Briefly, the cell pellet (~1–5×10⁵ cells) was resuspended in 500 µl Binding Buffer. Next, 5 µl each of Annexin V-FITC and propidium iodide (PI) were added and mixed at room temperature (protected from light) for 15 min. After 1 h, the cells were detected by flow cytometry (BD Biosciences, Franklin Lakes, NJ, USA). The cell cycle was analyzed using cell cycle detection kits according to the manufacturer's instructions (Nanjing KeyGen Biotech., Co., Ltd.). Briefly, the cells were fixed in 500 µl 70% precooled ethanol at 4°C overnight. An equal amount of PBS was added twice for washing, and then up to 100 µl RNase A was added at 37°C for 30 min, followed by addition of 100 µl PI at 4°C in the dark for 30 min. Next, the cell cycle was evaluated using a flow cytometry system (BD Biosciences) and each experiment was repeated three times.
Colony formation assay
The Lv-NC, Lv-miR-146a-5p, and Lv-miR-146a-5p inhibitor HepG2 cells were plated at a density of 100 cells/well in 96-well plates pre-coated with Matrigel (BD Biosciences) according to the manufacturer's instructions. Cells were treated with DMSO or Rh2, incubated for 10 days at 37°C in a humidified atmosphere of 5% CO2, and during the colony growth, the culture medium containing DMSO or Rh2 was replaced every 3 days. Photographs were captured from five fields of view for each well using a Leica CTR MIC microscope (Leica Microsystems GmbH, Wetzlar, Germany). The number and size of the colonies were determined using ImageJ 1.49v software (National Institutes of Health, Bethesda, MD, USA) and two independent experiments were performed, each including three replicates. The colony formation rate was calculated using the following equation: colony formation rate (%)=(number of colonies/number of seeded cells) ×100.
Tumorigenicity assay in nude mice
Six-week-old male athymic nude mice were subcutaneously injected with 4×10⁶ cells in 0.2 ml of PBS in the middle upper abdominal region. Six mice were injected with Lv-NC stable cells while three mice were injected with stable Lv-miR-146a-5p or Lv-miR-146a-5p inhibitor cells. Four weeks later, Rh2 (1 mg/kg body weight) was injected via the tail vein of the mice twice weekly for 4 weeks until the end of the experiment. Tumor sizes were measured using calipers. The control group consisted of three mice injected with stable Lv-NC cells and administered injections of 1% DMSO at the same volume and frequency. The tumor volume was calculated using the following formula: (L × W2)/2, where L and W are the length and width of the tumor, respectively. All experimental procedures involving animals were in accordance with the Guide for the Care and Use of Laboratory Animals (NIH Publication no. 80-23, revised 1996) and performed according to the institutional ethical guidelines for animal experiments. Ethical approval was obtained from Nanfang Hospital (Guangdong, China) on June 10, 2016.
Immunohistochemistry (IHC)
Paraffin-embedded specimens were cut into 4-µm-thick sections, incubated at 60°C for 60 min, deparaffinized with xylene, and rehydrated. These sections were immersed in ethylenediaminetetraacetic acid antigenic retrieval buffer in a pressure cooker for 5 min, cooled to room temperature, and treated with 3% hydrogen peroxide in methanol to quench endogenous peroxidase activity. After incubation with goat serum for 30 min, the sections were incubated with anti-MCL1 and anti-Nrf2 primary antibody (1:100) overnight at 4°C. After washing three times with PBS, protein expression was visualized using a ChemMate™ DAKO Envision™ detection kit (Glostrup, Denmark) according to the manufacturer's instructions. Briefly, tissue sections were incubated with biotinylated secondary antibody for 30 min at room temperature, followed by incubation with streptavidin-HRP for 5 min. After washing three times with PBS, diaminobenzidine was added for visualization, and the sections were counterstained with hematoxylin.
Statistical analysis
Statistical analysis was performed using the SPSS v.19.0 software (IBM Corp., Armonk, NY, USA). The results are presented as the mean ± standard deviation. Statistical comparisons were performed by one-way analysis of variance, followed by Scheffe's test. P<0.05 was considered to indicate a statistically significant difference.
Results
Effect of Rh2 treatment on miRNA expression level
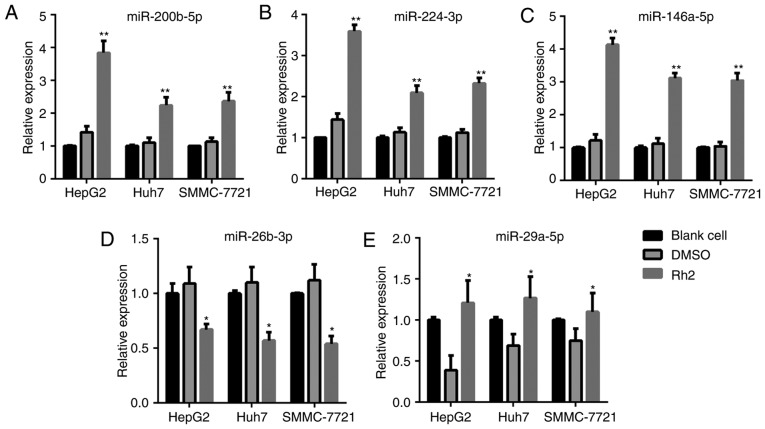
After treatment with Rh2 for 48 h, the cells were harvested for RT-qPCR to detect the expression levels of miR-200b-5p, miR-224-3p, miR-26b-3p, miR-29a-5p, and miR-146a-5p. The results showed that Rh2 treatment increased the expression level of miR-200b-5p, miR-224-3p, and miR-146a-5p compared to the levels in DMSO-treated or blank cells in HepG2, Huh7, and SMMC-7721 cells (Fig. 1A-C). In addition, the expression level of miR-26b-3p and miR-29a-5p decreased after Rh2 treatment in HepG2, Huh7, and SMMC-7721 cells (Fig. 1D and E). Among the three upregulated miRNAs, miR-146a-5p exhibited the highest fold-increase in HepG2; therefore, HepG2 cells and miR-146a-5p were used in subsequent assays.
Figure 1.
Expression levels of (A) miR-200b-5p, (B) miR-224-3p, (C) miR-146a-5p, (D) miR-26b-3p and (E) miR-29a-5p in Rh2-treated HepG2, Huh7 and SMMC-7721 cells detected by reverse transcription-quantitative polymerase chain reaction. *P<0.05 and **P<0.01 vs. DMSO. miR, microRNA; Rh2, ginsenoside Rh2.
Construction of miR-146a-5p overexpressing or knockdown stable HepG2 cells
To construct miR-146a-5p overexpressing or knockdown stable HepG2 cells, the cells were infected with Lv-miR-146a-5p and Lv-miR-146a-5p inhibitor and then harvested for RT-qPCR to detect the miR-146a-5p expression level. As shown in Fig. 2, HepG2 cells infected with Lv-miR-146a-5p and the Lv-miR-146a-5p inhibitor successfully overexpressed and showed knockdown of miR-146a-5p, respectively, compared to in Lv-NC transfected cells.
Figure 2.

Expression levels of miR-146a-5p in HepG2 cells following transduction with Lv-NC, Lv-miR-146a-5p or Lv-miR-146a-5p inhibitor detected by reverse transcription-quantitative polymerase chain reaction. **P<0.01 vs. Lv-NC. miR, microRNA; Lv-NC, empty lentivirus negative control; Lv-miR-146a-5p, lentivirus expressing miR-146a-5p; Lv-miR-146a-5p inhibitor, lentivirus expressing miR-146a-5p inhibitor.
miR-146a-5p promoted inhibitory effect of Rh2 on cell growth in vitro and in vivo
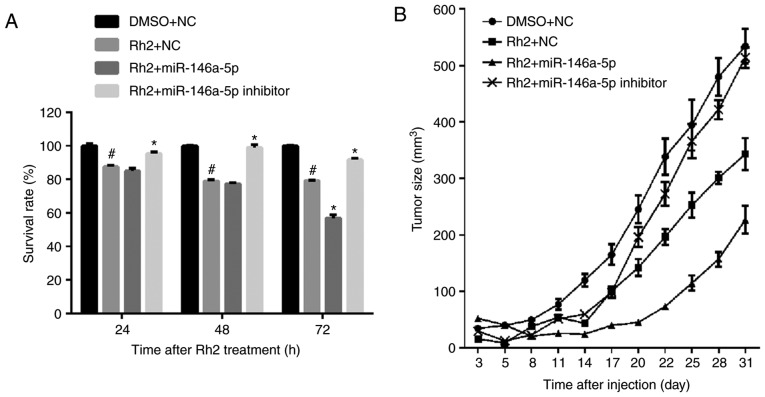
The results of the MTS assay showed that the survival rate of Rh2-treated Lv-NC HepG2 cells (Rh2 + NC) was clearly lower than those treated with DMSOs (DMSO + NC). This result indicates that Rh2 inhibited the proliferation of HepG2 cells (Fig. 3A). To examine the effect of miR-146a-5p on the cell survival of Rh2 treated HepG2 cells, stable cells expressing miR-146a-5p or the miR-146a-5p inhibitor were treated with Rh2 for 24, 48, and 72 h. The results of the MTS assay showed that miR-146a-5p overexpression promoted the inhibitory effect of Rh2 on cell survival, while the miR-146a-5p inhibitor weakened this effect (Fig. 3A). To further verify the role of miR-146a-5p in HepG2 cell proliferation, stable cells expressing miR-146a-5p or the miR-146a-5p inhibitor were injected into the right armpit region of the mice, which were subsequently gavaged with Rh2 once per day. The results showed that miR-146a-5p overexpression promoted the inhibitory effect of Rh2 on tumor size, while the miR-146a-5p inhibitor weakened this effect (Fig. 3B). These results indicate that Rh2 inhibited cell growth and miR-146a-5p enhanced this inhibitory effect in vitro and in vivo.
Figure 3.
miR-146a-5p promotes the inhibitory effect of Rh2 on cell survival in vitro and in vivo. (A) Stable cells expressing miR-146a-5p, miR-146a-5p inhibitor or NC cells were treated with Rh2 or DMSO for 24, 48 and 72 h, and the survival rate of each group was calculated from the reaction solution absorbance at 490 nm. (B) Growth curves of tumors isolated from nude mice injected with stable cells expressing miR-146a-5p, miR-146a-5p inhibitor or NC cells, and gavaged with Rh2 or DMSO. #P<0.05 vs. DMSO+NC; *P<0.05 vs. Rh2+NC. miR, microRNA; Rh2, ginsenoside Rh2; NC, negative control; DMSO, dimethyl sulfoxide.
miR-146a-5p increased Rh2-induced cell apoptosis of HepG2 cells
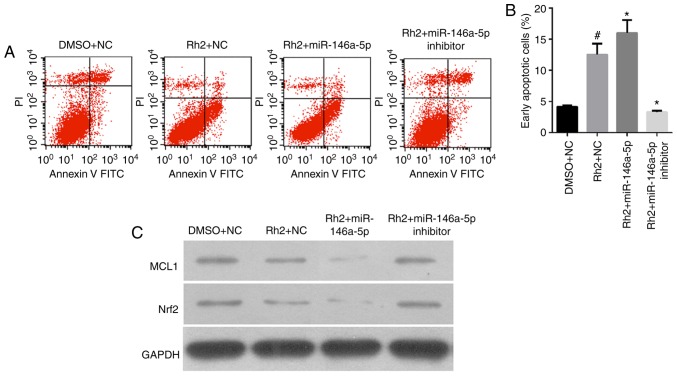
The results of flow cytometry analysis showed that the number of early apoptotic Rh2 + NC cells was clearly higher than that of the DMSO + NC cells, indicating that Rh2 promoted the apoptosis of HepG2 cells (Fig. 4A and B). To examine the role of miR-146a-5p on cell apoptosis of Rh2-treated HepG2, stable cells expressing miR-146a-5p or the miR-146a-5p inhibitor were treated with Rh2 for 48 h. The results showed that miR-146a-5p overexpression enhanced the cell apoptosis effect of Rh2, while the miR-146a-5p inhibitor weakened this effect (Fig. 4A and B).
Figure 4.
miR-146a-5p enhances the promoting effect of Rh2 on cell apoptosis in vitro. Stable cells expressing miR-146a-5p, miR-146a-5p inhibitor or NC cells were treated with Rh2 or DMSO for 48 h. (A) Cell apoptotic rate was then analyzed by flow cytometry, and representative flow cytometry analysis graphs are presented. (B) Statistical analysis of early apoptotic cells. #P<0.05 vs. DMSO+NC; *P<0.05 vs. Rh2+NC. (C) MCL1 and Nrf2 protein expression was detected by western blotting. miR, microRNA; Rh2, ginsenoside Rh2; NC, negative control; DMSO, dimethyl sulfoxide; MCL1, myeloid cell leukemia 1; Nrf2, nuclear factor (erythroid-derived 2)-like 2; FITC, fluorescein isothiocyanate; PI, propidium iodide.
In addition, we detected the expression of cell apoptosis-related proteins, MCL1, B-cell lymphoma-2 (Bcl2), and Nrf2 by western blotting. The results showed that MCL1 and Nrf2 expression levels in Rh2 + NC cells were clearly lower than those in DMSO + NC cells were. This result indicates that Rh2 suppressed MCL1 and Nrf2 expression in HepG2 cells (Fig. 4C).
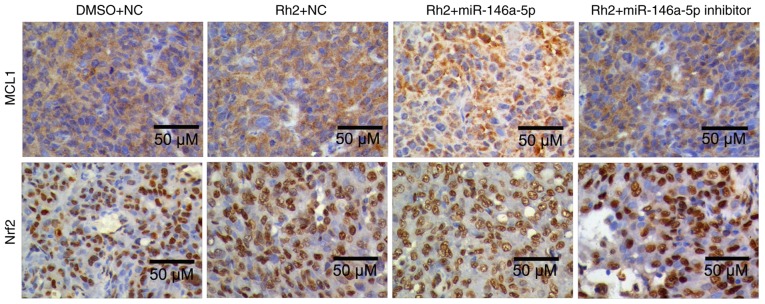
To examine the effect of miR-146a-5p on MCL1, Bcl2, and Nrf2 expression in Rh2-treated HepG2 cells, stable cells expressing miR-146a-5p or the miR-146a-5p inhibitor were treated with Rh2 for 48 h. The results showed that miR-146a-5p overexpression enhanced the inhibitory effect of Rh2 on MCL1 and Nrf2 and increased its effect on Bcl2 expression. Furthermore, the miR-146a-5p inhibitor weakened the effect of Rh2 on MCL1 and Nrf2 expression (Fig. 4C). In addition, the role of miR-146a-5p on MCL1, and Nrf2 expression in Rh2-treated HepG2 cells was further verified in tumor samples in tumorigenicity assays of nude mice using IHC and the results are consistent with those of the in vitro experiments (Fig. 5).
Figure 5.
Immunohistochemistry to detect the expression of MCL1 and Nrf2 in tumor samples from the tumorigenicity assays of nude mice. Scale bars, 50 µm. miR, microRNA; Rh2, ginsenoside Rh2; NC, negative control; DMSO, dimethyl sulfoxide; MCL1, myeloid cell leukemia 1; Nrf2, nuclear factor (erythroid-derived 2)-like 2.
miR-146a-5p promoted effect of Rh2 on colony formation in vitro
The results of the colony formation assay showed that the colony formation rate of Rh2 + NC cells was clearly lower than that of DMSO + NC cells, indicating that Rh2 suppressed the colony formation of HepG2 cells (Fig. 6). To examine the role of miR-146a-5p in colony formation of Rh2-treated hepG2 cells, stable cells expressing miR-146a-5p or the miR-146a-5p inhibitor were treated with Rh2 for 10 days. The results showed that miR-146a-5p overexpression enhanced the inhibitory effect of Rh2 on colony formation, while the miR-146a-5p inhibitor weakened this effect (Fig. 6).
Figure 6.
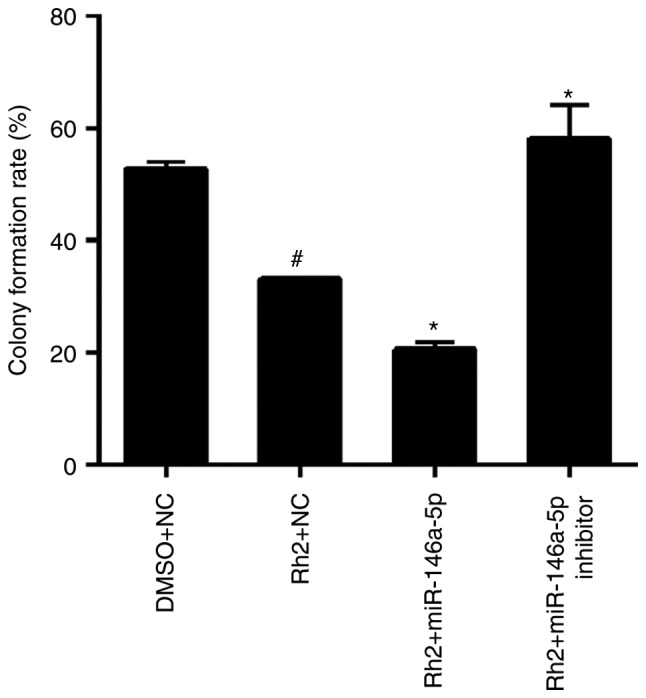
miR-146a-5p enhances the inhibitory effect of Rh2 on colony formation in vitro. Stable cells expressing miR-146a-5p, miR-146a-5p inhibitor or NC cells were treated with Rh2 or DMSO for 10 days, and the colony formation rate was analyzed by a colony formation assay. Statistical results of colony formation rate are presented. #P<0.05 vs. DMSO+NC; *P<0.05 vs. Rh2+NC. microRNA; Rh2, ginsenoside Rh2; NC, negative control; DMSO, dimethyl sulfoxide.
Discussion
Liver cancer is one of the leading causes of malignancy-related deaths worldwide (17), and its clinical therapy is very challenging. Rh2 is a compound isolated from P. ginseng, which is popular in China for its nourishing and protective effects on the human body. Rh2 has been demonstrated to suppress tumor growth without causing severe side effects in both H22 cells and a hepatoma-bearing mouse model (19). In addition, Rh2 reduced HCC cell viability and the number of cancer stem cell-like cells (6). Therefore, Rh2 likely has antitumor activity against liver cancer cells. However, its regulatory mechanism is not clear, although Rh2 is known to increase autophagy and inhibit β-catenin signaling (6). As an important regulator, the effect of miRNAs on the activity of Rh2 in liver cancer cells is unclear. In the present study, we detected the expression levels of miR-200b-5p, miR-224-3p, miR-26b-3p, miR-29a-5p, and miR-146a-5p. Of the three upregulated miRNAs (miR-200b-5p, miR-224-3p, and miR-146a-5p), the fold-increase in miR-146a-5p was the highest; therefore, we further determined its role in Rh2-induced proliferation suppression and apoptosis promotion in the liver cancer cell line HepG2. HepG2 is a hepatoblastoma-derived cell line (20). For in vitro studies, the HepG2 cell line is frequently employed as experimental model because it is not only widely available, but also a well-characterized liver cancer cell line (21). Thus, HepG2 cells are suitable for studying the effect of Rh2 and miR-146a-5p on liver cancer.
The effect of Rh2 on cell apoptosis and colony formation of liver cancer cells is unknown. In the present study, we found that Rh2 increased the number of early apoptotic HepG2 cells. In addition, Rh2 decreased MCL1 and Nrf2 expression levels and increased Bcl2 expression. MCL1, a member of the Bcl-2 family, is an anti-apoptotic protein. Nrf2, a member of a small family of basic leucine zipper proteins, is also an anti-apoptotic protein (22,23). These results revealed that Rh2 promoted liver cancer cell apoptosis. In addition, our results indicated that Rh2 suppressed colony formation. Collectively, our results demonstrated the antitumor effects of Rh2 in liver cancer cells.
In accordance with a previous study (6), we found that Rh2 inhibited liver cancer cell growth in vitro and in vivo, and this inhibitory effect was enhanced by miR-146a-5p overexpression and weakened by the miR-146a-5p inhibitor. Our results were further supported by examining the role of miR-146a-5p in liver cancer cells. miR-146a-5p expression was decreased in liver cancer tissues compared to in corresponding adjacent tissues, while miR-146a overexpression suppressed the proliferation of the liver cancer cell lines HepG2 and SMMC7721 (24). This observation suggests an antitumor role of miR-146a-5p. In addition, the promoting effect of Rh2 on cell apoptosis and its inhibitory effect on colony formation were enhanced by miR-146a-5p overexpression and weakened by the miR-146a-5p inhibitor. Further, miR-146a-5p expression was upregulated by Rh2 treatment. Thus, the antitumor effect of Rh2 may be mediated through the regulation of miR-146a-5p expression.
In conclusion, our study provides new in vitro evidence that Rh2 promoted liver cancer cell apoptosis and inhibited colony formation. However, further studies using animal models are required to verify our findings. In addition, Rh2 upregulated miR-146a-5p expression. Collectively, these results indicate that miR-146a-5p overexpression enhanced the effect of Rh2 on liver cancer cell growth, apoptosis, and colony formation. Therefore, the Rh2-induced regulation of liver cancer cell growth, apoptosis, and colony formation was mediated by miR-146a-5p. However, several issues remain unclear, such as determining the target of miR-146a-5p, elucidating the mechanisms underlying the regulatory effect of miR-146a-5p on the activity of Rh2 in liver cancer cells, and evaluating the relationship between miR-338-3p and other miRNAs in Rh2-induced actions in liver cancer.
Acknowledgements
Not applicable.
Funding
The present study was supported by The Science and Technology Program of Guangzhou (grant no. 201607010015) and Natural Science Foundation of Guangdong (grant no. 2016A030313525).
Availability of data and materials
The datasets used and/or analyzed during the present study are available from the corresponding author on reasonable request.
Authors' contributions
WC and SC performed the cell culture, stable cell construction, flow cytometric analysis, MTS assay and colony formation assay. WC performed immunohistochemistry and the tumorigenicity assay in nude mice. HL performed RNA extraction, reverse transcription-quantitative polymerase chain reaction and western blot analysis. YQ performed statistical analysis and designed study. WC wrote the manuscript and SC helped to draft the manuscript. WC and SC read and approved the final manuscript.
Ethics approval and consent to participate
Not applicable.
Patient consent for publication
Not applicable.
Competing interests
The authors declare that they have no competing interests.
References
- 1.Oh M, Choi YH, Choi S, Chung H, Kim K, Kim SI, Kim DK, Kim ND. Anti-proliferating effects of ginsenoside Rh2 on MCF-7 human breast cancer cells. Int J Oncol. 1999;14:869–875. doi: 10.3892/ijo.14.5.869. [DOI] [PubMed] [Google Scholar]
- 2.Nakata H, Kikuchi Y, Tode T, Hirata J, Kita T, Ishii K, Kudoh K, Nagata I, Shinomiya N. Inhibitory effects of ginsenoside Rh2 on tumor growth in nude mice bearing human ovarian cancer cells. Jpn J Cancer Res. 1998;89:733–740. doi: 10.1111/j.1349-7006.1998.tb03278.x. [DOI] [PMC free article] [PubMed] [Google Scholar]
- 3.Xie X, Eberding A, Madera C, Fazli L, Jia W, Goldenberg L, Gleave M, Guns ES. Rh2 synergistically enhances paclitaxel or mitoxantrone in prostate cancer models. J Urol. 2006;175:1926–1931. doi: 10.1016/S0022-5347(05)00891-8. [DOI] [PubMed] [Google Scholar]
- 4.Xia T, Wang YN, Zhou CX, Wu LM, Liu Y, Zeng QH, Zhang XL, Yao JH, Wang M, Fang JP. Ginsenoside Rh2 and Rg3 inhibit cell proliferation and induce apoptosis by increasing mitochondrial reactive oxygen species in human leukemia Jurkat cells. Mol Med Rep. 2017;15:3591–3598. doi: 10.3892/mmr.2017.6459. [DOI] [PMC free article] [PubMed] [Google Scholar]
- 5.Yang J, Yuan D, Xing T, Su H, Zhang S, Wen J, Bai Q, Dang D. Ginsenoside Rh2 inhibiting HCT116 colon cancer cell proliferation through blocking PDZ-binding kinase/T-LAK cell-originated protein kinase. J Ginseng Res. 2016;40:400–408. doi: 10.1016/j.jgr.2016.03.007. [DOI] [PMC free article] [PubMed] [Google Scholar]
- 6.Yang Z, Zhao T, Liu H, Zhang L. Ginsenoside Rh2 inhibits hepatocellular carcinoma through β-catenin and autophagy. Sci Rep. 2016;6:19383. doi: 10.1038/srep19383. [DOI] [PMC free article] [PubMed] [Google Scholar]
- 7.Guan N, Huo X, Zhang Z, Zhang S, Luo J, Guo W. Ginsenoside Rh2 inhibits metastasis of glioblastoma multiforme through Akt-regulated MMP13. Tumour Biol. 2015;36:6789–6795. doi: 10.1007/s13277-015-3387-1. [DOI] [PubMed] [Google Scholar]
- 8.Li S, Gao Y, Ma W, Cheng T, Liu Y. Ginsenoside Rh2 inhibits invasiveness of glioblastoma through modulation of VEGF-A. Tumour Biol. 2015 doi: 10.1007/s13277-015-3759-6. (Epub ahead of print) [DOI] [PubMed] [Google Scholar]
- 9.Li S, Gao Y, Ma W, Guo W, Zhou G, Cheng T, Liu Y. EGFR signaling-dependent inhibition of glioblastoma growth by ginsenoside Rh2. Tumour Biol. 2014;35:5593–5598. doi: 10.1007/s13277-014-1739-x. [DOI] [PubMed] [Google Scholar]
- 10.Huang J, Peng K, Wang L, Wen B, Zhou L, Luo T, Su M, Li J, Luo Z. Ginsenoside Rh2 inhibits proliferation and induces apoptosis in human leukemia cells via TNF-α signaling pathway. Acta Biochim Biophys Sin (Shanghai) 2016;48:750–755. doi: 10.1093/abbs/gmw049. [DOI] [PubMed] [Google Scholar]
- 11.Han S, Jeong AJ, Yang H, Kang Bin K, Lee H, Yi EH, Kim BH, Cho CH, Chung JW, Sung SH, Ye SK. Ginsenoside 20(S)-Rh2 exerts anti-cancer activity through targeting IL-6-induced JAK2/STAT3 pathway in human colorectal cancer cells. J Ethnopharmacol. 2016;194:83–90. doi: 10.1016/j.jep.2016.08.039. [DOI] [PubMed] [Google Scholar]
- 12.Alvarez-Garcia I, Miska EA. MicroRNA functions in animal development and human disease. Development. 2005;132:4653–4662. doi: 10.1242/dev.02073. [DOI] [PubMed] [Google Scholar]
- 13.Joshi P, Middleton J, Jeon YJ, Garofalo M. MicroRNAs in lung cancer. World J Methodol. 2014;4:59–72. doi: 10.5662/wjm.v4.i2.59. [DOI] [PMC free article] [PubMed] [Google Scholar]
- 14.Wen X, Zhang HD, Zhao L, Yao YF, Zhao JH, Tang JH. Ginsenoside Rh2 differentially mediates microRNA expression to prevent chemoresistance of breast cancer. Asian Pac J Cancer Prev. 2015;16:1105–1109. doi: 10.7314/APJCP.2015.16.3.1105. [DOI] [PubMed] [Google Scholar]
- 15.An IS, An S, Kwon KJ, Kim YJ, Bae S. Ginsenoside Rh2 mediates changes in the microRNA expression profile of human non-small cell lung cancer A549 cells. Oncol Rep. 2013;29:523–528. doi: 10.3892/or.2012.2136. [DOI] [PubMed] [Google Scholar]
- 16.Wu N, Wu GC, Hu R, Li M, Feng H. Ginsenoside Rh2 inhibits glioma cell proliferation by targeting microRNA-128. Acta Pharmacol Sin. 2011;32:345–353. doi: 10.1038/aps.2010.220. [DOI] [PMC free article] [PubMed] [Google Scholar]
- 17.Torre LA, Bray F, Siegel RL, Ferlay J, Lortet-Tieulent J, Jemal A. Global cancer statistics, 2012. CA Cancer J Clin. 2015;65:87–108. doi: 10.3322/caac.21262. [DOI] [PubMed] [Google Scholar]
- 18.Guo H, Xia B. Collapsin response mediator protein 4 isoforms (CRMP4a and CRMP4b) have opposite effects on cell proliferation, migration, and invasion in gastric cancer. BMC Cancer. 2016;16:565. doi: 10.1186/s12885-016-2593-6. [DOI] [PMC free article] [PubMed] [Google Scholar]
- 19.Lv Q, Rong N, Liu LJ, Xu XL, Liu JT, Jin FX, Wang CM. Antitumoral activity of (20R)- and (20S)-Ginsenoside Rh2 on transplanted hepatocellular carcinoma in mice. Planta Med. 2016;82:705–711. doi: 10.1055/s-0042-101764. [DOI] [PubMed] [Google Scholar]
- 20.López-Terrada D, Cheung SW, Finegold MJ, Knowles BB. Hep G2 is a hepatoblastoma-derived cell line. Hum Pathol. 2009;40:1512–1515. doi: 10.1016/j.humpath.2009.07.003. [DOI] [PubMed] [Google Scholar]
- 21.Qiu GH, Xie X, Xu F, Shi X, Wang Y, Deng L. Distinctive pharmacological differences between liver cancer cell lines HepG2 and Hep3B. Cytotechnology. 2015;67:1–12. doi: 10.1007/s10616-014-9761-9. [DOI] [PMC free article] [PubMed] [Google Scholar]
- 22.Moi P, Chan K, Asunis I, Cao A, Kan YW. Isolation of NF-E2-related factor 2 (Nrf2), a NF-E2-like basic leucine zipper transcriptional activator that binds to the tandem NF-E2/AP1 repeat of the beta-globin locus control region. Proc Natl Acad Sci USA. 1994;91:9926–9930. doi: 10.1073/pnas.91.21.9926. [DOI] [PMC free article] [PubMed] [Google Scholar]
- 23.Milkovic L, Zarkovic N, Saso L. Controversy about pharmacological modulation of Nrf2 for cancer therapy. Redox Biol. 2017;12:727–732. doi: 10.1016/j.redox.2017.04.013. [DOI] [PMC free article] [PubMed] [Google Scholar]
- 24.Zu Y, Yang Y, Zhu J, Bo X, Hou S, Zhang B, Qiu J, Zheng J. MiR-146a suppresses hepatocellular carcinoma by downregulating TRAF6. Am J Cancer Res. 2016;6:2502–2513. [PMC free article] [PubMed] [Google Scholar]
Associated Data
This section collects any data citations, data availability statements, or supplementary materials included in this article.
Data Availability Statement
The datasets used and/or analyzed during the present study are available from the corresponding author on reasonable request.


