Abstract
Respiratory motion degrades the detection and quantification capabilities of PET/CT imaging. Moreover, mismatch between a fast helical CT image and a time-averaged PET image due to respiratory motion results in additional attenuation correction artifacts and inaccurate localization. Current motion compensation approaches typically have 3 limitations: the mismatch among respiration-gated PET images and the CT attenuation correction (CTAC) map can introduce artifacts in the gated PET reconstructions that can subsequently affect the accuracy of the motion estimation; sinogram-based correction approaches do not correct for intragate motion due to intracycle and intercycle breathing variations; and the mismatch between the PET motion compensation reference gate and the CT image can cause an additional CT-mismatch artifact. In this study, we established a motion correction framework to address these limitations. Methods: In the proposed framework, the combined emission–transmission reconstruction algorithm was used for phase-matched gated PET reconstructions to facilitate the motion model building. An event-by-event nonrigid respiratory motion compensation method with correlations between internal organ motion and external respiratory signals was used to correct both intracycle and intercycle breathing variations. The PET reference gate was automatically determined by a newly proposed CT-matching algorithm. We applied the new framework to 13 human datasets with 3 different radiotracers and 323 lesions and compared its performance with CTAC and non–attenuation correction (NAC) approaches. Validation using 4-dimensional CT was performed for one lung cancer dataset. Results: For the 10 18F-FDG studies, the proposed method outperformed (P < 0.006) both the CTAC and the NAC methods in terms of region-of-interest–based SUVmean, SUVmax, and SUV ratio improvements over no motion correction (SUVmean: 19.9% vs. 14.0% vs. 13.2%; SUVmax: 15.5% vs. 10.8% vs. 10.6%; SUV ratio: 24.1% vs. 17.6% vs. 16.2%, for the proposed, CTAC, and NAC methods, respectively). The proposed method increased SUV ratios over no motion correction for 94.4% of lesions, compared with 84.8% and 86.4% using the CTAC and NAC methods, respectively. For the 2 18F-fluoropropyl-(+)-dihydrotetrabenazine studies, the proposed method reduced the CT-mismatch artifacts in the lower lung where the CTAC approach failed and maintained the quantification accuracy of bone marrow where the NAC approach failed. For the 18F-FMISO study, the proposed method outperformed both the CTAC and the NAC methods in terms of motion estimation accuracy at 2 lung lesion locations. Conclusion: The proposed PET/CT respiratory event-by-event motion-correction framework with motion information derived from matched attenuation-corrected PET data provides image quality superior to that of the CTAC and NAC methods for multiple tracers.
Keywords: PET, respiratory motion correction, event-by-event, non-rigid, matched attenuation correction
In PET imaging of the thorax and abdomen, respiratory motion degrades the detection and accurate quantification of small nodules and organs (1). In addition, the mismatch between a fast helical CT image and a time-averaged PET image due to respiratory motion may result in attenuation correction (AC) artifacts (2) and inaccurate localization (3,4) for PET/CT imaging.
Respiratory gating is the most common approach for addressing motion effects (5). However, gated PET suffers from a low signal-to-noise ratio due to a noise increase by using only a fraction of counts in each gate. Postreconstruction registration (6) is one alternative, which nonrigidly registers all the gated PET images to a reference gate to improve signal-to-noise ratio by using all detected events. Another category of approaches, motion-compensated image reconstruction, reconstructs all the gated PET data into one reference gate by incorporating the nonrigid motion information into the reconstruction (7). Both postreconstruction registration and motion-compensated image reconstruction typically extract patient-specific motion from gated PET using a deformable registration model. Compared with images without motion correction, these methods yield higher image contrast and more accurate quantification without amplifying image noise. However, both postreconstruction registration and motion-compensated image reconstruction share 3 major limitations.
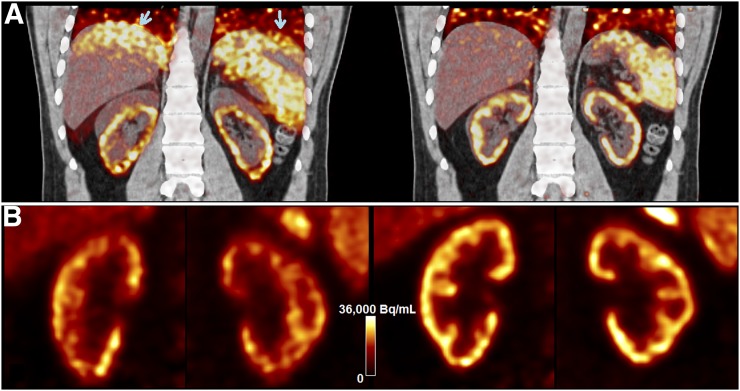
First, each gated PET image suffers from a CT-mismatch artifact since the fast helical CT scan, at best, matches one respiratory phase of the gated PET image. Such artifacts can substantially affect motion estimation accuracy for subsequent motion correction. One example of this mismatch artifact is shown with end-inspiration gated PET (Fig. 1A, left) reconstructed and superimposed with the CT image acquired during expiration. The CT-mismatch artifacts appeared at lower lung regions (arrows). In contrast, the end-expiration gated PET image (Fig. 1A right) well matched the CT image. One solution is to use non–attenuation-correction (NAC) gated PET to derive registration results (8). However, one potential problem with NAC gated PET is that motion estimation errors may occur because of the inaccurate tracer distributions without AC, as further demonstrated in this paper.
FIGURE 1.
(A) Inspiration-phase (left) and expiration-phase (right) gated PET reconstructions superimposed with CT for sample 18F-FPDTBZ study. Arrows in A point to attenuation mismatch. (B) Inspiration-phase (left) and expiration-phase (right) PET reconstruction of kidneys.
A second limitation of existing postreconstruction registration and motion-compensated image reconstruction approaches is that they do not correct for intragate motion, that is, motion within each gated PET image due to intracycle and intercycle breathing variations. This is particularly important for irregular breathers with long-term motion variability (4). As shown in Figure 1B, more blurring and contrast loss are seen in the end-inspiration than the end-expiration gate, which contains less intragate motion.
A third limitation is that if a breath-hold CT scan is acquired, its phase is typically assumed to be known according to a certain acquisition protocol, such as breath coaching. However, patients often fail to follow the breathing instructions because of anxiousness, confusion, or simply an inability to hold their breath because of illness. The inconsistency between the actual CT phase and the presumed CT phase, which is typically considered the reference gate for PET motion correction, can cause additional CT-mismatch artifacts in motion-corrected reconstructions. Alternatively, if a free-breathing CT scan is acquired, it will result in a mismatch with all the PET gates.
In this work, we propose a framework to address these limitations. First, to obtain gated PET with phase-matched AC to overcome the CT-mismatch problem, we investigated the use of the time-of-flight maximum-likelihood activity and AC factor estimation (MLACF) (9) algorithm and compared it with CT attenuation correction (CTAC)–based or NAC-based approaches. Similar to the maximum-likelihood attenuation and activity estimation (MLAA) algorithm (10), the MLACF algorithm generates attenuation information from PET data, which yields gated PET images with intrinsically matched AC. Although the MLACF images may not be quantitative (9), they can be useful for estimating nonrigid motion between gates. Second, to address the intragate motion, we incorporated nonrigid motion information derived from MLACF-reconstructed gated PET images into the framework of a nonrigid internal–external (INTEX) motion correlation technique (11) integrated with a motion-compensation ordered-subsets expectation maximization list-mode algorithm for resolution-recovery reconstruction (MOLAR) (12), for both inter- and intragate respiratory motion correction in an event-by-event fashion (11). Third, the PET reference gate, to which all the events were corrected, is automatically determined by choosing the gate whose MLAA-derived attenuation map best matches the helical CT image.
We name the new framework AIM (APN-INTEX-MOLAR), where APN stands for automated phase-matched nonrigid. Our proposed approach was compared with nonrigid INTEX motion corrections with the motion model derived from CTAC and NAC gated PET using human data with 3 different tracers.
MATERIALS AND METHODS
Human Subjects and Data Acquisitions
Thirteen human PET/CT datasets were acquired with 3 different radiotracers, including 10 with 18F-FDG, 2 with 18F-fluoropropyl-(+)-dihydrotetrabenazine (FPDTBZ, a radiotracer that binds to the vesicular monoamine transporter-2 in β-cells in the pancreas (13)), and 1 with 18F-fluoromisonidazole (FMISO) (14). All studies were approved by the Institutional Review Board and Radiation Safety Committee at Yale University (18F-FPDTBZ and 18F-FMISO) or the University of Sydney (18F-FDG).
Of the 10 18F-FDG datasets, 8 were from cancer patients who underwent a single-bed-position scan of 3–5 min, and 2 were from patients who underwent PET scans at 2 bed positions. For the purpose of evaluating motion correction, we considered the data of each bed position as an individual study. The mean injection activity was 209 ± 11 MBq. In each of the 2 abdominal studies performed with 18F-FPDTBZ, data from the first 10 min of the scan were used. The injection dose was 257 and 286 MBq, respectively. For a non–small cell lung cancer patient who underwent chest imaging (1 bed position) with 180 MBq injection of 18F-FMISO, the first 30 min of data were used.
All PET data were obtained in list mode using the 4-ring Siemens Biograph mCT scanners located at the Yale PET Center and Westmead Hospital. External respiratory motion was tracked using the Anzai belt system. The Anzai respiratory trace was recorded at 50 Hz for all subjects except for the 2 18F-FPDTBZ subjects (40 Hz). End-expiration breath-hold CT was acquired for 18F-FPDTBZ and 18F-FMISO subjects whereas free-breathing CT was acquired for 18F-FDG subjects. For the18F-FMISO patient, an additional 4-dimensional (4D) CT dataset was acquired under normal breathing.
Overview of AIM
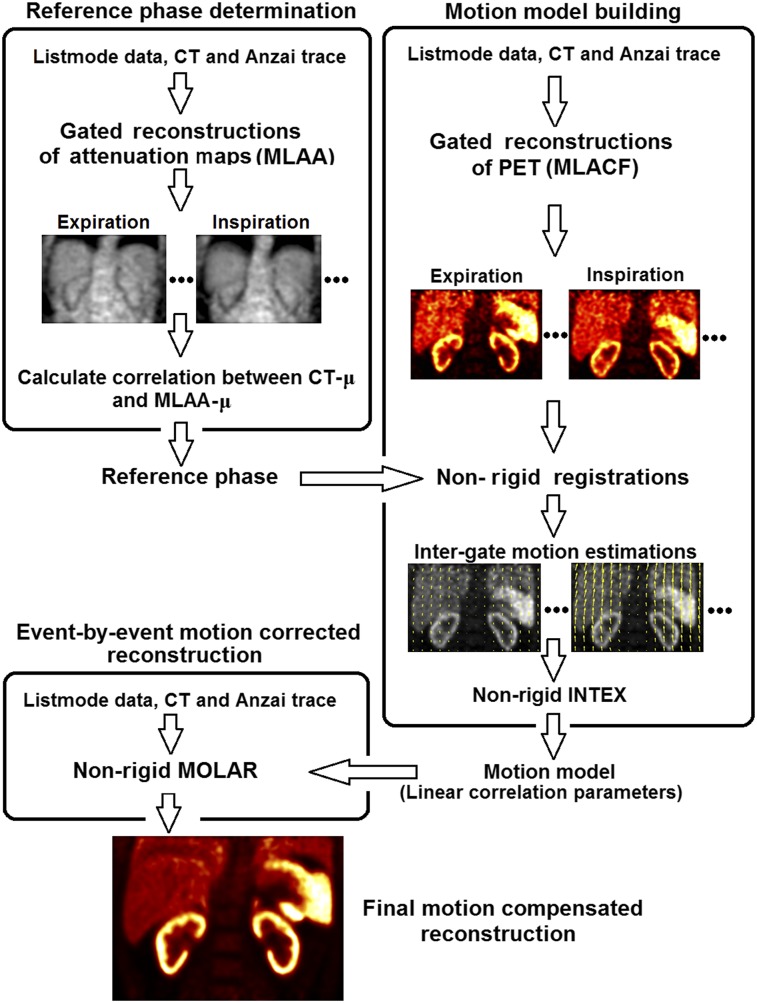
A flowchart of the AIM framework is shown in Figure 2, and details are given below. We first determine which of the 8 respiratory phases best matches the CT, which will be used as the reference phase for PET motion correction. Then, a nonrigid motion model is built to describe a continuous relationship between the Anzai displacement and the movement of each voxel (11). Finally, the event-by-event motion-corrected reconstruction generates the final image with all the counts corrected to the reference phase (11).
FIGURE 2.
Flowchart of AIM framework, consisting of reference-phase determination, motion model building, and event-by-event motion correction.
Determination of Reference Phase
The reference phase was chosen to be the one that best matches the helical CT image acquired under either breath-hold or free-breathing conditions. In this way, the mismatched AC artifacts could be minimized in the final motion-compensated reconstruction. List-mode PET data were graphed into 8 respiration-gated sinograms based on the Anzai trace. MLAA (10) (3 iterations × 21 subsets) was used to reconstruct the attenuation maps (MLAA-μ) for each gate, with the CT-μ as the initial guess. A 3-dimensional (3D) gaussian filter of 15 mm in full width at half maximum was applied to the MLAA-μ images. Pearson linear correlation coefficients for the entire image between the CT-μ and all MLAA-μ images were calculated. The gate yielding the highest correlation coefficient was chosen as the reference phase.
Motion Model Building and Correction
First, MLACF (9) (50 effective iterations) was used to reconstruct each gated PET image. For comparison studies, we also generated gated PET images using ordered-subsets expectation maximization (3 iterations × 21 subsets) with NAC and with CT-μ (CTAC), which used a single attenuation map derived from the 3D CT data to reconstruct PET images of all gates. All gated reconstructions were smoothed afterward with a 3D gaussian filter of 8 mm in full width at half maximum.
To obtain intergate voxel-by-voxel respiratory motion estimation, nonrigid registrations were performed between the reference gate and the remaining gates, using the BioImage Suite software (15). Normalized mutual information was used as the similarity metric, and a free-form deformation was used to parameterize the deformation model (16). The parameter of control point spacing was chosen to be 30 mm for 18F-FDG and 15 mm for 18F-FPDTBZ and 18F-FMISO. Smaller spacing was preferred for high-count images (18F-FPDTBZ and 18F-FMISO) since it has the potential for more accurate registration by allowing for greater amounts of nonrigid deformations. Larger spacing, on the other hand, is more robust to image noise that is common in low-count images (18F-FDG). The resulting motion vectors were then used as the intergate motion estimates in the x (left–right), y (anterior–posterior), and z (superior–inferior) directions for each voxel.
Based on the intergate motion estimates, a linear motion model was built between each voxel’s movement in the x, y, and z directions and the mean Anzai displacement corresponding to each gate. Thus, both Anzai and intergate motion estimates are for “average locations” within each gate. Although the correlation for every voxel was built against the same mean displacements of Anzai trace, the intergate motion estimate is different for each voxel, forming the nonrigid nature of the framework. This nonrigid model can be used to describe a continuous relationship between the Anzai trace displacement and the movement of each voxel, which were subsequently incorporated into nonrigid INTEX-MOLAR to perform event-by-event motion-compensated list-mode ordered-subsets expectation maximization reconstruction (3 iterations × 21 subsets). Further details on the nonrigid INTEX-MOLAR method were described previously (11). Decay, scatter, and random corrections were performed. A 3D gaussian filter of 3 mm in full width at half maximum was applied for postreconstruction smoothing.
Image Analysis and 4D CT Validation
To quantitatively evaluate AIM, changes in SUVmean, SUVmax, SUR (the ratio between lesion SUVmean and blood pool SUVmean), coefficient of variation of a uniform organ (e.g., liver), and signal-to-noise ratio, as compared with no motion correction (NMC) data, were reported. The mean and SD of improvement across different lesion and organ regions of interest (ROIs) within a subject are reported. Ellipsoid ROIs were used for all studies except pancreas and kidney for 18F-FPDTBZ and the large tumor for 18F-FMISO, for which manually drawn ROIs were used. For each target organ, the size of the ROI was kept constant across all methods, whereas the ROI location was recentered for each method. All the methods used the same MLAA-determined CT phase as the reference phase. For the 18F-FDG studies, the 2-tailed Wilcoxon signed-rank test was used to test for significant differences between AIM, CTAC-based, and NAC-based methods in terms of SUVmean, SUVmax, and SUR.
For the 4D CT scan in the 18F-FMISO study, 8 respiration-gated CT attenuation maps (μ4DCT) were generated. Nonrigid registrations were performed between the reference gate and the remaining gates. Registrations generated from intergate motion vectors based on 4D CT were considered the gold standard motion vectors for comparison to the PET motion vector estimation. To calculate residual error, the 3D attenuation CT-μ was warped using the gated PET-derived motion model to each respiratory gate to generate synthetic 4D CT (μSyn). The 3D attenuation CT scan was taken before the PET scan, and the 4D CT scan was taken after the PET scan. The difference between μ4DCT and μSyn within an ROI for the gth gate was calculated using
was computed within ROIs at the liver dome (52.6 cm3), large tumor (85.7 cm3), and small tumor (10.7 cm3).
RESULTS
For 2 of 3 breath-hold CT studies, the CT scan was not acquired during the targeted phase. The reference phase determination method identified the phase that best matches the CT image and was confirmed visually by carefully examining the supposition of the CT image and the gated PET image in the image domain. Detailed results on the reference-phase determination for all subjects can be found in Supplemental Table 1 (supplemental materials are available at http://jnm.snmjournals.org).
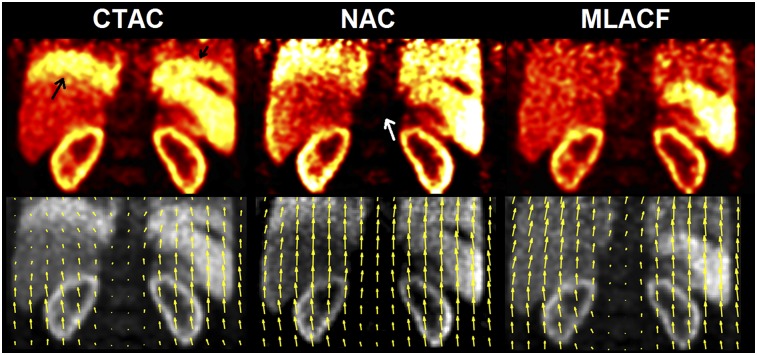
Figure 3 shows sample end-inspiration images from 18F-FPDTBZ study 1 using different AC methods and the corresponding motion vectors from end-inspiration to end-expiration phases. Because the CT image was acquired at the end-expiration phase, the CTAC-based image shows the banana artifact at the lung–liver and lung–spleen interfaces (black arrow) because of the mismatch between CT and PET. NAC-based images did not suffer from this artifact. However, because of greater attenuation in the center of the body, the spine region in NAC images was substantially underestimated (white arrow). In contrast, the proposed MLACF-based reconstruction did not suffer from the AC-mismatch artifact, nor did it underestimate the spine region. Motion vectors based on CTAC images were underestimated in the banana artifact regions, since the artifact was present in only the end-inspiration images, which led to inaccurate motion estimation. For the NAC-based result, unrealistic motions in the vertical direction were estimated in the spine region, which should not move during breathing. Such spine motion vectors were likely introduced by the spine’s neighboring high-uptake organs, such as kidneys and liver. In contrast, motion vectors generated by the MLACF-based method appear to be reasonable in all regions. Specifically, a vertical gradient in vector length (larger closer to the diaphragm) was observed, which is consistent with respiratory movement driven by the diaphragm.
FIGURE 3.
End-inspiration gated reconstructions using different AC methods (top) and end-inspiration–end-inspiration motion vectors derived from each method, superimposed on end-inspiration reconstructions (bottom) for 18F-FPDTBZ study 1.
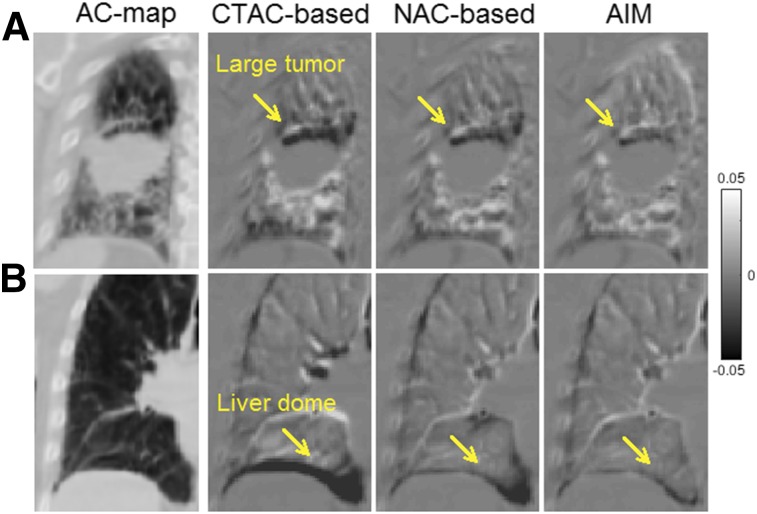
Figure 4A shows the difference maps between μ4DCT and μSyn generated by the 3 different methods around the large-tumor region for the 18F-FMISO study, and Figure 4B shows the liver-dome region. CTAC-based μSyn yielded the largest visual discrepancy in comparison with μ4DCT, whereas AIM yielded the smallest. Quantitative measurements (Table 1) confirmed that among the 3 methods, AIM provided the smallest mean and SD of across all gates, indicating that the AIM-generated motion model is the most accurate among the 3 methods. The remaining error in could be due to the fact that the 4D CT and PET/CT data were acquired at different times, with potential breathing pattern differences. Additional validation results for the small tumor can be found in Supplemental Figure 1. Supplemental Video 1 compares μ4DCT and μSyn generated by AIM.
FIGURE 4.
Difference images between μ4DCT and μSyn at end-inspiration gate. Right 3 columns represent results of CTAC-based, NAC-based, and AIM methods, respectively. AC map is shown as reference. (A) Coronal slice at right-lung region with large tumor. Arrows point to top of tumor. (B) Coronal slice of right-lung region, where arrows point to liver–lung border.
TABLE 1.
Percentage Error for Various ROIs for 18F-FMISO Validation Study Comparing PET-Based and 4D CT-Based Motion Estimation
| ROI region | CTAC-based | NAC-based | AIM |
| Liver-dome | 13.9% ± 19.9% | 4.9% ± 8.7% | 3.2% ± 4.4% |
| Large tumor (mid right) | 2.2% ± 7.0% | 1.8% ± 6.3% | −1.3% ± 2.0% |
| Small tumor (mid left) | −7.1% ± 2.6% | −6.3% ± 2.5% | −4.3% ± 2.2% |
Data are μErr% (g) ± SD. SD is calculated across all gates.
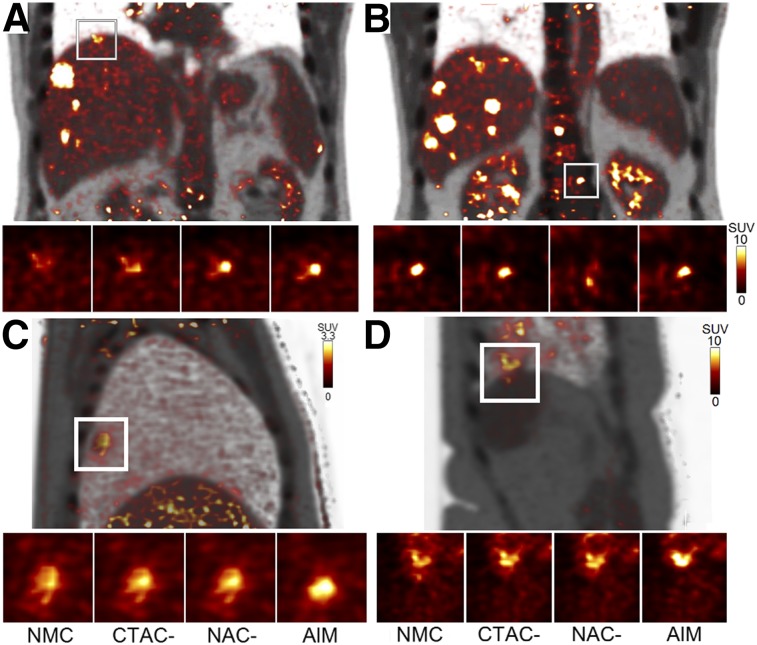
Sample results from 18F-FDG studies are shown in Figure 5. Figure 5A shows that the CTAC-based method partially restored the liver-lesion shape and contrast (SUVmean of 6.4, vs. 5.5 with NMC) whereas both NAC-based (SUVmean of 8.7) and AIM (SUVmean of 8.8) showed a substantial improvement. The spine tumor (Fig. 5B) had the highest contrast with NMC (SUVmean of 7.7), which is expected because the spine position was unaffected by respiration. AIM (SUVmean of 7.5) and CTAC-based (SUVmean of 7.5) methods performed equally well in keeping the spine static, whereas the NAC-based (SUVmean of 4.6) method introduced blurring. Figures 5C and 5D show that AIM achieved the highest tumor contrast and the smallest apparent tumor volume among the 3 methods.
FIGURE 5.
Sample slices of final motion-corrected reconstructions of 18F-FDG studies: coronal slices from study 2 (A and B), image from study 3 (C), and image from study 9 (D). PET and CT fused images are shown for whole field of view. Zoomed-in images of local ROIs show results for NMC and different correction methods.
Quantitatively, for 18F-FDG studies (Table 2), CTAC- and NAC-based methods provided similar increases in average SUVmean (14.0% vs. 13.2%), SUVmax (10.8% vs. 10.6%), and SUR (17.6% vs. 16.2%). No statistical significance (P > 0.05) was found between CTAC- and NAC-based methods for any metrics. However, the AIM method (SUVmean, 19.9%; SUVmax, 15.5%; SUR, 24.1%) significantly outperformed CTAC- and NAC-based methods for all metrics (P < 0.006). The NAC-based method outperformed the CTAC-based method for lesions close to the lung–liver boundary, likely because of AC artifacts, whereas the CTAC-based method outperformed the NAC-based method for lesions in the body center. In contrast, AIM consistently outperformed both the CTAC- and the NAC-based methods for nearly all lesions independent of their locations. Overall, AIM increased SURs over NMC for 94.4% of lesions (323 in total), as compared with 84.8% and 86.4% for the CTAC- and NAC-based methods, respectively (Supplemental Fig. 2). For a subset of 65 lesions close to the liver boundary and lung boundary, we observed a larger improvement for AIM than for the CTAC or NAC method in SUVmean (respectively: 26.1% vs. 11.2% and 15.4%), SUVmax (26.9% vs. 8.1% and 16.0%), and SUR (27.5% vs. 10.7% and 14.6%).
TABLE 2.
Percentage Increases in SUVmean, SUVmax, and SUR
| SUVmean |
SUVmax |
SUR |
||||||||||
| Tracer | Study | ROIs | Motion (mm)* | CTAC | NAC | AIM | CTAC | NAC | AIM | CTAC | NAC | AIM |
| 18F-FDG | 1 | 17 | 5.3 (2.0–8.3) | 16.7 ± 19.5 | 18.2 ± 19.2 | 21.1 ± 18.4 | 13.9 ± 14.4 | 15.6 ± 16.0 | 15.6 ± 10.0 | 33.2 ± 22.3 | 35.0 ± 21.9 | 40.5 ± 21.3 |
| 2 | 106 | 5.4 (1.7–9.4) | 24.6 ± 26.6 | 22.4 ± 23.5 | 28.0 ± 28.7 | 19.7 ± 22.5 | 21.2 ± 26.1 | 22.6 ± 24.2 | 26.5 ± 27.0 | 21.1 ± 23.3 | 27.9 ± 26.8 | |
| 3 | 1 | 6.9 | 6.9 | 4.9 | 20.2 | −0.4 | 0.1 | 20.5 | 13.2 | 7.8 | 26.9 | |
| 4 | 25 | 8.4 (2.5–16.2) | 38.5 ± 48.8 | 30.8 ± 48.8 | 42.2 ± 50.3 | 26.6 ± 50.0 | 20.9 ± 50.6 | 29.2 ± 57.0 | 37.3 ± 48.4 | 29.5 ± 48.3 | 43.1 ± 50.6 | |
| 5 | 28 | 8.3 (3.8–25.2) | 13 ± 19.4 | 16.3 ± 21.2 | 19.3 ± 20.6 | 10.6 ± 23.8 | 14.5 ± 28.9 | 11.2 ± 21.1 | 12.0 ± 19.2 | 15.2 ± 21.0 | 19.3 ± 20.6 | |
| 6 | 3 | 3.0 (1.6–4.2) | 7.0 ± 3.8 | 2.8 ± 6.8 | 10.2 ± 2.0 | 6.4 ± 5.7 | 2.0 ± 5.9 | 6.6 ± 4.5 | 6.7 ± 3.8 | 0.4 ± 6.6 | 9.8 ± 2.0 | |
| 7 | 3 | 3.6 (1.3–5.8) | 2.6 ± 2.7 | 3.5 ± 3.3 | 5.6 ± 3.5 | 5.2 ± 6.1 | 2.6 ± 6.2 | 5.9 ± 5.6 | 9.6 ± 2.9 | 11.7 ± 3.6 | 11.9 ± 3.8 | |
| 8 | 88 | 8.7 (1.8–14.0) | 24.9 ± 20.1 | 25.3 ± 19.9 | 31.3 ± 23.2 | 23.1 ± 19.5 | 23.8 ± 19.3 | 27.7 ± 20.6 | 19.6 ± 19.3 | 21.3 ± 19.3 | 28.0 ± 22.7 | |
| 9 | 36 | 7.0 (1.8–14.7) | 2.9 ± 7.5 | 5.7 ± 6.5 | 15.1 ± 12.7 | −0.1 ± 13.6 | 2.8 ± 12.3 | 9.3 ± 14.5 | −1.5 ± 7.2 | 2.4 ± 6.3 | 12.2 ± 12.4 | |
| 10 | 16 | 4.6 (2.6–7.3) | 3.4 ± 7.1 | 2.0 ± 10.0 | 5.7 ± 7.9 | 3.2 ± 6.1 | 2.4 ± 12.6 | 5.9 ± 11.0 | 19.9 ± 8.3 | 17.4 ± 11.5 | 21.7 ± 9.1 | |
| Mean† | 6.1 | 14.0 | 13.2 | 19.9 | 10.8 | 10.6 | 15.5 | 17.6 | 16.2 | 24.1 | ||
| 18F-FPDTBZ | 1 | Kidney | 11.7 | 24.3 | 28.8 | 28.5 | 6.9 | 8.3 | 9.9 | 26.6 | 28.6 | 32.0 |
| Pancreas | 9.2 | 23.1 | 28.3 | 27.9 | 5.8 | 8.6 | 8.2 | 25.4 | 28.0 | 31.4 | ||
| Spine | 1.4 | −3.1 | −19.7 | −2.9 | −2.0 | −21.6 | −1.9 | −1.3 | −19.9 | −0.3 | ||
| 2‡ | Kidney | 14.7 | 31.2 | 25.7 | 34.4 | 20.3 | 23.0 | 21.9 | — | — | — | |
| Pancreas | 14.2 | 17.5 | 17.7 | 17.9 | 5.4 | 5.0 | 5.3 | — | — | — | ||
| Spine | 2.8 | −0.7 | −35.6 | −1.6 | −3.8 | −24.0 | −5.5 | — | — | — | ||
| 18F-FMISO | 1 | Large tumor (avid area) | 11.8 | 9.6 | 10.9 | 11.1 | 1.6 | 1.9 | 2.1 | 12.9 | 14.9 | 14.9 |
| Small tumor | 5.3 | 15.0 | 21.1 | 21.6 | 8.6 | 17.1 | 17.3 | 18.4 | 25.5 | 25.8 | ||
Mean and range of motion amplitudes estimated between end-inspiration and end-expiration gates across all lesions for each subject.
10 studies (323 ROIs).
No SUR result is reported for study 2 since heart was out of field of view.
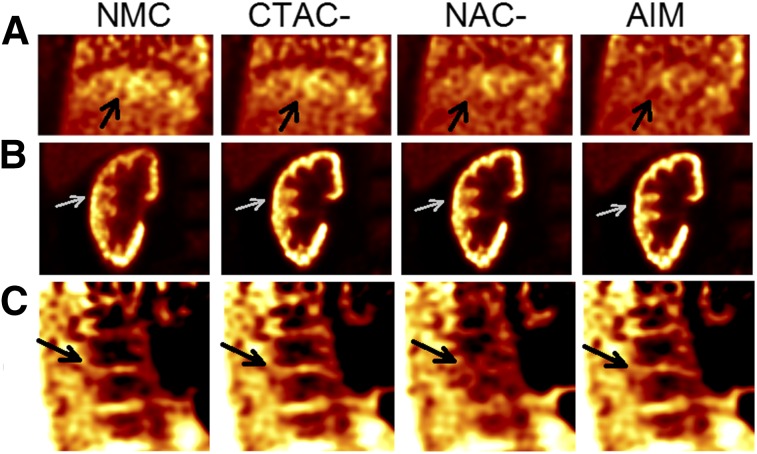
As shown in Figure 6A, because of mismatched AC, the banana artifact induced motion-estimation errors that propagated to the motion-compensated reconstruction (black arrows) for the CTAC-based method, which had only a marginal artifact reduction compared with NMC. In contrast, both the NAC-based method and AIM largely removed this artifact. Figure 6B shows that the AIM method restored kidney cortices most clearly among the 3 methods. In Figure 6C, as in Figure 5B, the NAC-based method erroneously blurred the spine whereas CTAC and AIM did not.
FIGURE 6.
Final reconstruction examples of 18F-FPDTBZ studies with different correction methods. (A) Coronal liver–lung region for study 1. Arrows point to lung–liver border. (B) Coronal right-kidney region for study 2. Arrows point to right-kidney cortex. (C) Sagittal spine region for study 1. Arrows point to bone marrow gap.
As further demonstrated in Table 2, for the 18F-FPDTBZ studies, all 3 methods performed equally well for kidney and pancreas ROIs except the NAC-based method, which blurred the spine. For the 18F-FMISO study, the differences for the large tumor among the 3 methods were relatively small, because larger tumors are less sensitive to motion. For the small tumor, the AIM and NAC-based methods slightly outperformed the CTAC-based method. The results based on signal-to-noise ratios were similar, as presented in Supplemental Table 2.
DISCUSSION
In PET/CT studies, fast helical CT results in mismatched AC for gated PET, which affects the accuracy of motion estimation and subsequent motion correction. Prior studies considered the NAC-based method (8) as an alternative to the CTAC-based approach to avoid the CT-mismatch artifact. The NAC-based approach provides satisfactory results for lesions close to the lung–liver interface but unsatisfactory corrections for lesions in the center of the body. To address such limitations, we presented a fully automated respiratory motion correction framework, AIM, which builds the motion model based on MLACF-reconstructed gated PET data without mismatch artifacts. By comparing with model-building methods using CTAC and NAC-based gated PET data, AIM showed improvements in SUVmean, SUVmax, SUR, and signal-to-noise ratio for 3 tracers. The reference-phase determination algorithm can successfully identify the PET reference phase that best matches the helical CT attenuation map, regardless of using breath-hold or free-breathing protocols.
In this study, AIM achieved superior performance by using event-by-event correction with list-mode reconstruction. However, the motion estimation based on attenuation-matched gated PET data and the reference-phase selection method presented in this study can also be applied to sinogram-based motion correction methods, such as postreconstruction registration and motion-compensated image reconstruction, which cannot correct intragate motion but can correct intergate motion.
There are several limitations and future directions for the proposed AIM method. First, as shown in Supplemental Fig. 2, the ROIs of 2 patients were under the identity line. These ROIs corresponded to lesions at the edge of the spine, where there were spatial motion discontinuities. The current free-form deformation registration transformation model with relatively large control-point spacing cannot accurately capture this motion, a fact that might explain the bias for the 2 lesions. Second, the parameters used in the study, such as the kernel sizes in smoothing filter, were chosen empirically rather than being optimal. Future parameter-optimization work is needed. Third, compared with the CTAC-based approach, gated PET in AIM is noisier because of the transmissionless reconstruction (17), which may introduce additional noise-induced errors in motion-estimating registrations, especially for low-dose protocols (18,19). To address the potential high-noise issue, more sophisticated postreconstruction denoising algorithms (20) or regularized transmissionless reconstruction algorithms might be needed. Fourth, although AIM is able to identify the reference PET gate that best matches the CT image, there could be changes in the patient’s respiratory pattern between the CT and PET acquisitions. Such changes would introduce additional CT-mismatch artifacts during the final reconstruction. To address this problem, our INTEX framework would need to warp the CT-μ to match one PET gate based on the estimated motion model (21) or directly use the MLAA-μ as the AC map in the final ordered-subsets expectation maximization reconstruction.
In this study, normalized mutual information (NMI) was used as the similarity metric for motion estimation registration. By trial and error, we found NMI to be the most robust metric, compared with metrics such as sum squared difference and cross correlation. In terms of computation cost, AIM requires N (number of gates) gated reconstructions, N − 1 nonrigid registrations, and one event-by-event list-mode reconstruction. To make AIM clinically feasible, acceleration with graphics processing unit–based list-mode reconstruction might be needed.
CONCLUSION
A new PET/CT respiratory motion correction framework, AIM, has been developed and evaluated. It automatically selects the PET reference phase that best matches the CT image, builds a motion model based on attenuation-matched gated PET data, and corrects inter- and intragate respiratory motion in an event-by-event fashion. AIM provided motion correction superior to that of the CTAC- and NAC-based methods and was shown to be applicable to multiple tracers.
DISCLOSURE
This work was funded by a research contract from Siemens Medical Solutions, by NIH grants S10RR29245 and 1S10RR029245-01, and by CTSA grant UL1 TR000142 from the National Center for Advancing Translational Science (NIH). The contents of this work are solely the responsibility of the authors and do not necessarily represent the official view of NIH. No other potential conflict of interest relevant to this article was reported.
Supplementary Material
REFERENCES
- 1.Xu Q, Yuan K, Ye D. Respiratory motion blur identification and reduction in ungated thoracic PET imaging. Phys Med Biol. 2011;56:4481–4498. [DOI] [PubMed] [Google Scholar]
- 2.Goerres GW, Burger C, Kamel E, et al. Respiration-induced attenuation artifact at PET/CT: technical considerations. Radiology. 2003;226:906–910. [DOI] [PubMed] [Google Scholar]
- 3.Osman MM, Cohade C, Nakamoto Y, Marshall LT, Leal JP, Wahl RL. Clinically significant inaccurate localization of lesions with PET/CT: frequency in 300 patients. J Nucl Med. 2003;44:240–243. [PubMed] [Google Scholar]
- 4.Liu C, Pierce LA, Alessio AM, Kinahan PE. The impact of respiratory motion on tumor quantification and delineation in static PET/CT imaging. Phys Med Biol. 2009;54:7345–7362. [DOI] [PMC free article] [PubMed] [Google Scholar]
- 5.Nehmeh SA, Erdi YE, Ling CC, et al. Effect of respiratory gating on quantifying PET images of lung cancer. J Nucl Med. 2002;43:876–881. [PubMed] [Google Scholar]
- 6.Klein GJ, Reutter BW, Huesman RH. Four-dimensional affine registration models for respiratory-gated PET. IEEE Trans Nucl Sci. 2001;48:756–760. [Google Scholar]
- 7.Lamare F, Carbayo MJL, Cresson T, et al. List-mode-based reconstruction for respiratory motion correction in PET using non-rigid body transformations. Phys Med Biol. 2007;52:5187–5204. [DOI] [PubMed] [Google Scholar]
- 8.Fayad HJ, Lamare F, Le Rest CC, Bettinardi V, Visvikis D. Generation of 4-dimensional CT images based on 4-dimensional PET-derived motion fields. J Nucl Med. 2013;54:631–638. [DOI] [PubMed] [Google Scholar]
- 9.Panin VY, Defrise M, Nuyts J, Rezaei A, Casey ME. Reconstruction of uniform sensitivity emission image with partially known axial attenuation information in PET-CT scanners. 2012 IEEE Nuclear Science Symposium and Medical Imaging Conference Record (NSS/MIC). Piscataway, NJ: IEEE; 2012:2166–2173. [Google Scholar]
- 10.Panin VY, Aykac M, Casey ME. Simultaneous reconstruction of emission activity and attenuation coefficient distribution from TOF data, acquired with external transmission source. Phys Med Biol. 2013;58:3649–3669. [DOI] [PubMed] [Google Scholar]
- 11.Chan C, Onofrey J, Jian Y, et al. Non-rigid event-by-event continuous respiratory motion compensated list-mode reconstruction for PET. IEEE Trans Med Imaging. 2018;37:504–515. [DOI] [PMC free article] [PubMed] [Google Scholar]
- 12.Jin X, Chan C, Mulnix T, et al. List-mode reconstruction for the Biograph mCT with physics modeling and event-by-event motion correction. Phys Med Biol. 2013;58:5567–5591. [DOI] [PMC free article] [PubMed] [Google Scholar]
- 13.Normandin MD, Petersen KF, Ding YS, et al. In vivo imaging of endogenous pancreatic beta-cell mass in healthy and type 1 diabetic subjects using 18F-fluoropropyl-dihydrotetrabenazine and PET. J Nucl Med. 2012;53:908–916. [DOI] [PMC free article] [PubMed] [Google Scholar]
- 14.Carlin S, Humm JL. PET of hypoxia: current and future perspectives. J Nucl Med. 2012;53:1171–1174. [DOI] [PubMed] [Google Scholar]
- 15.Joshi A, Scheinost D, Okuda H, et al. Unified framework for development, deployment and robust testing of neuroimaging algorithms. Neuroinformatics. 2011;9:69–84. [DOI] [PMC free article] [PubMed] [Google Scholar]
- 16.Rueckert D, Sonoda LI, Hayes C, Hill DLG, Leach MO, Hawkes DJ. Nonrigid registration using free-form deformations: application to breast MR images. IEEE Trans Med Imaging. 1999;18:712–721. [DOI] [PubMed] [Google Scholar]
- 17.Rezaei A, Defrise M, Bal G, et al. Simultaneous reconstruction of activity and attenuation in time-of-flight PET. IEEE Trans Med Imaging. 2012;31:2224–2233. [DOI] [PubMed] [Google Scholar]
- 18.Lu Y, Fontaine K, Germino M, et al. Investigation of sub-centimeter lung nodule quantification for low-dose PET. IEEE Trans Radiat Plasma Med Sci. 2018;2:41–50. [Google Scholar]
- 19.Schaefferkoetter JD, Yan J, Sjöholm T, et al. Quantitative accuracy and lesion detectability of low-dose 18F-FDG PET for lung cancer screening. J Nucl Med. 2017;58:399–405. [DOI] [PubMed] [Google Scholar]
- 20.Chen Y, Shi L, Feng Q, et al. Artifact suppressed dictionary learning for low-dose CT image processing. IEEE Trans Med Imaging. 2014;33:2271–2292. [DOI] [PubMed] [Google Scholar]
- 21.Rezaei A, Michel C, Casey ME, Nuyts J. Simultaneous reconstruction of the activity image and registration of the CT image in TOF-PET. Phys Med Biol. 2016;61:1852–1874. [DOI] [PubMed] [Google Scholar]
Associated Data
This section collects any data citations, data availability statements, or supplementary materials included in this article.


