Abstract
Bioassay-guided fractionation is an iterative approach that uses the results of physiological and behavioral bioassays to guide the isolation and identification of an active pheromone compound. This method has resulted in the successful characterization of the chemical signals that function as pheromones in a wide range of animal species. Sea lampreys rely on olfaction to detect pheromones that mediate behavioral or physiological responses. We use this knowledge of fish biology to posit functions of putative pheromones and to guide the isolation and identification of active pheromone components. Chromatography is used to extract, concentrate, and separate compounds from the conditioned water. Electro-olfactogram (EOG) recordings are conducted to determine which fractions elicit olfactory responses. Two-choice maze behavioral assays are then used to determine if any of the odorous fractions are also behaviorally active and induce a preference. Spectrometric and spectroscopic methods provide the molecular weight and structural information to assist with the structure elucidation. The bioactivity of the pure compounds is confirmed with EOG and behavioral assays. The behavioral responses observed in the maze should ultimately be validated in a field setting to confirm their function in a natural stream setting. These bioassays play a dual role to 1) guide the fractionation process and 2) confirm and further define the bioactivity of isolated components. Here, we report the representative results of a sea lamprey pheromone identification that exemplify the utility of the bioassay-guided fractionation approach. The identification of sea lamprey pheromones is particularly important because a modulation of its pheromone communication system is among the options considered to control the invasive sea lamprey in the Laurentian Great Lakes. This method can be readily adapted to characterize the chemical communication in a broad array of taxa and shed light on waterborne chemical ecology.
Keywords: Biochemistry, Issue 137, Chemical communication, chemical ecology, olfaction, small molecule isolation, chemical structure elucidation, liquid chromatography, nuclear magnetic resonance (NMR), electro-olfactogram (EOG) recording, two-choice maze, Cyclostomata, integrated pest management, invasive species
Introduction
Pheromones are specific chemical signals released by individuals that aid them in locating food sources, detecting predators, and mediating social interactions of conspecifics1. Pheromone communication in insects has been well studied2; however, the chemical identification and biological function of aquatic vertebrate pheromones have not been studied as extensively. Knowledge of the identity and function of the pheromones released can be applied to facilitate the recovery of threatened species3,4 or control pest species5,6. The application of these techniques necessitates the isolation and characterization of the bioactive pheromone components.
Pheromone identification is a branch of natural product chemistry. Progress in pheromone research has been partially limited due to the nature of the pheromone molecules themselves. Pheromones are often unstable and released in small quantities, and only a few sampling techniques exist to detect minute amounts of volatile7,8 or water-soluble compounds9. Approaches to identify pheromones include 1) a targeted screening of known compounds, 2) metabolomics, and 3) bioassay-guided fractionation. A targeted screening of known compounds tests commercially available metabolic by-products of physiological processes hypothesized to function as pheromones. This approach is limiting because researchers can only test known and available compounds. However, it has resulted in the successful identification of sex hormones in goldfish that function as pheromones10,11,12. Metabolomics is a second pheromone identification approach that distinguishes potential small molecule metabolic products within a biological system13. A comparison of the metabolic profiles of two groups (i.e., an active versus an inactive extract) enables the identification of a potential metabolic profile from which the metabolite is purified, the structure is elucidated, and the bioactivity is confirmed14. Additive or synergistic effects of complex formulations of specific mixtures are more likely to be detected with metabolomics because metabolites are considered together rather than as a series of fractions13. Yet, the implementation of metabolomics relies on the availability of synthetic references because the resulting data do not facilitate the elucidation of novel structures.
Bioassay-guided fractionation is an integrated, iterative approach that spans two fields: chemistry and biology. This approach uses the results of physiological and behavioral bioassays to guide the isolation and identification of an active pheromone compound. A crude extract is fractionated by a chemical property (i.e., molecular size, polarity, etc.) and tested with electro-olfactogram (EOG) recordings and/or in a bioassay. The bioactive components are screened out by repeating these steps of fractionation and EOGs and/or bioassays. The structures of pure active compounds are elucidated by spectrometric and spectroscopic methods, which provide the molecular weight and structural information to produce a template of the compound to be synthesized. Bioassay-guided fractionation can yield diverse metabolites and potentially novel pheromones with unique chemical skeletons that are unlikely to be predicted from the biosynthetic pathways.
Here, we describe the bioassay-guided fractionation protocol used to isolate and characterize the bioactivity of male sea lamprey sex pheromone compounds. The sea lamprey (Petromyzon marinus) is an ideal vertebrate model to study pheromone communication because these fish rely heavily on the olfactory detection of chemical cues to mediate their anadromous life history comprised of three distinct stages: larvae, juvenile, and adult. Sea lamprey larvae burrow into the sediment of freshwater streams, undergo a drastic metamorphosis, and transform into juveniles that migrate to a lake or ocean where they parasitize large host fish. After detaching from the host fish, the adults migrate back into spawning streams, guided by the migratory pheromones released by stream-resident larvae15,16,17,18,19. Mature males ascend to the spawning grounds, release a multi-component sex pheromone to attract mates, intermittently spawn for approximately a week, and then die15,20. The identification of sea lamprey pheromones is important because a modulation of the pheromone communication system is among the options considered to control the invasive sea lampreys in the Laurentian Great Lakes21.
Protocol
All methods described here have been approved by the Institutional Animal Care and Use Committee of Michigan State University (AUF# 03/14-054-00 and 02/17-031-00).
1. Collection and Extraction of Sea Lamprey Conditioned Water
Place sexually mature male sea lampreys (15 - 30 animals) in a tank supplied with 250 L of aerated Lake Huron water maintained at 16 - 18 °C.
Collect the male-conditioned water throughout each night from June to July. Note: Sea lampreys naturally die after spawning. If a fish is nearing this point in its life, replace it with a fresh mature male.
- Extract the conditioned water by solid phase extraction.
- Soak the resin in methanol for 4 h before loading it into a column. Load the resin into the column, then pump 10 L of water through the column to eliminate the organic solvent.
- Pass the conditioned water from the tank holding the fish via the pumping system to the top of the column. The water passes through a bed of 2 kg of moderately polar polymeric ion-exchange resin (e.g., Amberlite XAD-7 HP resin), contained in a series of four 2.5 L-capacity glass columns. Maintain load speeds between 400 and 600 mL/6 min. Elute the metabolites with 10 L of methanol followed immediately by 5 L of acetone. CAUTION: This step uses methanol and acetone. Both are flammable and poisonous. Note: The pooled residual can be stored at -80 °C until further processed.
Reactivate the column after 1 week of enrichment by washing it with water (approximately 10 L).
Remove the organic solvent (the mixture of methanol and water) and harvest the extract by rotatory evaporation for 5 h under reduced pressure (under 300 mbar) at 40 °C. Concentrate the water residue by freeze dryer lyophilization for 48 h at -20 °C until dry.
2. Isolation of Fraction Pools with Chromatography
Soak the silica gel (230 - 400 mesh) in the initial mobile phase for 30 min. Transfer the gel with the solvent (suspension) to a glass column. Open the valve of the column to allow the mobile phase to go through. Allow the silica gel to precipitate and form a silica gel bed.
Mix the extracts with silica gel (70 - 230 mesh) thoroughly and load them into the liquid chromatography column over the silica gel bed. Elute them with a gradient from 95% CHCl3 (chloroform)/MeOH (methanol) to 100% MeOH, 2.5 L in total volume. Collect the eluent in individual vials (each 10 ml). CAUTION: The chloroform used in this step is a poisonous reagent.
- Guide the pooling of the eluents into 20 fractions by a thin layer chromatography (TLC) analysis.
- Perform the TLC experiment on pre-coated silica gel plates by applying the sample on the starting line and immersing the starting line of the plate in the developing solvents (choose the polarity by the ratio of CHCl3 to methanol from 100 - 0%) in a sealed glass tank.
- Select the ratio of developing solvent to make all the TLC spots with a retention factor (Rf) ranging from 0.3 - 0.8.
- After the developing solvent reaches the end line, take the plate out of the tank, and wait 10 min for the solvent to evaporate.
- Visualize the spots first under UV light at 254 nm and then stain them by spraying them with an acidic methanol solution of 5% anisaldehyde (20 μL) by a chromatography sprayer and heating them at 85 °C for 3 min. Note: The colorful spots on the TLC plate indicate the main component in the fraction.
- Combine the eluent to 20 fractions based on the spot color and the Rf similarity of the main component.
Concentrate the fraction to a residue by rotatory evaporation under reduced pressure (300 mbar according the property of solvents) at 40 °C for approximately 30 min.
3. Electro-olfactogram (EOG) Recordings to Identify Odorous Fractions/Compounds
Pull borosilicate glass capillaries (outer diameter: 1.5 mm; inner diameter: 0.86 mm; length: 100 mm) with a micropipette puller with the heater level set to 65.
Score and cut the opening at the tip of the capillary with a diamond-tipped glass cutter and fill it with molten 0.4% agar in 0.9% saline. The opening at the tip of the capillary should be around 10 µm in diameter.
Fill the pulled capillary electrodes from steps 3.1 - 3.2 and solid-state electrodes holders pre-fabricated with Ag/AgCl pellets (see Table of Materials) with 3 M KCl using a micropipette. Note: Dislodge any air bubbles in the capillary or the electrode holder.
Insert the pulled electrodes in the electrode holders.
Prepare 100 mL of 10-5 M L-arginine in charcoal-filtered water from a 10-2 M L-arginine stock solution in deionized water (stored at 4 °C) in a volumetric flask. Transfer 20 mL of the 10-5 M L-arginine to a glass vial.
For the concentration-response curve, prepare 10 mL of 10-fold dilutions of the fraction pools from step 2.3 in glass vials. Prepare fresh dilutions daily prior to the experiments and use them within a day. Put the glass vials of the working solutions of L-arginine and the fraction pool dilutions in a recirculating water bath to allow the temperature to equilibrate to 8 °C.
Anesthetize the lamprey with 3-aminobenzoic acid ethyl ester (MS222; 100 mg/L) and immobilize it with an intramuscular injection of gallamine triethiodide (3 mg/kg of body weight, in 0.9% saline) with a sterile syringe. Note: A sufficient depth of anesthesia is determined by observing no gill motion, an inability to maintain an upright posture, and no suction to the sides of the tank using its oral disk. To minimize any microbial contamination before and during surgery, wear sterile gloves and soak the dissection tools in 70% ethanol (v:v) in deionized water for at least 10 min before use.
Orient the anesthetized lamprey in a V-shaped stand and wrap it with a wet paper towel to prevent desiccation. Note: Do not obstruct the gill openings.
Insert a tube of recirculating aerated water containing 50 mg/L of MS222 into the buccal cavity, adjust the flow rate, and ensure that water is exiting via the gill openings to continuously irrigate the gills.
Use a sterile scalpel and forceps [under the stereoscopic microscope at a 1.25X magnification (see Table of Materials)] to remove a 5 mm2 section of the skin on the surface of the olfactory capsule to expose the olfactory epithelium.
Flush the odorant delivery tubing with filtered water and connect it to the valve mounted on a micromanipulator. Place the odorant delivery capillary tube into the olfactory epithelium cavity using the micromanipulator to deliver filtered water to the olfactory epithelium to prevent desiccation when not administering odorants.
Mount the recording and reference electrodes on the micromanipulators. Lower the reference electrode onto the external skin near the naris. Using the stereoscopic microscope (1.25X), lower the recording electrode to barely touch the surface of the olfactory epithelium.
Transfer the uptake of the odorant delivery tube from the background filtered water to the 10-5 M L-arginine solution.
Turn on the computer, amplifier (set to DC mode), filter, and digitizer. Using the valve driver software, program the procedure to administer a 4 s single pulse of odorant by checking the box of T1, setting T to 4 s, and checking the box of T2.
In the data acquisition software (see Table of Materials), set the acquisition mode to a high-speed oscilloscope, click the play icon, and then click Start in the valve driver to trigger the odorant pulse. Note: The data acquisition software automatically records the differential EOG response amplitude for 20 s (3 s before, 4 s during the odorant pulse and 13 s afterward). Use the micromanipulator to maneuver the positions of the recording electrode, reference electrode, or odorant delivery tube to increase the signal-to-noise ratio with a maximum response to the L-arginine standard and a minimal response to the blank control (filtered water). Ground the amplifier by switching the AC-DC amplifier switch to GND while moving the electrodes.
Start recording the blank control, L-arginine, and then the odorants prepared in step 3.6 from low to high concentrations with a 2 min flush of filtered water between applications.
After recording responses to all the odorants to be tested, ground the amplifier and carefully retract the electrodes and odorant delivery capillary tube. Following the approved Institutional Animal Care and Use Committee (IACUC) methods, at the termination of the EOG experiment, euthanize the anesthetized lamprey with an overdose of MS222 (1 g/L). Note: Verify successful euthanasia by noting a lack of gill movement and heartbeat for at least 5 min followed by pithing the brain.
Analyze and plot the data using analysis software. Determine the threshold of detection of the odorants22 to identify odorous fractions that elicit responses greater than the blank water control. The fraction pools that elicit concentration-dependent olfactory responses that are different than the blank water control are then tested in a behavioral assay (step 4).
4. Two-choice Maze Behavioral Bioassay to Identify Behaviorally Active Fractions/Compounds
Acclimate the sexually mature female sea lamprey in the release cage in the maze (see Supplementary Figure 1) for 5 min. Maintain the flow rate of the river water in the maze Note: The maze is built from varnished marine grade wood and measures 6.5 m in length and 1.2 m in width with a divider measuring 2.7 m in length to separate the maze into two channels at the upstream end. Water is temporarily diverted into the maze. The water depth should be maintained at 0.19 m and the velocity should be maintained at 0.07 m/s ± 0.01.
Release the sea lamprey and record the cumulative amount of time the lamprey spends in the experimental and control channel each containing river water for 10 min. Note: If the sea lamprey fails to enter the experimental and control channel for at least 10 s during this 10 min period, end the trial, as this is an indication of inactivity or strong side bias.
Apply the test stimulus (i.e., a putative pheromone at 10-12 M dissolved in 50% methanol/deionized water) to the randomly assigned experimental channel and the vehicle (50% methanol/deionized water) to the control channel using peristaltic pumps at constant rates of 200 mL/min for 5 min. Note: The detection threshold concentration of the test stimulus as determined with the electro-olfactogram recordings should be used as the initial concentration for the behavioral test.
Apply the test stimulus and the vehicle for an additional 10 min and record the cumulative amount of time the lamprey spends in the experimental and control channel.
Flush the maze with water for 10 min before the start of the next trial. Repeat steps 4.1 - 4.4 with at least 7 lampreys if sufficient test stimulus is available.
Calculate an index of preference22 for each trial and evaluate the significance using a Wilcoxon signed-rank test. Note: The index results in a single number that can be either positive or negative. A positive value of the index of preference indicates attraction, whereas a negative value of the index of preference indications repulsion. If the index of preference is significantly different from zero, the fraction is deemed active.
 Here, Bc = the time spent by the test lamprey in the control channel before the odorant application, Be = the time spent in the experimental channel before the odorant application, Ac = the time spent in the control channel after the odorant application, and Ae = the time spent in the experimental channel after the odorant application.
5. Chromatographic Isolation of Pure Compounds from Active Fractions
Repeat steps 2.1 - 2.4 with the fraction pools that induce olfactory responses (step 3) and elicit behavioral responses (step 4).
- Further purify the active fractions into compounds with size-exclusion chromatography using a Sephadex LH-20 column.
- Prepare the sample in 0.5 mL in the initial mobile phase [CHCl3-MeOH (1:1) or MeOH 100%], load into the corresponding column a CHCl3-MeOH (1:1) column and then a MeOH (100%) column, and elute them to yield the compounds.
6. Structure Elucidation of a Pure Compound with Mass Spectrometry (MS) and Nuclear Magnetic Resonance (NMR)
- Dissolve and dilute the purified compound in the initial mobile phase (usually, methanol to water, 1:1, v:v) of high-performance liquid chromatography (HPLC) to form a 10 μL solution of approximately 1 μg/mL.
- Transfer the sample solution to HPLC vials and set them into the autosampler of HPLC. Inject the sample (10 μL) into the electrospray ionization mass spectrometry (ESIMS) and record the high-resolution electrospray ionization mass spectrometry (HRESIMS) spectra using a chromatography mass spectrometer23.
- Predict the molecular formula according to the database in the mass spectrometer software (see Table of Materials)24.
- Open the chromatogram of the injected sample and obtain its mass spectrum by selecting the chromatographic peak.
- Input the measured mass to ion (m/z) value (4 decimals) in Elemental composition under the Tool module. Set the tolerance parameter to PPM < 5.
- Adjust the symbol parameters to fit the element composition of the measured molecule. The software produces a prediction of molecular formula based on the single mass analysis.
- Select the deuterated solvents (600 μL, CH3OH-d4 or DMSO-d6) according to the protocol25 to dissolve the samples.
- Completely dissolve the sample in the selected deuterated solvents to form a solution with a concentration ranging approximately from 0.1 to 10 mg/mL. Transfer the sample solution into an NMR tube to record the 1D (1H, 13C) and 2D NMR [1H-1H correlation spectroscopy (COSY), heteronuclear single quantum coherence (HSQC), heteronuclear multiple bond correlation (HMBC)] spectra on a 900 MHz NMR spectrometer26.
Place the NMR tube with the sample inside the spinner turbine. Use the depth gauge to ensure the sample height is in the middle of the measuring window. Open the NMR software (see Table of Materials) and click the Lift button to change the sample in the magnet. Note: Hold a hand over the top of the magnet to feel the gas coming from the top of the magnet. At the same time, a whistling sound should be audible.
Gently place the sample on the air cushion on top of the magnet and push the Lift button again to descend the sample into the NMR magnet. Note: Listen for a “click” noise to indicate the sample is in the right position.
- Create a new dataset and load the default parameters recommended by the NMR instrument (see Table of Materials).
- Type “lock” to invoke the automatic locking procedure and select the solvent at the prompt page.
- For fine-tuning, in the Manipulate panel, adjust the button in the Unlock model, adjust the cursor on the manipulate panel, and lock the magnet again.
- On the prompt Atma page, adjust the parameter in the manipulate panel to the tuning procedure, which may take a few minutes. Wait until the tuning is completed to proceed.
- Start the automatic shimming routine by typing “topshim” in the prompt. Wait until the shimming is completed to proceed.
- Type “rga” to set automatic receiving gain adjustments, then type “d1” to set the delay between pulses, then type “zg” to start the acquisition, and wait until the acquisition finishes.
- Type “ef” or “efp” to process the data and then type “apk” for automatic phasing. Process the data on the NMR processing software.
Elucidate the chemical structure by an interpretation of the NMR data analysis.
Count the carbon signals in the 13C NMR spectrum. Select the matched molecular formula from the predicted result in high-resolution mass spectrometry (HR-MS).
Integrate the proton signals in the 1H NMR spectrum and assign the connectivity of the carbon- and proton-based on the signals in the HSQC spectrum.
Assign the connectivity of the carbon skeleton based on the correlations in the 1H-1H COSY and HMBC spectrum.
Tentatively assign the chemical structure based on the structure rationale27. Search the tentative structure in the chemical structure databases. Compare the tentative structure with the analogs in references.
Assign the relative configuration with the Nuclear Overhauser Effect Spectroscopy (NOESY) spectrum. Note: Since the identity properties of enantiomers displayed on spectrometry and spectroscopic methods are identical, the absolute configuration of some compounds, especially those with 2’-alcohol and 2’-NH2, has to be determined with a derivatization reaction. After the derivatization reaction, the differences indicated on the spectra facilitate the unequivocal assignment of the absolute configurations of most compounds28.
7. EOG and Bioassay to confirm pure compounds are odorous and behaviorally active
Repeat steps 3.1 - 3.5.
For the concentration-response curve, prepare 10 mL of 10-fold dilutions of the pure compounds from 10-6 M - 10-13 M of a 10-3 M pheromone stock solution in 50% methanol/water stored at -20 °C based on the molecular weight determined in step 6.2. Put the glass vials with the working solutions of L-arginine and the pure compounds in a recirculating water bath to allow the temperature to equilibrate to 8 °C.
Repeat steps 3.7 - 3.18.
Repeat steps 4.1 - 4.2.
Apply the pure compound at the EOG detection threshold concentration to the randomly assigned experimental channel and the vehicle (50% methanol/deionized water) to the control channel using a peristaltic pump at constant rates of 200 mL/min for 5 min.
Repeat steps 4.4 - 4.6.
Representative Results
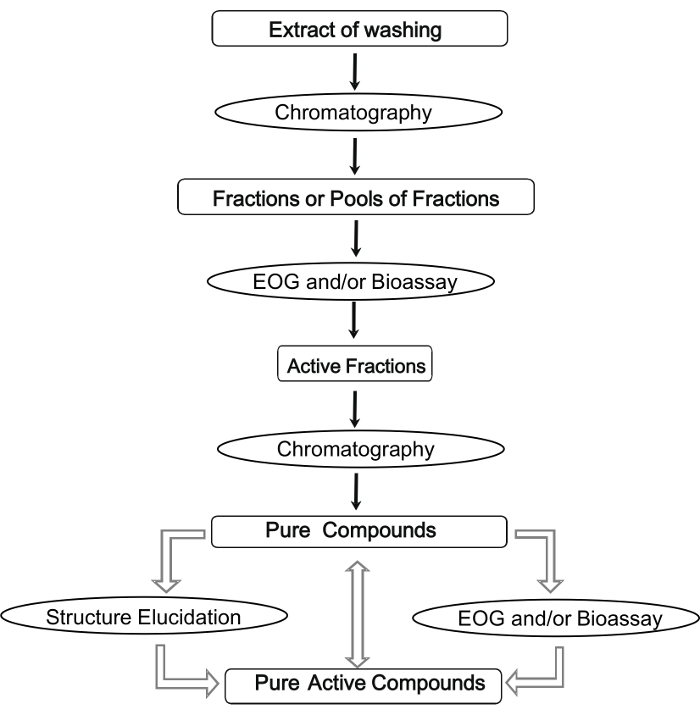
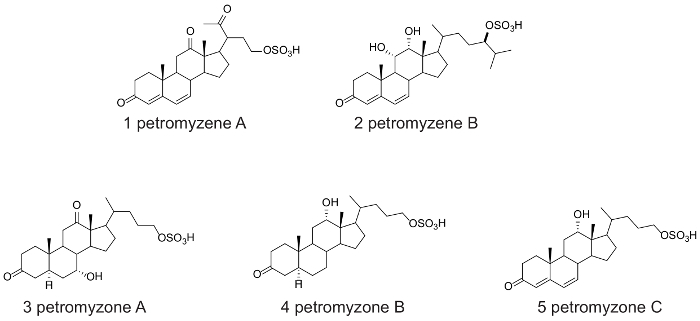
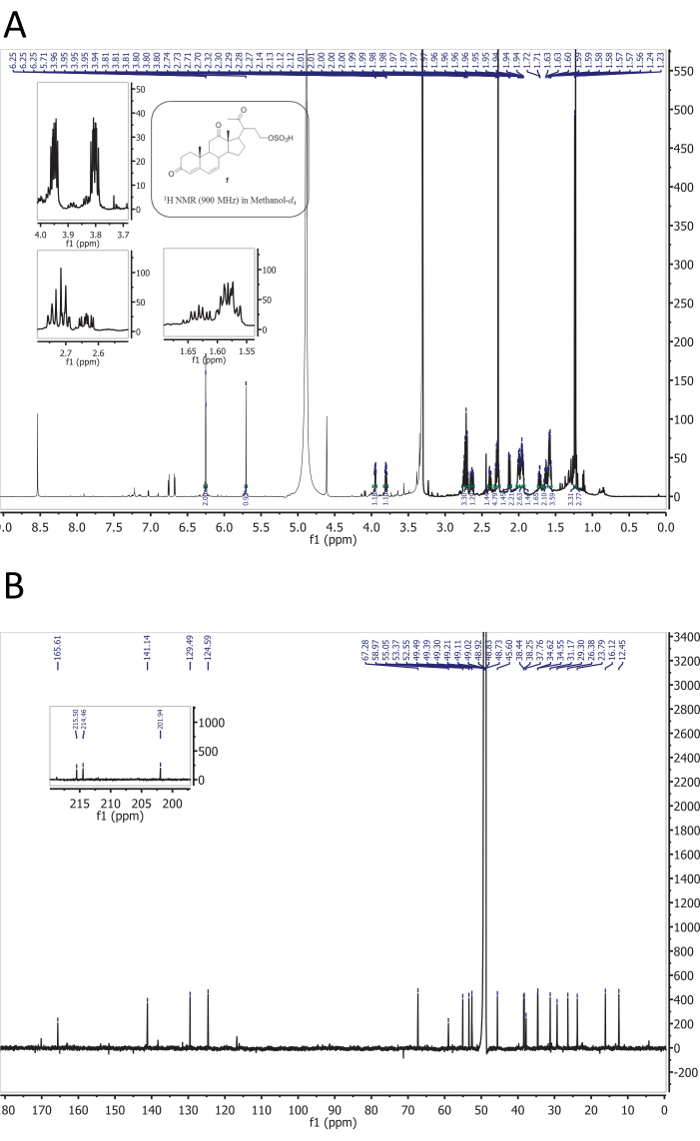
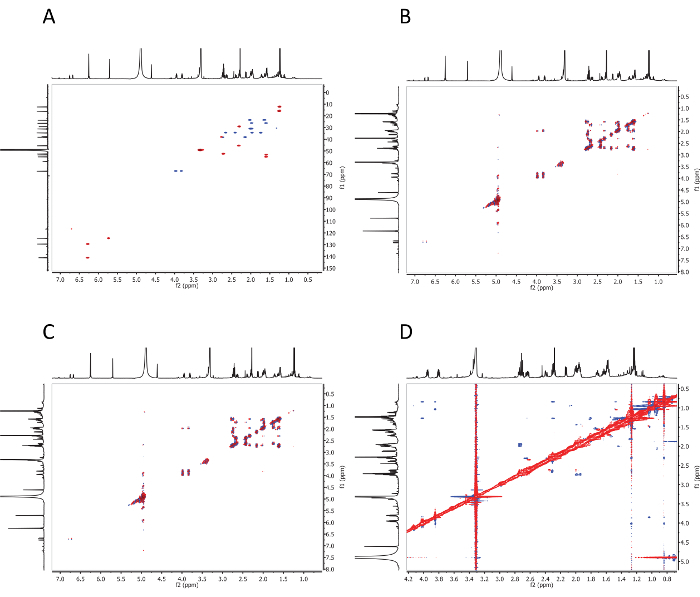
A diagram summarizing the steps described in the protocol of the bioassay-guided fractionation is shown in Figure 1. The protocol involves steps to isolate and characterize the structure, the olfactory potency, and the behavioral activity of 5 putative sea lamprey pheromones (Figure 2). Using the mass spectrometric and NMR data (Figure 3 and Figure 4), the structures of petromyzene A-B and petromyzone A-C were elucidated from water conditioned with mature male sea lampreys22,29.
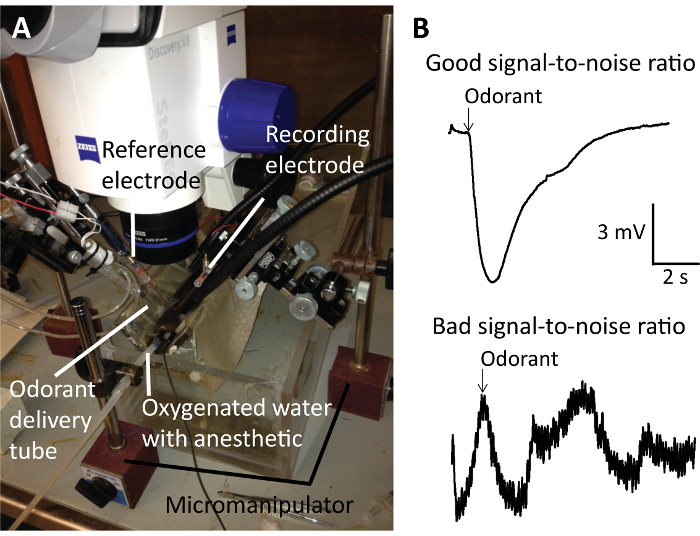
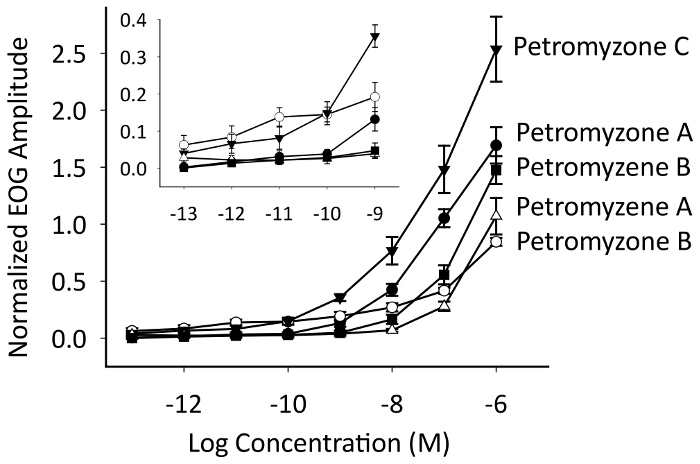
Our representative data from the EOG recordings (Figure 5) demonstrate that petromyzene A-B and petromyzone A-C were all potent odorants that stimulated the adult sea lamprey olfactory epithelium and had low thresholds of detection (Figure 6). Of particular note, the EOG recordings require a proper placement of the recording electrode on the surface of the olfactory epithelium relative to the stimulus delivery tube to result in a good signal-to-noise ratio for reliable odorant response recordings (Figure 5B). If this critical step is not followed, it will be difficult to discern the signal induced by the odorant amongst the high noise. The downward deflection of the EOG trace after the odorant exposure is a negative potential. A good EOG signal should show an odorant administration resulting in a quick and sharp response followed by a recovery to the baseline. The olfactory responses to the putative pheromones were also normalized to the responses of 10-5 M L-arginine, a positive control odorant in the sea lamprey, tested throughout the experiment to ensure the integrity of the recordings was maintained.
In the two-choice maze behavioral assays (Figure 7A), ovulated female sea lampreys were attracted to petromyzone A, petromyzene A, and petromyzene B, and repulsed from petromyzone C. Ovulated females appeared to be repulsed from petromyzone B; however, the behavioral response was not significant (Figure 7B). A larger sample size was not possible due to the limited quantity of petromyzone B. To properly assess the behavioral response to an odorant, it is critical to record the pretreatment bias for the control and experimental channel of each lamprey.
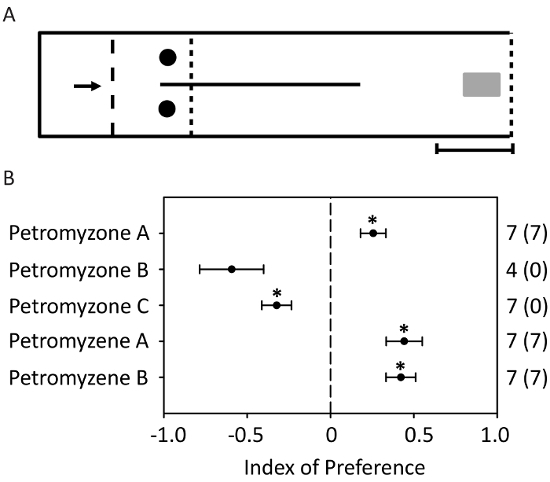
Figure 1: A flowchart of the bioassay-guided fractionation of pheromones. This figure is adapted from Figure 2 in Li, Buchinger, and Li30. The boxes indicate the resulting chemical product from the technique indicated in the oval. Please click here to view a larger version of this figure.
Figure 2: The chemical structures of petromyzene A-B and petromyzone A-C. This figure is modified from the Figures 1 in Li et al.22,29. Please click here to view a larger version of this figure.
Figure 3: 1D NMR spectra. 1D NMR spectra of petromyzene A: (A) the 1H NMR (900 MHz) spectrum and (B) the 13C NMR (225 MHz) spectrum. This figure is from the supporting information in Li et al.29. Please click here to view a larger version of this figure.
Figure 4: 2D NMR spectra. 2D NMR spectra of petromyzene A: (A) the HSQC spectrum, (B) the 1H-1H COSY spectrum, (C) the HMBC spectrum, and (D) the NOESY spectrum. This figure is from the supporting information in Li et al.29. Please click here to view a larger version of this figure.
Figure 5: Electro-olfactogram (EOG) recording preparation and representative trace recordings. (A) This is an EOG preparation showing the exposed sea lamprey olfactory epithelium with the recording electrode, the reference electrode, the odorant delivery tube, and the oxygenated water with the anesthetic. (B) This panel shows representative trace recordings demonstrating good (top) or bad (bottom) signal-to-noise ratios. A good signal-to-noise ratio is necessary for reliable odorant responses recordings. The downward deflection of the EOG trace after the odorant exposure is a negative potential. Please click here to view a larger version of this figure.
Figure 6: A semi-logarithmic plot of electro-olfactogram (EOG) concentration-response curves. Petromyzone A-C and petromyzene A and B were stimulatory to the adult sea lamprey olfactory epithelium and had low detection thresholds. The data are presented as the mean normalized EOG amplitude ± S.E.M. The sample sizes were as follows: petromyzone A, petromyzene A, and petromyzene B (n = 7), and petromyzone B and petromyzone C (n = 5). The inset is an expanded view of EOG responses showing response threshold concentrations. This figure has been modified from Figure 3 in Li et al.22 and Figure 4 in Li et al.29. Please click here to view a larger version of this figure.
Figure 7: A schematic and the results of the two-choice maze used to evaluate the behavioral responses of ovulated female sea lampreys to odorants. (A) The arrow represents the direction of the water flow (0.07 m s-1 ± 0.01). The circles represent the odorant administration points. The small dashed lines represent fine mesh used to restrict the movement of the sea lamprey to the confines of the maze. The large dashed lines represent flow boards used to reduce water turbulence. The gray rectangle represents the release cage. The scale bar = 1 m. This figure is from Figure S1 in Li et al.29. (B) Females were attracted to petromyzone A, petromyzene A, and petromyzene B. The time the lamprey spent in each channel of the maze before and after the odorant exposure (10-12 M) was used to calculate an index of preference to assess its behavioral response to the odorant. A positive value of the index of preference indicates attraction. The sample size, n, is reported outside the parentheses, and the number in the parentheses indicates the number of females across trials that spent more time in the experimental channel compared to the control. The data are presented as mean ± S.E.M. (* p < 0.05; Wilcoxon signed-rank test) to compare the behavioral preference before and after the odorant exposure. This figure has been modified from Figure 4 in Li et al.22 and Figure 5 in Li et al.29. Please click here to view a larger version of this figure.
Supplementary Figure 1: A photograph of the maze. Please click here to download this file.
Discussion
Fish live in a chemical world full of compounds yet to be identified. Bioassay-guided fractionation has proven essential to identify and characterize bioactive molecules that mediate many chemical interactions, such as those observed in masu salmon31, Asian elephants32, and sea lampreys33,34,35. Bioassay-guided fractionation is an effective approach to accurately trace and pinpoint the bioactive compounds from the starting extract to the purified active compound. Using this approach, the identified bioactive compounds can reveal a novel compound with a unique chemical skeleton that is unlikely to be predicted from the known biosynthetic pathways.
EOG recordings are conducted to determine which fractions or compounds elicit olfactory responses. Several technical considerations are imperative to accurately measure the olfactory responses to the putative pheromones with EOG recordings. First, in accordance with the Institutional Animal Care and Use Committee approved procedures, the fish must be deeply anesthetized with 3-aminobenzoic acid ethyl ester (MS222) and immobilized with an intramuscular injection of gallamine triethiodide. The recording electrode will detect any movement of the gills and heartbeat due to an insufficient immobilization, which can be a source of electrical noise. Second, the olfactory epithelium should be immediately exposed to charcoal-filtered water after the dissection to prevent desiccation. Adjusting the location of the recording and reference electrode with the micromanipulators, the electrical ground, and the odorant delivery tube can help maximize the response to the positive control odorant while minimizing the response to the blank control (filtered water). Third, after identifying a sensitive recording location in the olfactory epithelium, it is important to record from a similar position on the lamellae to minimize variation. To consistently record from a similar location, keep the tank and the V-shaped plastic stand holding the fish, the microscope, the odorant delivery tube, and the micromanipulators in the same position. The anesthetic tube must remain in the fish's buccal cavity for the duration of the experiment to ensure it remains anesthetized. However, the placement within the buccal cavity and the flow rate of the anesthetic can be modified if the recording electrode is detecting the movement of the water resulting in an erratic baseline of the electrical signal.
The design of the behavioral assay should be tailored to the behavioral ecology of the test subject and the research question of interest. Two-choice maze behavioral assays are used to determine if any of the odorous fractions are also behaviorally active. Because purified compounds are often only available in minute amounts, the maze is a beneficial behavioral bioassay compared to the stream due to a lower discharge. We were interested in assessing the near-source preference of putative sex pheromones released by mature males predicted to attract mature female mates in close proximity and retain them on a nest for spawning. The behavioral assay was designed to replicate the natural conditions of an ovulated female choosing between the odorants of the mature males. Therefore, it was relevant to test ovulated females as the test subject in our behavior experiments. However, depending on the odorant tested, other test subjects (i.e., different life stage or males) may be more appropriate. Variations on the dimensions of the two-choice maze may be necessary depending on the size of the test subject and the predicted active space of the pheromone (i.e., near source versus long distance)36. Likewise, behavioral responses are often concentration dependent. If a behavioral response is not observed when the putative pheromone is applied at the detection threshold concentration determined with EOG, the concentration of the pheromone should be adjusted. However, it should be noted that even if a compound is a potent odorant, it may not necessarily induce a significant behavioral preference. Ultimately, the behavioral responses observed in the maze should be validated in a field setting with the synthetic compound to confirm the function of the putative pheromone.
One major limitation of bioassay-guided fractionation is the sequential testing of individual fractions or compounds in a bioassay (EOG or behavior). Previous work has shown insect sex pheromones are typically mixtures of multiple components at specific ratios37 that function independently as components38 or synergistically as blends39 to induce the appropriate responses in conspecifics. Therefore, compounds that are only active when present in specific mixtures may be overlooked with bioassay-guided fractionation because they require combinatorial tests to confirm the bioactivity. Other limitations of bioassay-guided fractionation include: 1) a large quantity of starting material is necessary to have a sufficient amount for the structural analysis, EOG, and behavioral assays; 2) the process is time-consuming due to the iterative purification process; and 3) minuscule or unstable compounds are unlikely to be detected. In the future, overcoming some of the technical limitations of bioassay-guided fractionation may require a hybridized approach of bioassay-guided fractionation and metabolomics. Using a hybridized approach, additive or synergistic pheromone effects are more likely to be discerned13 and unstable compounds are more likely to be detected.
The described bioassay-guided fractionation process is specifically designed for the identification of sea lamprey pheromones. However, chemical communication is ubiquitous in the animal kingdom1 and this process can be readily adapted to characterize the pheromones in a broad array of taxa. Pheromone identification and characterization are important because pheromones can be applied to modulate behavioral responses resulting in the control of invasive species or in the restoration of imperiled native species.
Disclosures
The authors have nothing to disclose.
Acknowledgments
We thank the U.S. Geological Survey Hammond Bay Biological Station for the use of their research facilities and the staff of U.S. Fish and Wildlife Service and Fisheries and Oceans Canada for providing sea lampreys. This research was supported by grants from the Great Lakes Fishery Commission to Weiming Li and Ke Li.
References
- Wyatt TD. Pheromones and Animal Behavior: Chemical Signals and Signatures. Cambridge, UK: Cambridge University Press; 2014. [Google Scholar]
- El-Sayed AM. The pherobase: database of insect pheromones and semiochemicals. 2009. Available from: http://www.pherobase.com.
- Zhu J, et al. Reverse chemical ecology: Olfactory proteins from the giant panda and their interactions with putative pheromones and bamboo volatiles. Proceedings of the National Academy of Sciences. 2017;114(46):E9802–E9810. doi: 10.1073/pnas.1711437114. [DOI] [PMC free article] [PubMed] [Google Scholar]
- Leal WS. Reverse chemical ecology at the service of conservation biology. Proceedings of the National Academy of Sciences. 2017;114(46):12094–12096. doi: 10.1073/pnas.1717375114. [DOI] [PMC free article] [PubMed] [Google Scholar]
- Carde RT, Minks AK. Control of moth pests by mating disruption: successes and constraints. Annual Review of Entomology. 1995;40(1):559–585. [Google Scholar]
- Witzgall P, Kirsch P, Cork A. Sex pheromones and their impact on pest management. Journal of chemical ecology. 2010;36 doi: 10.1007/s10886-009-9737-y. [DOI] [PubMed] [Google Scholar]
- Cheng Y-n, Wen P, Dong S-h, Tan K, Nieh JC. Poison and alarm: the Asian hornet Vespa velutina uses sting venom volatiles as an alarm pheromone. Journal of Experimental Biology. 2017;220(4):645–651. doi: 10.1242/jeb.148783. [DOI] [PubMed] [Google Scholar]
- Howse P, Stevens J, Jones OT. Insect Pheromones and Their Use in Pest Management. Springer Science & Business Media; 2013. [Google Scholar]
- Pizzolon M, et al. When fathers make the difference: efficacy of male sexually selected antimicrobial glands in enhancing fish hatching success. Functional Ecology. 2010;24(1):141–148. [Google Scholar]
- Stacey N, Sorensen P. Hormones in communication | Hormonal Pheromones Encyclopedia of Fish Physiology. Elsevier Inc; 2011. [Google Scholar]
- Kobayashi M, Sorensen PW, Stacey NE. Hormonal and pheromonal control of spawning behavior in the goldfish. Fish Physiology and Biochemistry. 2002;26(1):71–84. [Google Scholar]
- Stacey N. Hormonally-derived pheromones in teleost fishes. Fish Pheromones and Related Cues. 2015. pp. 33–88.
- Kuhlisch C, Pohnert G. Metabolomics in chemical ecology. Natural Product Reports. 2015;32(7):937–955. doi: 10.1039/c5np00003c. [DOI] [PubMed] [Google Scholar]
- Prince EK, Pohnert G. Searching for signals in the noise: metabolomics in chemical ecology. Analytical and Bioanalytical Chemistry. 2010;396(1):193–197. doi: 10.1007/s00216-009-3162-5. [DOI] [PubMed] [Google Scholar]
- Teeter J. Pheromone communication in sea lampreys (Petromyzon marinus): implications for population management. Canadian Journal of Fisheries and Aquatic Sciences. 1980;37(11):2123–2132. [Google Scholar]
- Moore H, Schleen L. Changes in spawning runs of sea lamprey (Petromyzon marinus) in selected streams of Lake Superior after chemical control. Canadian Journal of Fisheries and Aquatic Sciences. 1980;37(11):1851–1860. [Google Scholar]
- Vrieze LA, Bergstedt RA, Sorensen PW. Olfactory-mediated stream-finding behavior of migratory adult sea lamprey (Petromyzon marinus) Canadian Journal of Fisheries and Aquatic Sciences. 2011;68 [Google Scholar]
- Wagner CM, Jones ML, Twohey MB, Sorensen PW. A field test verifies that pheromones can be useful for sea lamprey (Petromyzon marinus) control in the Great Lakes. Canadian Journal of Fisheries and Aquatic Sciences. 2006;63(3):475–479. [Google Scholar]
- Wagner CM, Twohey MB, Fine JM. Conspecific cueing in the sea lamprey: do reproductive migrations consistently follow the most intense larval odour? Animal Behaviour. 2009;78 [Google Scholar]
- Siefkes MJ, Winterstein SR, Li W. Evidence that 3-keto petromyzonol sulphate specifically attracts ovulating female sea lamprey Petromyzon marinus. Animal Behaviour. 2005;70 [Google Scholar]
- Siefkes MJ, Steeves TB, Sullivan WP, Twohey MB, Li W. Great Lakes Fisheries Policy and Management. East Lansing, MI: Michigan State University Press; 2013. Sea lamprey control: past, present, and future; pp. 651–704. [Google Scholar]
- Li K, et al. Three Novel Bile Alcohols of Mature Male Sea Lamprey (Petromyzon marinus) Act as Chemical Cues for Conspecifics. Journal of Chemical Ecology. 2017;43(6):543–549. doi: 10.1007/s10886-017-0852-x. [DOI] [PubMed] [Google Scholar]
- Hird SJ, Lau BP-Y, Schuhmacher R, Krska R. Liquid chromatography-mass spectrometry for the determination of chemical contaminants in food. TRAC Trends in Analytical Chemistry. 2014;59:59–72. [Google Scholar]
- Little JL, Williams AJ, Pshenichnov A, Tkachenko V. Identification of "known unknowns" utilizing accurate mass data and ChemSpider. Journal of the American Society for Mass Spectrometry. 2012;23(1):179–185. doi: 10.1007/s13361-011-0265-y. [DOI] [PubMed] [Google Scholar]
- Beckonert O, et al. Metabolic profiling, metabolomic and metabonomic procedures for NMR spectroscopy of urine, plasma, serum and tissue extracts. Nature Protocols. 2007;2(11):2692. doi: 10.1038/nprot.2007.376. [DOI] [PubMed] [Google Scholar]
- Kaiser B, Wright A. Draft Bruker XRF Spectroscopy User Guide: Spectral Interpretation and Sources of Interference. Madison, WI: BRUKER; 2008. [Google Scholar]
- Breitmaier E, Sinnema A. Structure Elucidation by NMR in Organic Chemistry: A Practical Guide. Chichester, New York, Brisbane, Toronto, Singapore: Wiley; 1993. [Google Scholar]
- Seco JM, Quinoá E, Riguera R. The assignment of absolute configuration by NMR. Chemical Reviews. 2004;104(1):17–118. doi: 10.1021/cr2003344. [DOI] [PubMed] [Google Scholar]
- Li K, et al. Bile Salt-like Dienones Having a Novel Skeleton or a Rare Substitution Pattern Function as Chemical Cues in Adult Sea Lamprey. Organic Letters. 2017. [DOI] [PubMed]
- Li K, Buchinger TJ, Li W. Discovery and characterization of natural products that act as pheromones in fish. Natural Product Reports. 2018. In press. [DOI] [PubMed]
- Yambe H, et al. L-Kynurenine, an amino acid identified as a sex pheromone in the urine of ovulated female masu salmon. Proceedings of the National Academy of Sciences. 2006;103(42):15370–15374. doi: 10.1073/pnas.0604340103. [DOI] [PMC free article] [PubMed] [Google Scholar]
- Rasmussen L, Lee TD, Zhang A, Roelofs WL, Daves GD., Jr Purification, identification, concentration and bioactivity of (Z)-7-dodecen-1-yl acetate: sex pheromone of the female Asian elephant, Elephas maximus. Chemical Senses. 1997;22(4):417–437. doi: 10.1093/chemse/22.4.417. [DOI] [PubMed] [Google Scholar]
- Sorensen PW, et al. Mixture of new sulfated steroids functions as a migratory pheromone in the sea lamprey. Nature Chemical Biology. 2005;1(6):324–328. doi: 10.1038/nchembio739. [DOI] [PubMed] [Google Scholar]
- Hoye TR, et al. Details of the structure determination of the sulfated steroids PSDS and PADS: New components of the sea lamprey (Petromyzon marinus) migratory pheromone. The Journal of organic chemistry. 2007;72(20):7544–7550. doi: 10.1021/jo070957l. [DOI] [PubMed] [Google Scholar]
- Fine JM, Sorensen PW. Isolation and biological activity of the multi-component sea lamprey migratory pheromone. Journal of Chemical Ecology. 2008;34(10):1259–1267. doi: 10.1007/s10886-008-9535-y. [DOI] [PubMed] [Google Scholar]
- De Buchinger TJ, Wang H, Li W, Johnson NS. Evidence for a receiver bias underlying female preference for a male mating pheromone in sea lamprey. Proceedings of the Royal Society of London B: Biological Sciences. 2013;280 doi: 10.1098/rspb.2013.1966. [DOI] [PMC free article] [PubMed] [Google Scholar]
- De Bruyne M, Baker T. Odor detection in insects: volatile codes. Journal of Chemical Ecology. 2008;34(7):882–897. doi: 10.1007/s10886-008-9485-4. [DOI] [PubMed] [Google Scholar]
- Bradshaw J, Baker R, Lisk J. Separate orientation and releaser components in a sex pheromone. Nature. 1983;304(5923):265–267. [Google Scholar]
- Linn C, Campbell M, Roelofs W. Pheromone components and active spaces: what do moths smell and where do they smell it. Science. 1987;237(4815):650–652. doi: 10.1126/science.237.4815.650. [DOI] [PubMed] [Google Scholar]


